


Servicios Personalizados
Revista
Articulo
 Inglés (pdf)
 Artículo en XML
 Referencias del artículo
 Enviar artículo por email
Indicadores
-
 Citado por SciELO
 -
 Accesos
Links relacionados
-
 Similares en
SciELO
Similares en
SciELO
Compartir

 Permalink
Geofísica internacional
versión On-line ISSN 2954-436Xversión impresa ISSN 0016-7169
Geofís. Intl vol.52 no.4 Ciudad de México oct./dic. 2013
Original paper
Measurements of upper mantle shear wave anisotropy from a permanent network in southern Mexico
Steven A. C. van Benthem1, Raúl W. Valenzuela2* and Gustavo J. Ponce3
1 Department of Earth Sciences, Utrecht University. Budapestlaan 4, 3584 CD Utrecht, The Netherlands. Formerly at Departamento de Sismología, Instituto de Geofísica, Universidad Nacional Autónoma de México. Mexico D.F., México.
2 Departamento de Sismología, Instituto de Geofísica, Universidad Nacional Autónoma de México. Circuito de la Investigación S/N Cd. Universitaria Del. Coyoacán 04510. México, D.F., México. *Corresponding author: raul@ollin.igeofcu.unam.mx
3 Departamento de Sismología, Instituto de Geofísica, Universidad Nacional Autónoma de México Circuito de la Investigación S/N Cd. Universitaria Del. Coyoacán 04510. México, D.F., México. Also at Departamento de Geofísica, Facultad de Ingeniería, Universidad Nacional Autónoma de México. Mexico D.F., México.
Received: November 13, 2012.
Accepted: December 14, 2012.
Published on line: September 30, 2013.
Resumen
Se midió la anisotropía para las ondas de cortante en el manto superior por debajo de estaciones en el sur de México usando fases SKS. Las direcciones de polarización rápida donde la placa de Cocos se subduce subhorizontalmente están orientadas aproximadamente paralelas con el movimiento relativo entre las placas de Cocos y América del Norte y además son perpendiculares a la trinchera. Por lo tanto, se infiere que la placa subducida arrastra el manto que se encuentra por debajo y lo hace fluir (entrained flow). Una situación similar existe en la zona de subducción de Cascadia. Estudios previos han señalado que estas dos regiones tienen en común la subducción de litosfera joven. En aquellos lugares donde las placas subducidas muestran un cambio en el buzamiento o bien están rotas, se observa un cambio en la orientación de los ejes rápidos. Dichos cambios sugieren que se produce un flujo tridimensional alrededor de las orillas de las placas subducidas, el cual es consistente con el retroceso de la placa subducida (slab retreat or rollback), como ya se había observado en algunos trabajos anteriores. En algunas de las estaciones instaladas lejos de los límites de placa el movimiento absoluto de la placa de América del Norte controla las direcciones rápidas. El eje rápido de una estación ubicada en la Mesa Central se orienta ONO-ESE y es diferente de todas las demás mediciones en este estudio.
Palabras clave: Partición de ondas SKS, anisotropía del manto superior, flujo del manto, zonas de subducción, Fosa Mesoamericana, placas de Cocos, Rivera y América del Norte.
Abstract
Upper mantle shear wave anisotropy under stations in southern Mexico was measured using records of SKS phases. Fast polarization directions where the Cocos plate subducts subhorizontally are oriented in the direction of the relative motion between the Cocos and North American plates, and are trench-perpendicular. This pattern is interpreted as subslab entrained flow, and is similar to that observed at the Cascadia subduction zone. Earlier studies have pointed out that both regions have in common the young age of the subducting lithosphere. Changes in the orientation of the fast axes are observed where the subducting plates change dip and/or are torn, and are thus indicative of 3-D flow around the slab edges. They are consistent with slab rollback, as previously shown by other authors. Some stations located away from the plate boundaries have their fast directions controlled by the absolute motion of the North American plate. The fast axis for station ZAIG, located in the Mesa Central, is oriented WNW-ESE and is different from all the other measurements in this study.
Key words: SKS splitting, upper mantle anisotropy, mantle flow, subduction zones, Middle America Trench, Cocos, Rivera, and North American plates.
Introduction
The use of the teleseismic phase SKS to study upper mantle anisotropy in both seismically quiet and seismically active regions has become a standard tool (Silver, 1996; Savage, 1999; Park and Levin, 2002). The method is based on the intrinsic anisotropy of the seismic velocity of the mineral olivine, which is one of the major components of the upper mantle. Olivine crystals become oriented as they are subjected to strain, usually caused by mantle flow. As the SKS phase travels through an anisotropic medium it becomes split, i. e. a fast and a slow wave are produced. Measurements of shear wave splitting yield two parameters: the fast polarization direction, Φ, usually referred to geographic north, and the delay time, δt. Laboratory experiments are essential to establish the relationship between the direction of mantle flow and the fast polarization direction in olivine. In general, these experiments have shown that the fast axis becomes oriented in the direction of mantle flow (Jung et al., 2006). There is one notable exception, for type-B olivine the fast axis aligns perpendicular to the direction of mantle flow. From these results it is possible to infer the direction of mantle flow using seismic measurements. Connections between seismic anisotropy and the tectonic environment, whether it be active margins or stable continental interiors, have been made in the past (e. g., Silver, 1996; Savage, 1999; Park and Levin, 2002). Particularly, subduction zones have come under intense scrutiny; see Long and Silver (2008, 2009) for a review. Previous work in the case of Mexico has relied mostly on data from temporary deployments and has focused around the Gulf of California (Obrebski et al., 2006; Obrebski and Castro, 2008; van Benthem et al., 2008; Long, 2010), and on subduction of the Rivera and Cocos plates at the Middle America Trench (Stubailo and Davis, 2007, 2012a, 2012b; Bernal-Díaz et al., 2008; Soto et al., 2009; Rojo-Garibaldi, 2012). In the present article, data from a permanent broadband network has been used, thus covering a large area of the country with widely spaced stations. This approach stands in contrast to temporary deployments which usually cover smaller areas with a dense array.
Data and Procedure
Most of the anisotropy measurements in this study used the SKS phase at epicentral distances greater than 90°. Additionally, other core-transmitted phases such as sSKS, SKKS, and PKS were used as available. Clear SKS readings at these distances required a minimum magnitude of 6.0, although occasionally smaller events proved useful. The records were provided by Mexico's Servicio Sismológico Nacional (SSN) broadband network (Singh et al., 1997). The SSN database was searched in the period from May 1998 to early January 2004. It provided a total of 359 earthquakes within the distance and magnitude criteria. Local problems with the equipment precluded the simultaneous recording of some events by all stations. The data were sampled 20 times per second using Streckeisen STS-2 broadband, three-component velocity sensors, except at station TEIG, where a Geotech KS36000 borehole seismometer was installed. Figure 1 shows the study area and the location of the 20 stations used.
The procedure used to measure anisotropy was explained by Silver and Chan (1991) and is presented here only briefly. The split SKS waves are observed in the fast and slow horizontal components, which are orthogonal. In general, these are different from the radial and transverse components, which are also orthogonal. In order to obtain Φ and δt, a time segment containing the SKS arrival, or another P to S conversion at the core-mantle boundary (CMB), is selected from the north-south and east-west horizontal components. The two components are rotated by one degree at a time, with Φ ranging between -90 and 90°. For each value of Φ, the components are time shifted relative to each other using increments of 0.05 s, with δt ranging from 0 to 8 s. For each combination of Φ and δt, the eigenvalues λ1 and λ2 of the covariance matrix between the two orthogonal components are evaluated. For an anisotropic medium, λ1 and λ2 will be different from zero. In the presence of noise, the desired solution will be given by the matrix which is most nearly singular. A grid search is then run through all combinations of (Φ, δt) within the space of possible solutions in order to choose the minimum eigenvalue, λ2min. The actual values of (Φ, δt) associated to λ2min characterize the anisotropy because the highest cross-correlation within the given space occurs for the fast and slow waveforms. Sometimes the measurement returns a null value and splitting of the shear wave cannot be detected, as is the case for any of the three following situations. (1) δt = 0 s indicates the absence of anisotropy. (2) Φ = Φb means that the fast axis, Φ, is oriented with the back azimuth, Φb. (3) Φ = Φb + 90° means that the fast axis is perpendicular to the back azimuth.
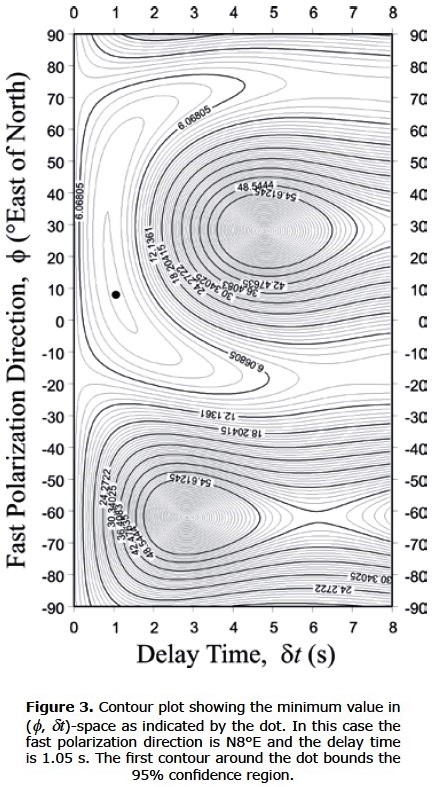
Figure 2a shows the SKS arrival on the radial and transverse components at SSN station OXIG for the earthquake of May 16, 1998 south of the Fiji Islands. The hypocenter was located at 586 km depth and the epicentral distance was 90.10°. Table 1 lists the events used in this study to quantify upper mantle anisotropy. Each SKS waveform was chosen by visual inspection and a first order, bandpass Butterworth filter was applied. In every case an attempt was made to retain the broadest bandpass possible, but the actual corner frequencies were determined based on the frequency of the noise affecting each record. The low frequency corner was chosen in the range from 0.01 to 0.04 Hz (periods between 100 and 25 s) while the high frequency corner varied between 1.0 and 1.5 Hz (from 1 to 0.67 s), which is appropriate for the phases used and the expected delay times (Wolfe and Silver, 1998). A time segment including only the selected phase was cut from the seismogram. In Figure 2 the time series is 33 s long and is typical of the record lengths used throughout this work. Figure 3 shows the combination of (Φ, δt) producing the minimum eigenvalue, λ2min. The black dot means that the delay time, δt, is 1.05 s and the fast axis, Φ, is 8° east of north. The first contour around the dot bounds the 95%: confidence interval for the measurement. All the other contours are multiples of the first one and are located at higher "elevations" or mountains. The black dot is located at the bottom of a valley. The 95%: confidence contour was calculated using equation (16) in Silver and Chan (1991) and taking one degree of freedom for each second of the record containing the SKS arrival (Silver and Chan, 1991; K. M. Fischer, Brown University, personal communication, 1998). The uncertainties are read directly from the contour plots. In this case, the measurement with its ±1σ uncertainty is (Φ, δt) = (8±27°, 1.05±0.65 s). In the event that the 95%: confidence region is not approximately symmetric, the largest of the two possible 1s values is used, i. e. in going from 8° to 35°, as opposed to going from 8° to -5° (Figure 3). The contour plots are also useful to gauge the quality of the measurements. For example, a large 95%: confidence area means that the parameters are poorly constrained. If multiple minima occur then the measurement is not reliable. Another possibility is that the 95%: contour does not close, thus indicating a null measurement. All the individual splitting measurements are reported in Table 2.
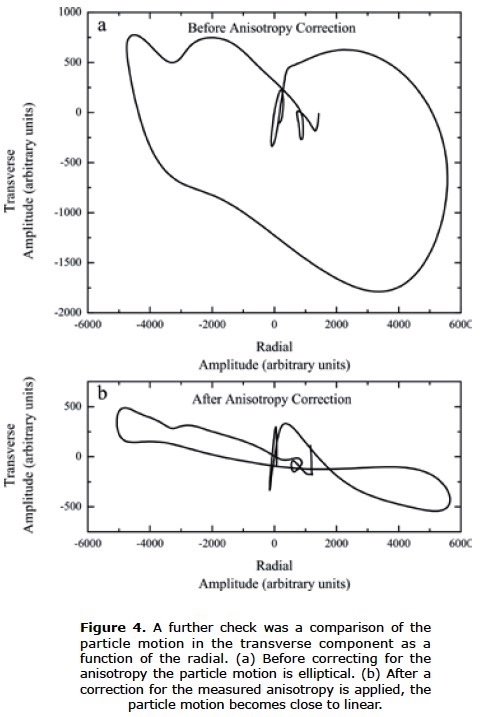
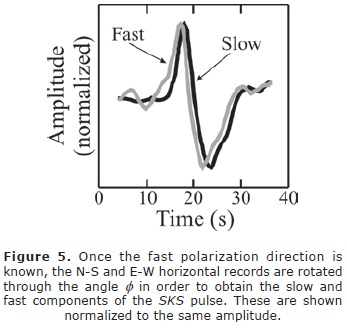
It is important to run a number of checks in order to make sure that the observation of SKS energy on the transverse component is indeed the result of anisotropy and does not arise from a different process such as scattering (Silver and Chan, 1991; Savage, 1999). Likewise, these checks mean that the values determined for f and dt are reliable. (1) An "unsplitting" correction is applied to the radial and transverse records using the estimated splitting parameters. If (Φ, δt) do describe anisotropy, then the SKS wave must disappear, or at least its amplitude is decreased, from the corrected transverse component (Figure 2b). Similarly, the amplitude of SKS is increased on the corrected radial component, although this effect is small. (2) The particle motion of the SKS arrival in the transverse component is plotted as function of the radial component. Before the unsplitting correction, particle motion must be approximately elliptical (Figure 4a), and after correction it becomes nearly linear (Figure 4b). (3) The N-S and E-W records are rotated through the angle Φ to obtain the slow and fast components of the SKS pulse. The fast and slow waveforms must have roughly the same shape and the fast SKS must arrive before the slow SKS by an amount approximately equal to the measured δt (Figure 5). Shifting the slow wave forward by a time δt should align it with the fast wave.
Results
Table 1 lists the events that provided useful data for this study. Earthquake information includes the date, origin time, hypocenter, magnitude, and the geographic location. A total of 136 individual splitting measurements were made at twenty different stations and are given in Table 2. The parameters are the fast polarization direction and the delay time, both with their corresponding 1s uncertainties. Also provided are the date of the event, the back azimuth, and the phase used (SKS, SKKS, sSKS, or PKS). The observed orientations of the fast polarization direction practically span the whole space of possible solutions, from -90 to 90°. The smallest 1σΦ uncertainty for the fast polarization direction is 5°, while the largest is 92°. The latter value is quite large and such an estimate normally would not be reliable. In general, such large uncertainties arise from a poor signal-to-noise ratio. We allowed large uncertainties for a few measurements if the data at the station were scarce. Furthermore, Wolfe and Silver (1998) showed that in certain cases, stacking measurements with large error regions can lead to improved estimates of the splitting parameters. As explained below, our measurements for each station were averaged using the stacking method proposed by Wolfe and Silver (1998) and consequently have smaller 1σ uncertainties than the individual measurements. It is worth mentioning that the average uncertainty in Table 2 is 37°. The smallest delay time is 0.40 s and the largest is 2.25 s. The average delay time is 1.20 s. The smallest 1σδt uncertainty for the delay time is 0.20 s, and the largest is 4.20 s at station CCIG, although this is an extreme value. The second largest 1σδt uncertainty is 2.60 s. The average uncertainty, however, is much lower at 0.96 s. The station with the largest number of observations is PLIG with nineteen records showing clearly split waveforms and three null measurements given that it had the largest number of records meeting the selection criteria previously explained. Station CUIG had the fewest observations, only one with a clearly split waveform was available. Since this station is located within Mexico City, cultural noise is certainly a problem. On average, 6.8 measurements are reported per station. Some sites are noisier than others. Additionally, the stations were not installed simultaneously and some of them had been running for only a short time when the data for this study were gathered. Even though records from 359 different earthquakes were analyzed, only 57 of them generated observable P to S CMB conversions at the various stations. The individual splitting parameters are shown in Figure 6.
Average splitting parameters were calculated for each station using the stacking method of Wolfe and Silver (1998). The error surface associated to the contour plot of each individual measurement is normalized by its minimum eigenvalue, λ2,imin. The normalized error surfaces from all measurements at the station are then summed. In this way, the best splitting parameters are given by the minimum value of the sum and a new 95%: confidence interval is obtained. As the noise properties vary for different earthquakes, stacking events with a similar polarization improves the final result (Wolfe and Silver, 1998). Therefore, the size of the 95%: confidence region for the averaged values is smaller than for the individual measurements. The averaged splitting parameters are presented in Table 3, which includes the fast polarization direction and the delay time, both with their corresponding 1σ uncertainties, as well as the stations' coordinates and geographic location, and the total number of clearly split and null measurements. In this case, the smallest 1σΦ uncertainty for the fast polarization direction is 4°, while the largest is 21°. Strictly speaking, there are three uncertainties of 55, 43, and 49° at stations CUIG, HUIG, and TUIG, respectively. These stations only had one split measurement each and so the individual measurement is reported as the average. As shown in Table 2 and in Figure 6, the results at stations HUIG and TUIG are considered reliable because they also had null measurements consistent with the only split value reported. The average 1σΦ uncertainty in Table 3 is 16°. The smallest delay time is 0.50 s and the largest is 1.90 s. The average delay time is 1.09 s. The smallest 1σδt uncertainty for the delay time is 0.10 s, while the largest is 1.25 s. The average uncertainty is 0.46 s. Station SCIG only had two null measurements from nonorthogonal back azimuths, so it is interpreted to have splitting below the threshold of the data. The averaged splitting parameters are shown in Figure 1.
Discussion
Figure 1 shows the averaged splitting parameters at each station and the tectonic environment of the study area. The best coverage is found between 94 and 101°W longitude. The study area was divided into several regions based on variations in the tectonic environment as well as differences in the measured anisotropy parameters. They are discussed below.
Mexican Subduction Zone Between 96 and 101°W Longitude
In this region (Figure 1), subduction of the Cocos plate under the North American plate at the Middle America Trench (MAT) is bounded by the landward extension of the Orozco Fracture Zone (OFZ) and the Tehuantepec Ridge (TR). The relative velocity between the Cocos and North American plates increases from 5.7 cm/yr in the northwest to 7.3 cm/yr in the southeast (model PVEL in DeMets et al. (2010)) while the Cocos plate moves in the direction ~N31°E. The fast polarization direction for many stations in this region is approximately the same as the relative plate motion (RPM) between the Cocos and North American plates, and approximately perpendicular to the MAT. Most of these stations overlie the Cocos plate where it subducts subhorizontally (Pardo and Suárez, 1995; Pérez-Campos et al., 2008; Husker and Davis, 2009) and likely reflect the flow direction of the upper mantle below the slab. Given the conditions expected to prevail beneath the slab, such as low stress, low water content, and relatively high temperature, we assume that the lattice preferred orientation (LPO) of olivine is of type-A (Jung et al., 2006; Long and Silver, 2008). Therefore, the fast anisotropy axis and mantle flow are oriented in the same direction. It also follows that flow is entrained under the subhorizontal Cocos slab. Most regions with substantial subslab splitting around the world, however, show trench-parallel Φ, which is interpreted as 3-D return flow induced by trench migration (Long and Silver, 2008). Perhaps the most notable exception is the Cascadia subduction zone, where a trench-perpendicular pattern has been found (Currie et al., 2004; Long and Silver, 2008). Trench-perpendicular fast directions have also been reported by other studies in Mexico using SKS phases. Soto et al. (2009) found trench-perpendicular Φ where the Rivera plate subducts beneath the Jalisco block (the region between stations CJIG and COIG in Figures 1 (2,3,4,5,6) and 7 of this study). Data from the Mesoamerican Subduction Experiment (MASE) array, a line of 100 seismometers running north and starting just east of CAIG (Figure 1), show an average Φ of N41°E for stations in the fore-arc, while Φ averages N8°W for stations in the back-arc (the volcanic arc is located at the southern edge of the Trans-Mexican Volcanic Belt) (Stubailo and Davis, 2007, 2012a, 2012b; Rojo-Garibaldi, 2012). Farther east, measurements from the Veracruz-Oaxaca (VEOX) profile, a line of 46 seismometers running north-south across the Isthmus of Tehuantepec (just west of CMIG in Figure 1), reveal fast directions consistent with nearby SSN stations TUIG, CMIG, and HUIG (Bernal-Díaz et al., 2008).
In order to allow for the 3-D return flow induced by trench migration observed at most subduction zones, Long and Silver (2008, 2009) propose the existence of a thin decoupling zone between the downgoing slab and the subslab mantle. The decoupling zone may result from the entrainment of a thin layer of buoyant asthenosphere which is produced through shear strain and shear heating (Phipps Morgan et al., 2007; Long and Silver, 2008, 2009). In this study, however, the approximately trench-perpendicular fast directions observed beneath the Cocos plate in the Mexican states of Guerrero and Oaxaca, just like observations at Cascadia (Long and Silver, 2009), suggest that the thin decoupling zone does not exist. Therefore, the downgoing slab and sub-slab mantle are coupled at depth, which results in entrained flow. The age of the subducting oceanic Cocos plate at the MAT offshore Guerrero and Oaxaca is approximately between 12 and 16 Myr (Kanjorski, 2003). Both Cascadia and the Middle America Trench represent the most extreme examples of the subduction of young lithosphere. Consequently, Long and Silver (2009) hypothesize that the amount of strain is not yet high enough for the shear mechanism to reach steady state and so decoupling has not yet occurred. Farther east along the MAT, in Nicaragua and Costa Rica, Abt et al. (2010) interpret their anisotropy measurements using teleseismic SKS and local S phases as mantle flow parallel to the trench, both beneath the subducted Cocos slab and in the mantle wedge. The age of the lithosphere subducting at the MAT there is between 18 and 24 Myr (Abt et al., 2009).
The trench-perpendicular fast directions found beneath the Cocos plate in Guerrero and Oaxaca in the present study stand in contrast to the trench-parallel fast directions observed by Stubailo et al. (2012) using Rayleigh waves. They obtained phase velocity maps for waves of different periods in the range from 16 to 100 s. Since phase velocities provide a depth-integrated image of the upper mantle, they inverted the phase velocity maps and determined a 3-D model for shear wave velocity and anisotropy. Their model is parameterized into three layers: the continental crust, mantle lithosphere, and asthenosphere down to a depth of 200 km. Both the lithospheric and asthenospheric layers show trench-parallel fast directions in the fore-arc with values ranging between 0.5 and 2%: ψ in anisotropy. Farther west, coincident with the landward projection of the Orozco Fracture Zone, the fast axes become trench-perpendicular. Stubailo et al. (2012) interpret these results as toroidal flow into the mantle wedge coming in from the two edges that limit the segment of the Cocos slab located between the OFZ to the east and the Rivera slab to the west. If the trench-parallel fast directions observed by Stubailo et al. (2012) in Guerrero and Oaxaca, where the slab is subhorizontal, are interpreted as 3-D return flow produced by trench rollback, this would be inconsistent with our interpretation of entrained flow. The delay times measured from SKS splitting in this region range from 0.5 to 1.9 s. Using the common assumption that shear wave anisotropy is 4%: (Silver and Chan, 1991; Savage, 1999), a delay time of 1 s corresponds to an effective thickness for the anisotropic layer of 115 km. Therefore, the observed delay times translate into anisotropic layer thicknesses between 60 and 220 km. It is possible that the anisotropic regions sampled by the Rayleigh and SKS waves are different given that their paths are different. The sensitivity kernel for a period of 100 s peaks at a depth of 140 km (Stubailo et al., 2012) and so Rayleigh waves sample the lithosphere preferentially. Thus, if the SKS anisotropic layer is placed under the Rayleigh wave anisotropic layer, it would start at a depth of ~150 km. Admittedly, the vertical resolution for shear wave splitting is poor, but it is generally agreed that anisotropy resides in the shallow part of the upper mantle (Silver, 1996; Savage, 1999). If the anisotropic layer in the present study is placed too deep, however, it will no longer be in contact with the subducted slab and consequently entrained flow cannot be used to explain the observed anisotropy. A possible way to resolve this discrepancy may be to carry out a joint inversion of the surface wave and SKS data. Anisotropy in this region has also been reported by other researchers. Song and Kim (2012b) found that the upper oceanic crust of the subducting Cocos slab is an ultraslow-velocity layer (USL). It is 3 to 5 km thick and it shows anisotropy larger than 5%. Additionally, Song and Kim (2012a) discovered that the topmost 2-6 km of the Cocos subducted oceanic mantle is an anisotropic high-velocity lid (HVL).
The average δt±σδt for stations in the fore-arc with trench-perpendicular Φ is 1.20±0.41 s. The trench migration (retreating) velocity for this segment of the MAT is 21 mm/yr (Heuret and Lallemand, 2005). Long and Silver (2008) proposed a relationship for average subslab δt as a function of trench migration velocity, mostly for trench-parallel Φ(Cascadia is an exception but it is also included). The values given above plot in their Figure 2 close to the entry for the MAT in Nicaragua and Costa Rica but δt is smaller for Guerrero and Oaxaca, so they are roughly consistent with the trend observed by Long and Silver (2008). Calculation with the equation given in the caption to their Figure 2 predicts δt = 0.72 s for the MAT in Guerrero and Oaxaca.
Mexican Subduction Zone East of 96°W Longitude
A slight (~25°) clockwise rotation of the anisotropy fast axes is observed for stations HUIG, CMIG, and TUIG relative to nearby stations PNIG, OXIG, and TPIG which are located to the west (Figure 1). These directions are also consistent with preliminary SKS results from the N-S VEOX profile deployed just west of CMIG (Bernal-Díaz et al., 2008). Using VEOX data and local earthquakes within the Cocos slab, León-Soto et al. (2011) found that the fast anisotropy axis is trench-perpendicular in the mantle wedge. Several changes in subduction zone morphology take place in this area: (1) The Middle America Trench makes a bend southeast of station HUIG. (2) The Tehuantepec Ridge intersects the MAT. The TR has long been recognized as a sharp contrast in the properties of the Cocos plate. The oceanic crust of the Guatemala Basin in the southeast is older and deeper than the region northwest of the TR; see Manea et al. (2005) for a review. (3) The coastline is farther away from the MAT than in the area located to the west, which implies the existence of a broad continental shelf. (4) The subducting Cocos plate is not subhorizontal anymore and dips at an angle of ~25° (Pardo and Suárez, 1995; Rodríguez-Pérez, 2007; Melgar and Pérez-Campos, 2011; Kim et al., 2011). Furthermore, recent results suggest the possibility of a tear in the slab somewhere in the region where it changes from subhorizontal to a dip of ~25° (Pérez-Campos et al., 2012). The rotation of the SKS fast axes may be caused by the change in dip of the Cocos slab. Furthermore, this orientation may be transitional to the orientation of the fast axis at station TEIG in the Yucatán peninsula, which coincides with the absolute motion of the North American plate.
Farther east (Figure 1), the fast axis is oriented NNE-SSW and has a short delay time (0.60±0.25 s) at station CCIG. This direction agrees with the RPM between Cocos and North America and is roughly trench-perpendicular. South of CCIG the hypocenters reach depths of ~175 km and the Cocos slab subducts more steeply (~45°) than in the region to the west (Rodríguez-Pérez, 2007). The fast direction may be consistent with corner flow within the mantle wedge.
Mexican Subduction Zone West of 101°W Longitude
A few stations are available at the western end of the subducting Cocos plate and around the Rivera plate. Between the MAT and the coastline, the boundary between the Cocos and Rivera plates is continued by the bathymetric feature known as El Gordo Graben, which further extends on land as the N-S trending Colima rift. Additionally, Colima volcano is located within the rift. The Rivera plate subducts more steeply than the adjacent Cocos slab (Pardo and Suárez, 1995) and a gap between the two was imaged tomographically at depths greater than 150 km (Yang et al., 2009). This gap is located under the rift. Delay times at stations CJIG, COIG, and ZIIG are short and range from 0.60 to 0.75 s (Figure 1). Soto et al. (2009) previously used data from CJIG and COIG together with records from the Mapping the Rivera Subduction Zone (MARS) experiment. The present study concurs with the interpretation of Soto et al. (2009). The fast direction at station CJIG, and also at their stations MA37 and MA55, shows that the subslab mantle beneath the forearc flows around the western edge of the Rivera slab as the subducted plate rolled back (Figure 7). The fast directions at COIG and stations MA01, MA14, MA19, MA24, and MA48 (Soto et al., 2009) within the Colima rift (Figure 7) are consistent with mantle flow through the slab gap between the Rivera and Cocos plates, and perhaps with the fact that Colima volcano is located within the rift (Yang et al., 2009). Ferrari et al. (2001) documented rollback of the Rivera plate based on the trenchward migration of the volcanic front and further proposed asthenospheric infiltration into the mantle wedge from both the western and eastern edges of the subducted Rivera slab. Recent results of laboratory, analog models of the Rivera and Cocos slabs reveal complex patterns of toroidal and corner flows in agreement with seismic anisotropy studies (Neumann et al., 2012).
The SKS fast axis at station ZIIG is oriented N13°W and looks clearly different from observations to the east, where the fast axis is roughly parallel to the RPM between Cocos and North America (Figure 1). ZIIG is located near the projected extension of the Orozco Fracture Zone beneath the North American plate. The subducting Cocos plate dips more steeply west of the projected OFZ than to the east, where the subhorizontal slab is found (Pardo and Suárez, 1995). Both Stubailo et al. (2012) and Dougherty et al. (2012) presented evidence for a tear in the Cocos slab underneath the projection of the OFZ. The SKS anisotropy pattern at ZIIG is consistent with flow through the gap in between the two segments of the torn slab. Furthermore, Stubailo et al. (2012) interpreted the anisotropy in their Rayleigh wave data in terms of toroidal mantle flow around the slab edges driven by slab rollback (Ferrari, 2004). The fast anisotropy axes in the region around ZIIG from surface wave data sampling the mantle lithosphere and asthenosphere are oriented slightly east of north (Stubailo et al., 2012) and are somewhat different from the SKS data in the present study given that the fast axis at ZIIG is oriented slightly west of north.
Fast Axes Oriented With the Absolute Plate Motion of North America
The absolute motion of the North American plate throughout southern Mexico is about 4 cm/yr and is oriented in a direction ~N254°E according to model HS3-NUVEL1A in Gripp and Gordon (2002); see Figure 1. A few stations (MOIG, YAIG, and PLIG) in or near the TMVB have their fast directions aligned with the APM and their delay times range from 1.00 to 1.15 s. Such a pattern can be explained as the rigid lithosphere moves and consequently drags the asthenosphere below (Silver, 1996). It is expected in regions where other tectonic processes have not operated and is observed frequently. The alignment of the fast axes with the APM at these stations may signal a change in the tectonic regime as one moves away from the MAT. Soto et al. (2009) found the fast axes for stations within the Colima rift oriented ~N-S. Stations located just east of the Colima rift and south of the Chapala-Tula rift (CTR), however, show fast axes rotated to ~NE-SW and ~ENE-WSW. Interestingly, the fast axes at the northernmost stations MA16, MA23, and MA27, just south of the CTR, agree with the measurements at MOIG located at about the same latitude but ~200 km farther east (Figure 7), which might suggest a consistent trend for stations within the TMVB east of Colima rift.
A single splitting measurement at CUIG (38±55°, 1.20±1.25 s) is poorly constrained but its large 95%: confidence interval is consistent with nearby stations in the northern segment of the MASE deployment where the fast direction is oriented slightly west of north (Rojo-Garibaldi, 2012). Station TEIG was installed in the Yucatán peninsula and is found in an entirely different tectonic setting. The fast axis here agrees with the APM of North America and is consistent with its location away from current plate boundaries.
Station ZAIG in the Mesa Central
ZAIG is the northernmost station in the present study (Figure 1). The SSN coverage in this part of the country is sparse since it is far away from the seismogenic plate boundaries. The fast axis is oriented WNW-ESE and is clearly different from that observed in any of the other stations analyzed. The station is located within the Mesa Central, which is an elevated plateau and is recognized as a morphotectonic province. It is bounded to the south by the TMVB, to the west by the Sierra Madre Occidental, and to the north and east by the Sierra Madre Oriental (SMOr), which separates it from the Eastern Mexican Basin and Range farther north (Sedlock et al., 1993). The Mesa Central was under compression during the Laramide orogeny which created the SMOr to the east (Nieto-Samaniego et al., 2005). It was subsequently subjected to extension, likely related to the Basin and Range. The main episodes of extension occurred during the Eocene, oriented NE-SW; and during the Oligocene, with predominant extension of ~20%: oriented E-W plus ~10%: extension oriented N-S (Nieto-Samaniego et al., 2005). Neither the episodes of compression nor extension can explain the orientation of Φ. The fast axis is predicted to align parallel to transpressional structures, and parallel to the extension direction (Silver, 1996). The APM of North America cannot explain the orientation of Φ either (Figure 1). It should be mentioned that in the Western Mexican Basin and Range the direction of f is consistent with both the current APM of North America and with extension during the Miocene (Obrebski et al., 2006; van Benthem et al., 2008). Comparison with the Rayleigh wave model of Stubailo et al. (2012) shows that ZAIG is located in their low resolution area. It is nonetheless interesting that the fast direction in their model at periods from 44 to 85 s agrees with the fast direction observed in the present study.
Another possibility for explaining the anisotropy at ZAIG is to look at the evolution of the subducted slab in the mantle. The P wave velocity tomographic model of Yang et al. (2009) can image the subducted Rivera plate down to depths of ~350 km. They speculate that the leading edge of the slab may have detached from the upper portion and might be found at greater depths. Likewise, the adjacent Cocos slab to the east can be followed as a continuous feature from the surface down to a depth of ~400 km, which is the lower limit of their model. The S wave velocity tomographic model of van der Lee and Nolet (1997a, 1997b) images the broken and subducted Farallon plate in the upper mantle. The slab shows roughly a WNW-ESE trend, which agrees with the fast anisotropy axis at ZAIG. The southernmost extent of the Farallon slab at a depth of ~350 km is located underneath station ZAIG. Being at such a great depth it is unclear, however, how the slab might control the anisotropy observed at ZAIG. On the other hand, the P wave velocity tomography of Gorbatov and Fukao (2005) shows the Farallon slab under ZAIG at a depth of ~400 km, but it trends roughly E-W.
Conclusions
The fast anisotropy polarization directions for stations located where the Cocos plate subducts subhorizontally, beneath Guerrero and Oaxaca states, are oriented with the relative motion between the Cocos and North American plates and are perpendicular to the Middle America Trench. This observation is consistent with subslab entrained flow in a regime of type-A olivine. The situation is similar to that reported in Cascadia, except that the slab is not subhorizontal. At most subduction zones around the world, however, Φ is trench-parallel, which may be caused by a thin asthenospheric layer that decouples the downgoing slab from the subslab mantle and allows flow to be driven by trench migration. Given the young age of the lithosphere being subducted, both in Mexico and in Cascadia, the decoupling layer may be absent. The fast directions observed around the edges of the Rivera slab, and near the projection of the Orozco Fracture Zone under the continent, are consistent with mantle flow around the edges of the torn slabs. Furthermore, this flow is driven by slab rollback. Stations located east of the subhorizontal slab, where the subducting plate starts to increase its dip, show a slight clockwise rotation of their fast axes relative to nearby stations located to the west. A few stations in or near the TMVB, and away from the plate boundaries, show fast directions consistent with asthenospheric flow driven by the absolute motion of the North American plate. The same is also true for one station in the Yucatán peninsula. Finally, the fast polarization direction for a single station within the Mesa Central is oriented WNW-ESE and it is different from measurements at any of the other stations. Previous episodes of compression and subsequent extension in the region fail to account for this direction. The fast direction is also inconsistent with the APM of North America.
Acknowledgments
We are thankful to Karen Fischer for providing the computer code to measure the splitting parameters; Fernando Terán for the computer code to check the measurements; Manuel Velásquez for computer support; Hanneke Paulssen, Karen Fischer, Arie van der Berg, Renate den Hartog, Vlad Manea, Rob Govers, and Rob Clayton for discussions and suggestions; and Jeremías Basurto and Antonio Lozada for help with data analysis in the early stages of this project. The suggestions made by Raúl Castro, Rob Clayton, and Gerardo León greatly enriched the manuscript. The operation and data acquisition from Mexico's Servicio Sismológico Nacional broadband network has been possible due to the work by Javier Pacheco, Carlos Valdés, Shri Krishna Singh, Arturo Cárdenas, José Luis Cruz, Jorge Estrada, Jesús Pérez, and José Antonio Santiago. One of us (SACvB) received partial funding from the Molengraaff Fonds and Trajectum Beurs for travel to and living expenses while in Mexico. This work was funded by Mexico's Consejo Nacional de Ciencia y Tecnología through grant 34299-T. The contour plots and maps in this study were made using the Generic Mapping Tools (GMT) package (Wessel and Smith, 1998).
Bibliography
Abt D.L., Fischer K.M., Abers G.A., Strauch W., Protti J.M., González V., 2009, Shear wave anisotropy beneath Nicaragua and Costa Rica: Implications for flow in the mantle wedge, Geochem. Geophys. Geosyst., 10, Q05S15, doi:10.1029/2009GC002375. [ Links ]
Abt D.L., Fischer K.M., Abers G.A., Protti M., González V., Strauch W., 2010, Constraints on upper mantle anisotropy surrounding the Cocos slab from SK(K)S splitting, J. Geophys. Res., 115, B06316, doi:10.1029/2009JB006710. [ Links ]
Bernal-Díaz A., Valenzuela-Wong R., Pérez-Campos X., Iglesias A., Clayton R.W., 2008, Anisotropía de la onda SKS en el manto superior debajo del arreglo VEOX (abstract), Geos Boletín Informativo de la UGM, 28, 2, 199-200. [ Links ]
Currie C.A., Cassidy J.F., Hyndman R.D., Bostock M.G., 2004, Shear wave anisotropy beneath the Cascadia subduction zone and western North American craton, Geophys. J. Int., 157, 341-353. [ Links ]
DeMets C., Gordon R.G., Argus D.F., 2010, Geologically current plate motions, Geophys. J. Int., 181, 1-80. [ Links ]
Dougherty S.L., Clayton R.W., Helmberger D.V., 2012, Seismic structure in central Mexico: Implications for fragmentation of the subducted Cocos plate, J. Geophys. Res., 117, B09316, doi:10.1029/2012JB009528. [ Links ]
Ferrari L., 2004, Slab detachment control on mafic volcanic pulse and mantle heterogeneity in central Mexico, Geology, 32, 77-80, doi:10.1130/G19887.1. [ Links ]
Ferrari L., Petrone C.M., Francalanci L., 2001, Generation of oceanic-island basalt-type volcanism in the western Trans-Mexican volcanic belt by slab rollback, asthenosphere infiltration, and variable flux melting, Geology, 29, 507-510. [ Links ]
Gorbatov A., Fukao Y., 2005, Tomographic search for missing link between the ancient Farallon subduction and the present Cocos subduction, Geophys. J. Int., 160, 849-854. [ Links ]
Gripp A.E., Gordon R.G., 2002, Young tracks of hotspots and current plate velocities, Geophys. J. Int., 150, 321-361. [ Links ]
Heuret A., Lallemand S., 2005, Plate motions, slab dynamics and back-arc deformation, Phys. Earth Planet. Int., 149, 31-51, doi:10.1016/j.pepi.2004.08.022. [ Links ]
Husker A., Davis P.M., 2009, Tomography and thermal state of the Cocos plate subduction beneath Mexico City, J. Geophys. Res., 114, B04306, doi:10.1029/2008JB006039. [ Links ]
Jung H., Katayama I., Jiang Z., Hiraga T., Karato S., 2006, Effect of water and stress on the lattice-preferred orientation of olivine, Tectonophysics, 421, 1-22. [ Links ]
Kanjorski M.N., 2003, Cocos plate structure along the Middle America subduction zone off Oaxaca and Guerrero, Mexico: Influence of subducting plate morphology on tectonics and seismicity, Ph. D. thesis, University of California, San Diego, USA. [ Links ]
Kim Y., Clayton R.W., Keppie F., 2011, Evidence of a collision between the Yucatán block and Mexico in the Miocene, Geophys. J. Int., 187, 989-1000, doi: 10.1111/j.1365246X.2011.05191.x. [ Links ]
León-Soto G., González-López A., Valenzuela-Wong R., Pérez-Campos X., Iglesias A., Clayton R.W., 2011, Anisotropía sísmica de ondas S locales en el Istmo de Tehuantepec (abstract), Geos Boletín Informativo de la UGM, 31, 1, 117. [ Links ]
Long M.D., 2010, Frequency-dependent shear wave splitting and heterogeneous anisotropic structure beneath the Gulf of California region, Phys. Earth Planet. Int., 182, 59-72, doi:10.1016/j.pepi.2010.06.005. [ Links ]
Long M. D., Silver P. G., 2008, The subduction zone flow field from seismic anisotropy: A global view, Science, 319, 315-318. [ Links ]
Long M.D., Silver P.G., 2009, Mantle flow in subduction systems: The subslab flow field and implications for mantle dynamics, J. Geophys. Res., 114, B10312, doi:10.1029/2008JB006200. [ Links ]
Manea M., Manea V. C., Ferrari L., Kostoglodov V., Bandy W. L., 2005, Tectonic evolution of the Tehuantepec ridge, Earth Planet. Sci. Lett., 238, 64-77. [ Links ]
Melgar D., Pérez-Campos X., 2011, Imaging the Moho and subducted oceanic crust at the Isthmus of Tehuantepec, Mexico, from receiver functions, Pure Appl. Geophys., 168, 1449-1460, doi:10.1007/s00024-010-0199-5. [ Links ]
Neumann F., Contreras-Pérez J., Tolson-Jones G., Vásquez-Serrano A., 2012, An analog model of the Middle American subduction zone and the mantle flow beneath the Jalisco and Michoacán blocks (abstract), Geos Boletín Informativo de la UGM, 32, 1, 252. [ Links ]
Nieto-Samaniego A.F., Alaniz-Alvarez S.A., Camprubí-í-Cano A., 2005, La Mesa Central de México: Estratigrafía, estructura y evolución tectónica cenozoica, Bol. Soc. Geol. Mex., LVII, 285-318. [ Links ]
Obrebski M., Castro R.R., 2008, Seismic anisotropy in northern and central Gulf of California region, Mexico, from teleseismic receiver functions and new evidence of possible plate capture, J. Geophys. Res., 113, B03301, doi:10.1029/2007JB005156. [ Links ]
Obrebski M., Castro R.R., Valenzuela R.W., van Benthem S., Rebollar C.J., 2006, Shear-wave splitting observations at the regions of northern Baja California and southern Basin and Range in Mexico, Geophys. Res. Lett., 33, L05302, doi:10.1029/2005GL024720. [ Links ]
Pardo M., Suárez G., 1995, Shape of the subducted Rivera and Cocos plates in southern Mexico: Seismic and tectonic implications, J. Geophys. Res., 100, 12,357-12,373. [ Links ]
Park J., Levin V., 2002, Seismic anisotropy: Tracing plate dynamics in the mantle, Science, 296, 485-489. [ Links ]
Pérez-Campos X., Kim Y., Husker A., Davis P.M., Clayton R.W., Iglesias A., Pacheco J.F., Singh S.K., Manea V.C., Gurnis M., 2008, Horizontal subduction and truncation of the Cocos plate beneath central Mexico, Geophys. Res. Lett., 35, L18303, doi:10.1029/2008GL035127. [ Links ]
Pérez-Campos X., Clayton R.W., Brudzinski M.R., Cabral E., Arciniega A., 2012, Slab geometry under Oaxaca and its relationship with the eastern Trans-Mexican Volcanic Belt (abstract), Geos Boletín Informativo de la UGM, 32, 1, 254. [ Links ]
Phipps Morgan J., Hasenclever J., Hort M., Rüpke L., Parmentier E.M., 2007, On subducting slab entrainment of buoyant asthenosphere, Terra Nova, 19, 167-173, doi:10.1111/j.1365-3121.2007.00737.x. [ Links ]
Rodríguez-Pérez Q., 2007, Estructura tridimensional de velocidades para el sureste de México, mediante el análisis de trazado de rayos sísmicos de sismos regionales, M. Sc. thesis, 83 pp., Instituto de Geofísica, Universidad Nacional Autónoma de México, Mexico City, Mexico. [ Links ]
Rojo-Garibaldi B., 2012, Anisotropía de las ondas SKS en el manto superior debajo de un arreglo sísmico entre Guerrero y Veracruz, B. Sc. thesis, 84 pp., Facultad de Ciencias, Universidad Nacional Autónoma de México, Mexico City, Mexico. [ Links ]
Savage M.K., 1999, Seismic anisotropy and mantle deformation: What have we learned from shear wave splitting?, Rev. Geophys., 37, 65-106. [ Links ]
Sedlock R.L., Ortega-Gutiérrez F., Speed R.C., 1993, Tectonostratigraphic terranes and tectonic evolution of Mexico, Special Paper 278, 146 pp., Geological Society of America, Boulder, Colorado, USA. [ Links ]
Silver P.G., 1996, Seismic anisotropy beneath the continents: Probing the depths of Geology, Annu. Rev. Earth Planet. Sci., 24, 385-432. [ Links ]
Silver P.G., Chan W.W., 1991, Shear wave splitting and subcontinental mantle deformation, J. Geophys. Res., 96, 16,429-16,454. [ Links ]
Singh S.K., Pacheco J., Courboulex F., Novelo D.A., 1997, Source parameters of the Pinotepa Nacional, Mexico, earthquake of 27 March, 1996 (Mw = 5.4) estimated from near-field recordings of a single station, J. Seismol., 1, 39-45. [ Links ]
Song T.-R. A., Kim Y., 2012a, Anisotropic uppermost mantle in young subducted slab underplating central Mexico, Nat. Geosci., 5, 55-59, doi:10.1038/ngeo1342. [ Links ]
Song T.-R. A., Kim Y., 2012b, Localized seismic anisotropy associated with long-term slow-slip events beneath southern Mexico, Geophys. Res. Lett., 39, L09308, doi:10.1029/2012GL051324. [ Links ]
Soto G.L., Ni J.F., Grand S.P., Sandvol E., Valenzuela R.W., Guzmán Speziale M., Gómez González J.M., Domínguez Reyes T., 2009, Mantle flow in the Rivera-Cocos subduction zone, Geophys. J. Int., 179, 1004-1012, doi: 10.1111/j.1365-246X.2009.04352.x. [ Links ]
Stubailo I., Davis P., 2007, Shear wave splitting measurements and interpretation beneath Acapulco-Tampico transect in Mexico, Eos Trans. AGU, 88, 52, Fall Meet. Suppl., Abstract T51B-0539. [ Links ]
Stubailo I., Davis P.M., 2012a, Anisotropy of the Mexico subduction zone based on shear-wave splitting analysis (abstract), Seism. Res. Lett., 83, 2, 379. [ Links ]
Stubailo I., Davis P.M., 2012b, Anisotropy of the Mexico subduction zone based on shear-wave splitting and higher modes analysis, Abstract T11A-2538 presented at 2012 Fall Meeting, AGU, San Francisco, CA, 3-7 Dec. [ Links ]
Stubailo I., Beghein C., Davis P.M., 2012, Structure and anisotropy of the Mexico subduction zone based on Rayleigh-wave analysis and implications for the geometry of the Trans-Mexican Volcanic Belt, J. Geophys. Res., 117, B05303, doi:10.1029/2011JB008631. [ Links ]
van Benthem S.A.C., Valenzuela R.W., Obrebski M., Castro R.R., 2008, Measurements of upper mantle shear wave anisotropy from stations around the southern Gulf of California, Geofís. Int., 47, 127-143. [ Links ]
van der Lee S., Nolet G., 1997a, Seismic image of the subducted trailing fragments of the Farallon plate, Nature, 386, 266-269. [ Links ]
van der Lee S., Nolet G., 1997b, Upper mantle S velocity structure of North America, J. Geophys. Res., 102, 22,815-22,838. [ Links ]
Wessel P., Smith W.H.F., 1998, New, improved version of Generic Mapping Tools released, Eos Trans. AGU, 79, 579. [ Links ]
Wolfe C.J., Silver P.G., 1998, Seismic anisotropy of oceanic upper mantle: Shear wave splitting methodologies and observations, J. Geophys. Res., 103, 749-771. [ Links ]
Yang T., Grand S.P., Wilson D., Guzmán-Speziale M., Gómez-González J.M., Domínguez-Reyes T., Ni J., 2009, Seismic structure beneath the Rivera subduction zone from finite-frequency seismic tomography, J. Geophys. Res., 114, B01302, doi:10.1029/2008JB005830. [ Links ]

