


Servicios Personalizados
Revista
Articulo
 Inglés (pdf)
 Artículo en XML
 Referencias del artículo
 Enviar artículo por email
Indicadores
-
 Citado por SciELO
 -
 Accesos
Links relacionados
-
 Similares en
SciELO
Similares en
SciELO
Compartir

 Permalink
Geofísica internacional
versión On-line ISSN 2954-436Xversión impresa ISSN 0016-7169
Geofís. Intl vol.52 no.3 Ciudad de México jul./sep. 2013
Original paper
Variability of extreme precipitation in coastal river basins of the southern mexican Pacific region
Nancy Pérez-Morga,1* Thomas Kretzschmar,1 Tereza Cavazos,2 Stephen V. Smith3 and Francisco Munoz-Arriola4
1 Department of Geology, Centro de Investigación Científica y de Educación Superior de Ensenada (CICESE), Carretera Ensenada-Tijuana Núm. 3918 Zona Playitas Ensenada, Baja California, 22860, México. *Corresponding author: pmorga@cicese.edu.mx; tkretzsc@cicese.mx
2 Department of Physical Oceanography, CICESE, Ensenada, B. C., Mexico. tcavazos@cicese.mx
3 349 Las Flores Drive, Chula Vista, CA 91910 USA. svsmit@cicese.mx
4 Department of Biological Systems Engineering. University of Nebraska-Lincoln. 246 L. W. Chase Hall. Lincoln, NE 68583-0726. fmunoza@unl.edu
Received: September 20, 2012
Accepted: February 05, 2013
Published on line: June 28, 2013
Resumen
Se realizó un estudio sobre eventos extremos de sequía y humedad (± 1 desviación estándar), así como eventos de precipitación diaria mayores al percentil 95 (P95), asociados a tormentas tropicales y otros eventos, en tres cuencas hidrológicas costeras del sur de Oaxaca (Río Verde, Río Tehuantepec y la costa del sur de Oaxaca). El estudio está basado en registros de precipitación diaria de 47 estaciones bajo control de calidad durante el periodo de 1961-1990, con datos de tormentas tropicales para el Pacífico Oriental Tropical. El objetivo de este estudio fue evaluar eventos extremos (húmedos y secos), las tendencias de la contribución anual de la precipitación derivada del P95 y la relación de la precipitación de verano con El Niño-Oscilación del Sur y la Oscilación Decadal del Pacífico. Se realizó una regionalización basada en un análisis de componentes principales lo cual dió por resultado cuatro regiones de precipitación. Una correlación negativa significativa (al 95 % de confianza) fue encontrada sólo con el índice ONI en la región 3, la más cercana al Golfo de Tehuantepec. Los años húmedos ligados a eventos del P95 asociados con tormentas tropicales, fueron relacionados con anomalías negativas (≥–0.6°C) similares a condiciones de La Niña débil y neutrales. Mientras que los años secos fueron relacionados con anomalías positivas similares a condiciones neutrales (≤–0.5°C) . La mayor contribución de precipitación del P95, asociada con tormentas tropicales, fue observada en la región 3. Sólo se encontró una tendencia positiva de esta contribución en la región 1: el bajo Río Verde.
Palabras clave: eventos de lluvia extrema, MSD, años secos, ciclones tropicales, ENSO, PDO.
Abstract
Extreme wet and dry years (± 1 standard deviation, respectively), as well as the top 95 percentile (P95) of daily precipitation events, derived from tropical cyclone (TC) and non-tropical cyclone (NTC) rainfall, were analyzed in coastal river basins in Southern Oaxaca, Mexico (Río Verde, Río Tehuantepec, and the Southern Coast). The study is based on daily precipitation records from 47 quality-controlled stations for the 1961 to 1990 period and TC data for the Eastern Tropical Pacific (EPAC). The aim of this study was to evaluate extreme (dry and wet) trends in the annual contribution of daily P95 precipitation events and to determine the relationship of summer precipitation with El Niño Southern Oscillation (ENSO) and the Pacifical Decadal Oscillation (PDO). A regionalization based on a rotated principal component analysis (PCA) was used to produce four precipitation regions in the coastal river basins. A significant negative correlation (significance at the 95% level) was only found with ONI in rainfall Region 3, nearest to the Gulf of Tehuantepec. Wet years, mainly linked to TC-derived P95 precipitation events, were associated with SST anomalies (≥–0.6°C) similar to weak La Niña and Neutral cool conditions, while dry years were associated with SST positive anomalies similar to Neutral warm conditions (≤–0.5°C). The largest contribution of extreme P95 precipitation derived from TCs to the annual precipitation was observed in Region 3. A significant upward trend in the contribution of TC-derived precipitation to the annual precipitation was found only in Region 1, low Río Verde.
Key words: extreme rainfall events, MSD, dry years, tropical cyclones, ENSO, PDO.
Introduction
Precipitation variability in the southern Mexican state of Oaxaca (Figure 1) has played a decisive role in the agriculture sector with social (Endfield et al., 2004) and economic (Dilley, 1997; Endfield et al., 2004) impacts, mainly during extreme events such as those associated with El Niño conditions or with the passage of tropical cyclones (TCs). Agriculture accounts for about 30% of the economic activity in Oaxaca and takes place mainly in the valleys, in the southern coastal plains, and the northeastern part of the state, with corn being one of the main crops (INEGI, 2012). Most maize in Oaxaca is planted during May and June to coincide with the onset of the rainy season (Dilley, 1997). Stress has been observed in maize growth (Dilley, 1997) coincident with the mid-summer drought (a relative minimum of precipitation between July and August known as "Canicula"; Mosiño and García, 1966; Magaña et al., 1999; Curtis, 2004; Magaña and Caetano, 2005). For the 1978 to 1990 period the total August precipitation in the Oaxaca Valley predicted the yields on rain-fed maize (Dilley, 1997). During the August precipitation variability during this period was sensitive to interannual variations of the Southern Oscillation Index (SOI) and a synoptic index of summer 850 hPa-level temperatures (Dilley, 1997).
Precipitation in the early part of the rainy season (May–June) results from the northwards movement of the Inter-Tropical Convergence Zone (ITCZ) and easterly winds that bring moisture from the Gulf of Mexico; the latter part of the rainy season (July–September) is governed by the Mexican monsoon and increased TC frequency in the Gulf of Mexico and the Pacific, which are strongest during August (Dilley, 1997). This particular contribution for TCs over the annual precipitation has not been studied for the coast of Oaxaca. Between 1993 and 2007, one third of the major hurricanes in the Eastern Tropical Pacific (EPAC) had tracks that remained close to the Mexican west coast, with the highest peak intensity near Southern Mexico (Sánchez et al., 2009). The ecological (Villegas-Romero et al., 2009, Villegas-Romero et al., 2004), social and economic impacts of TCs on the coast of Oaxaca are well documented by Bitrán (2002). Hurricane Pauline (in 1997) alone caused economic losses of around 450 million USD in Acapulco, in the neighbor state of Guerrero (Bitrán, 2002). Several parts of the basins in the southern coast of Oaxaca, such as Barra Coyula, Río Colotepec and Río Grande basins were also affected by this extreme event (CONABIO, 2012a).
A study regarding global trends shows an increase in daily extreme precipitation in Southern Mexico over the past half century; one of the main problems in analyzing extreme climate events is the lack of high-quality, long-term climate data with adequate time resolution (Easterling et al., 2000). Most studies of extremes have focused on Northwestern and Central Mexico (e.g., Magaña et al., 2003; Cavazos et al., 2008; Arriaga-Ramírez and Cavazos, 2010; Méndez and Magaña, 2010), while only a few studies have analyzed extreme events in Southern Mexico (Dilley, 1996; Peralta-Hernández, 2009). Peralta et al. (2009) in a regional study of Southern Mexico analyzed 23 extreme rainfall indices; they found an increase in extreme daily precipitation events over the 1960-2004 period, with a step-like jump in the early 1970's. The variability of extreme events was significantly related to ENSO (El Niño Southern Oscillation) and the PDO (Pacific Decadal Oscillation), with most daily heavy rainfall events occurring during La Niña and the positive phase of the PDO (Peralta et al., 2009). In contrast, according to Pavía et al. (2006) El Niño events favor seasonal wet conditions in Southern Mexico, but during summers of a cold phase of the PDO.
Another study of the Oaxaca Valley associated droughts and reduced corn production to El Niño conditions (Dilley, 1997). ENSO warm events were associated with dry conditions in the valley owing to a southward displacement of the ITCZ during the low phase of the Southern Oscillation and diminished storm frequency in the Gulf of Mexico (Dilley, 1996). In other parts of the west coast of Mexico, this association of El Niño with dry conditions has also been found to occur during the warm phase of PDO in the Gulf of California continental watershed (Brito-Castillo et al., 2003). On the other hand, a reduced number of TCs making landfall during El Niño years was also observed during 1961-1990 (Jauregui, 1995). According to these previous studies, a wet or dry summer depends on the phase of PDO and the ENSO condition. The current study focuses more on the positive and negative PDO phases and regions from the coast, to the Oaxaca Valley, and through the mountains of Oaxaca State. Study of the climate variability in this region is important due to its localization just in the north limit of the ITCZ, south of the North American monsoon and near the warm pool in the Gulf of Tehuantepec. In the case of extreme daily precipitation associated with TCs there are no studies in Oaxaca, while these events have been associated with weak La Niña to Neutral conditions in the monsoon region (Cavazos et al., 2008).
The present study aims to understand the variability of extreme annual, seasonal and daily precipitation events in Southern Oaxaca (shown in Fig. 1), and their relationship to interannual and interdecadal phenomena such as ENSO and PDO. The study area reaches from the inland valley to the coastal areas, focusing on a regional scale that has not been addressed previously, and considering the summer precipitation when the TC season is predominant. This paper is organized into six sections (the first of which is the Introduction). Section 2 describes the region, section 3 the dataset used, and Section 4, the methods used to obtain regional extreme events (dry and wet years, and TC and Non-TC derived P95 daily rainfall events) and trends in the frequency of the extremes. The results of the regional extreme events at annual and seasonal timescales are presented in Section 5, and the discussion of the relationships with ENSO and PDO is presented in Section 6. The main conclusions of the study are presented in Section 7.
Study Region
The study area is located in the Southern Mexican Pacific region (Fig. 1), including the coastal hydrological basins of the state of Oaxaca: (1) Río Verde, (2) Río Tehuantepec, and (3) the Southern Coast region; this coastal region includes several smaller sub-basins (Río Colotepec, Río Copalita, Río Astata and others). The domain extends from the Pacific coast to the mountains, and covers an area of approximately 39,000 km2. These basins are located between 15° 39' and 17° 35' N latitude and 95° 7' and 97° 55' W longitude (see Fig. 1) and are bounded to the north by the High Mixteca, by the Eastern Mountains to the northeastern, by Guerrero state to the West and by the Pacific Ocean to the South. The study area is bounded by the Gulf of Mexico and the Pacific Ocean, and near to the Gulf of Tehuantepec. The predominant climate is sub-humid and warm on the coast, and semiarid in the valley. The region's population totals to around 2,500,000 people. The study area includes several physiographic provinces shown in Fig. 1: the South coastal plains located up to 300 m above sea-level, the Sierra Madre del Sur (up to 2000 m elevation), the Oaxaca Valley (up to 1500 m), the Sierra Madre de Oaxaca (up to 2500 m), and the Isthmus plain (up to 400 m). The predominant vegetation consists of rain-fed and irrigated agriculture, oak, low deciduous trees, pine-oak, mountain mesophyll, and semi-evergreen seasonal forests.
The main economical activities in the state of Oaxaca are: commerce and services (47%), industrial and construction (41%), and agriculture (32%). Besides their use for water supply to agriculture and urban activities, some of the hydrological basins studied are also important carbon reservoirs and others function as coastal protection zones during extreme events such as hurricanes (CONABIO, 2012 a). CONABIO (National Commission for Knowledge and Use of the Biodiversity) has classified some of the basins of the study as "priority for Mexico" based on environmental services (hydrological and maritime priority zones) and biodiversity (inland priority zones) (CONABIO, 2012 b).
Data
Daily-observed precipitation data were analyzed from 1950 to 2008 for a network of 184 stations across the study area (Fig. 2). The data were obtained from the Mexican Climatological Station Network Data (CLICOM) database of the Servicio Meteorológico Nacional (SMN) of the Mexican National Water Commission. A quality control protocol was adopted to identify errors and gaps; stations with less than 75% of complete and correct data were discarded. A threshold of 4 standard deviations above the climatological mean was used to indentify daily outliers. Histogram analyses, using R-Climdex, an R statistical package of public domain (http://cccma.seos.uvic.ca/ETCCDMI/software.shtml), the median, a comparison with neighboring stations, and the type of related events, such as the passage of TCs, were used to determine the validity of the outliers, which were only rejected after manual inspection. Seventy per cent of the original 184 stations (i.e., 129) were accepted after the quality control.
A main parameter to accept or to discard a station was the continuity of the data series. The best period of the daily observations was 1961-1983; by early 1984 the continuity in the series quickly deteriorated; between 1983 and 1990, only 33% of the stations had complete data. The daily precipitation series showed continuing disruptions from 1990 to 2000.
Initially, the best 61 stations that covered thirty 33% of the original stations available in the study area were used for a Principal Components Analysis (PCA) of monthly precipitation of the 1961-1983 period to produce precipitation regions in the coastal river basins studied. A second analysis was carried out using only 47 stations (quality control with 70% of complete data series) to increase the time period of the analysis to 1961-1990 (Fig. 2). No significant differences in the regional distribution of the two data sets analyzed were found; therefore, the present article is based on the longer (1961-1990) period.
The variability of the extreme events was studied in each region derived from the PCA; first annual and seasonal anomalies of precipitation (for dry and wet years) were studied and after that daily P95 rainfall events derived from TCs and Non-TCs (NTC) in the eastern Tropical Pacific were analyzed.
The classification of extreme daily rainfall events into TC-derived and non NTC extremes was done using a historical database of TC tracks of the EPAC from the Unysis data set (http://weather.unisys.com/hurricane/e_pacific/index.html).
The relationship between extreme events of precipitation and ENSO and PDO were analyzed through a correlation analysis with the PDO and the Oceanic El Niño Index (ONI), which is defined as 3-month running mean of ERSST.v3b SST anomalies in El Niño 3.4 region (5oN-5oS, 120o-170oW). An annual average of these values (based on 3-month running means) and a July-August-September (JAS) running mean were used for this analysis. This was obtained from the Climate Prediction Center (http://www.cpc.noaa.gov/products/analysis_monitoring/ensostuff/ensoyears.shtml). The PDO index (Mantua et al., 1997) was obtained from http://www.atmos.washington.edu/~mantua/TABLES2.html.
Sea surface temperatures (SST) and their anomalies (SSTan) were used to show the conditions in wet and dry years. NOAA extended reconstructed SST v3 data was used and provided by the NOAA/OAR/ESRL PSD, Boulder, Colorado, USA, from their website at http://www.esrl.noaa.gov/psd/.
Methods
Principal analysis components (PCA)
A regionalization based on a rotated principal component analysis (PCA) was used to produce precipitation regions in Southern Oaxaca river basins. This regionalization was used to evaluate wet and dry years in the rainy period over May to October averages, and the P95 of daily precipitation rainfall events associated with TCs and Non-TCs.
An S-mode PCA was applied to monthly precipitation of the study area during the 1961-1983 period using 61 stations, and during the 1961-1990 period using only the 47 best stations after the quality control analysis. Gaps in the data were replaced with mean monthly climatological values before the analyses. The PCA was applied using a correlation matrix instead of a covariance matrix according to Comrie and Glenn (1998) for precipitation regionalizations. The selection of the number of principal components (PCs) to retain was based on a scree test (Cattel, 1966); four PCs were retained in both analyses, and the regionalization results were similar.
Orthogonal (varimax) and oblique (oblimin) rotations were tested; the oblimin rotation (with δ=0) produced more consistent results, as in other precipitation regionalizations (White et al. 1991; Comrie and Glenn 1998; Englehart and Douglas 2002; Guirguis and Avissar 2008; Arriaga-Ramírez and Cavazos, 2010). Four PCs were retained after rotation; these explained 97% of the total precipitation variance. The four regions were delineated using the contour γ= 0.4; 39 out of 47 stations met this criterion (Figure 2).
Extreme precipitation events
The precipitation regions derived from the PCA were used to analyze the variability of extreme precipitation events. First, regional wet and dry extreme events were analyzed at annual and seasonal scales, then extreme daily precipitation events derived from TC and Non-TC of eastern Pacific Tropical were also studied.
Extreme wet (dry) years were classified using standardized (Z) precipitation anomalies more than ± 1 standard deviation from Z; where the Z anomaly is defined as the annual mean precipitation of the stations in every region, minus the climatological mean for the 1961-1990 period divided by their standard deviation. Annual and seasonal anomalies were produced; as well as seasonal on the rainy season (May to October, winter (DJF), during the MSD period (JA) and at the start of the ITCZ (June) near the region.
An extreme daily precipitation event was defined when daily precipitation exceeded the 95th percentile (P95) value. Percentiles are obtained considering only wet days (precipitation >1mm). Extreme events were evaluated in individual stations and separated into summer events (June to October) and winter-spring events (November to May). The 5/7 month breakdown was used to evaluate the extreme events on the rainy season including the season of hurricanes, and to evaluate extreme events which were relationship with other processes (winter-spring events). This study exhibit only summer events. An extreme precipitation day derived from TCs was considered when a storm center was located within 5° (latitude) of the stations analyzed, as described in other studies (e.g., Cavazos et al., 2008).
The seasonal contribution from the P95 events was defined as the sum of all extreme event days from June to October divided by the annual precipitation. The seasonal contribution of TCs was calculated for each of the stations in each region derived from the PCA, and an annual average among the stations in each region was also calculated.
Linear trends in the annual contribution of the P95 rainfall events were evaluated with a non-parametric Mann-Kendall Test (Mann, 1945; Kendall, 1955) by normal approximation; an adjustment was made for tied observations. The statistical significance level used for the trend analysis was 95% (i.e., p<0.05). The slope of the trend was determined using Sen's slope estimator (Sen, 1968).
The Mid-Summer Drought (MSD).
As a manner to evaluate the MSD, a regional difference between June (the first summer maximum) and July (the first summer minimum) was calculated. Values above the regional mean of the 1961-1990 period were associated with a strong start of the MSD and values less than zero (negative differences) were years with a missing MSD.
Relationship between extreme events and ENSO and PDO.
The relationships between regional extreme events through precipitation anomalies at annual and seasonal scales, and through ENSO and PDO periods were analyzed by correlation analysis using the 95% level of statistical significance.
P95 daily extreme events associated with TCs and Non-TCs were evaluated over 1961-1990 period, identifying years with the largest frequency of events (>1 standard deviation) and their relationship with ENSO conditions.
Results
Regional precipitation
The study area precipitation presents similar annual (Fig. 2) and summer (not shown) precipitation patterns, as expected in a region where the rainy season is mainly during the summer (May – Oct). These months represent and average of 91% of the annual precipitation throughout all stations. The highest precipitation is observed in the western part of the Río Verde Basin. Two areas of maximum precipitation are apparent, one over the NW of the Rio Verde basin (reaching 2000 mm/yr), and another in the middle of the coastal basins (1600 mm/yr). The lowest precipitation is seen in the Río Tehuantepec Basin and in the Oaxaca Valley a (600 mm/yr) (Fig. 1 and Fig. 2). The mean annual precipitation for the 47 stations (Fig. 3) was 909 mm/yr. The precipitation time series (Fig. 3) show a relative dry period in 1961 and 1962, followed by a period with precipitation around the mean (with peaks in 1969, 1973 and 1981, El Niño and Neutral conditions). Finally, from 1982 to 1990 a relative dry period is observed. The time series does not contain a significant trend; however, the number of years with values over the annual mean increases during the cold phase of the PDO (Fig. 3).
PC-based precipitation regions
The four regions derived from the PCA (Fig. 4) show the monthly climatology for distinct regional precipitation patterns (Fig. 5). The percentage of variance explained by each PC region is as follows: PC1: 32.7, PC2: 29.8, PC3: 25.6, and PC4: 9.3. Rio Verde basin presented three different patterns. PC1 coincides with the maximum annual precipitation (Fig. 2) and highest altitude (Fig. 1) including the Sierra Mixteca Alta and the South Coast Range; PC2, in the NE border of the Rio Verde basin, covers the Sierras Orientales; and PC4 covers the sierras and the Oaxaca Valley. This last region does not follow the orography-precipitation pattern described above, and topography goes from 500 to 3000 m. Unfortunately, in PC4, the available weather stations are located only in the valley, so there is little or no data from the sierra area. Thus the valley, partly located in the orographic shadow of the mountains, presents the lowest precipitation of the four regions. The Tehuantepec basin covers the plains of the isthmus and belongs only to PC3. The South Coast sub-basins are characterized by two different patterns, PC1 and PC3.
The four regions are characterized by maximum precipitation in the summer (May-Oct) and considerably less rainfall during the rest of the year (Fig. 4 and Fig. 5). The main differences between the four regions are the summer precipitation regime distribution and the mean annual precipitation during the 1961-1990 period (Table 1). Low Río Verde (PC1) and the Isthmus of Tehuantepec (PC3), experience an early summer start in May due to the establishment and northward movement of the ITCZ over the EPAC (García et al., 1990, Cortéz-Vázquez, 1999; Valdés et al., 2005, Amador et al., 2006), and continues until July and August.
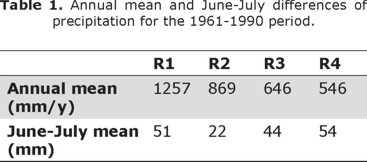
A precipitation regime with a bimodal rainfall distribution is observed (Fig. 5a and 5c), with peaks in June and September and a minimum in July-August. After the "Canicula" (MSD) the precipitation increases in part due to the influence of TCs, which reach the maximum in September. The differences in the annual mean for each region are due to topography and location (Fig. 4). PC1 covers the coastal plains and areas with altitude around 2200 meters, and PC3 covers the coastal plains only (Fig. 4).
PC2 is in the NE limit of the Rio Verde basin and goes into the Sierras Orientales. This region is influenced by the easterly trades from the Gulf of Mexico and TCs in the summer and fall (García et al., 1990); the minimum in July is delayed until August with moisture enrichment from the Gulf of Mexico, and in September, a precipitation maximum is observed due to the hurricane period (Fig. 5 b).
PC4 has the lowest variance of the four regions. The annual mean rainfall is only 45 % of that observed in region 1. The maximum rainfall occurs in June, while in July the precipitation decreases and remains low during the next months, with a near-constant precipitation in the months of July, August and September and lacking the second peak of maximum precipitation observed in the other regions (Fig. 5 d). This trend could be due to the presence of the Southern range, acting as a barrier for the middle section of the Río Verde basin and presenting an intermountain rainfall pattern with a flat precipitation with a lesser influence of TCs.
Regional precipitation variability and its relationship to ENSO and PDO
The regional precipitation variability was evaluated through Z mean anomalies, but only the May to October mean is shown in Fig. 6. In the annual and the summer season, two major positive anomalies were observed: in 1969 (El Niño year under a PDO negative phase) and in 1981 (Neutral condition and PDO positive phase). Comparing the 4 PC regions only the PC3 region shows a high value in 1969 and PC1 in 1981. Both are strongly influenced by the ITCZ and their proximity to the Pacific Ocean. In other years, positive anomalies (> 1 standard deviation) were also observed: 1973, 1974, and 1979 in a particular region; but 1969 and 1981 were the years observed in the four regions. Dry periods were observed, from 1961 to 1965 (except 1963), from 1976 to 1977 and from 1982 to 1990 (except 1984).
Considering the June Z mean anomaly, the first peak in 1969 is only observed in the PC3 region, the Tehuantepec and South coast; but the one in 1981, a wet year, starts in June and is observed in all regions with highest relative values in PC2 and PC4, regions closest to the Gulf of Mexico. From July to August, the Z mean anomalies during the MSD period, 1969 wet year is observed in all regions, but precipitation in 1981 begins to decrease in all regions. Both anomalies disappear during September-October.
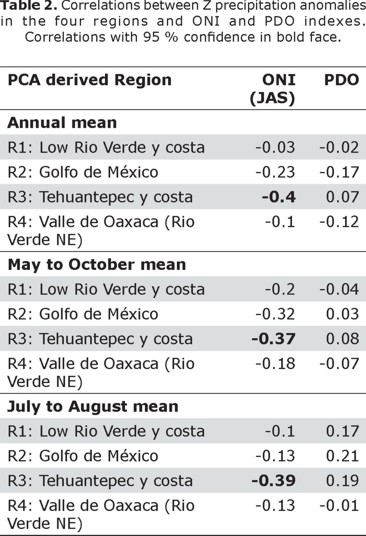
The results of the correlation between the Z mean anomalies in different periods with ONI and the PDO are shown in Table 2. No significant correlation was found between precipitation anomalies and PDO and SST anomalies (values not shown). The ONI index was significantly correlated (negative) only with precipitation anomalies in region 3 (Table 2).
The MSD
An interannual variation of the MSD start was observed in all regions, but no relation between the start of MSD and a particular ENSO condition was found (Fig. 7). There were strong MSD starts during La Niña and El Niño conditions. A lesser number of years without a MSD influence were observed (Fig. 7).
Extreme Events associated with TCs and Non-TCs.
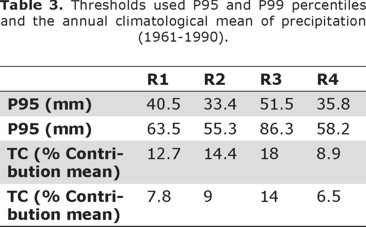
The annual contribution of the extreme rainfall events, derived from the passage of TCs and Non-TCs in summer (June to October) is presented in Fig. 8 for the four regions; in some years the contribution of these events is zero. The total mean contribution of all extreme events to the annual precipitation in the four regions was low, only 23%, where 14% corresponds to extreme events related to TCs of the EPAC and 9% to Non-TCs. Thus the majority of the annual rainfall comes from less intense events. The thresholds to identify extreme events (P95 and P99) and the mean contribution of TCs and non-TCs per region are shown in Table 3. In both cases Region 3 (Isthmus of Tehuantepec and part of the South coast) is the region with the largest contribution of TC-derived and Non-TC-derived rainfall to the annual precipitation. For TCs a significant (at the 95 percent level) upward trend was found in region 1 (Fig 8a) and a significant downward trend in PC4, Oaxaca Valley (Fig, 8d). For Non-TC-derived rainfall, a significant downward trend was found in PC2 and in PC4. Frequent events of TCs and Non-TCs during the 1961 to 1990 period were evaluated and the years with values over the mean plus 1 standard deviation for TCs were: 1967, 1969, 1973, 1974, 1981 and 1983, mainly during La Niña and neutral conditions and for Non-TCs: 1969, 1973 and 1981. These years coincide with the wet years previously analyzed in section 4.3 (except 1967 and 1983 for TCs), and in a similar way, the possible relationship between SSTan and these rainfall P95-derived extremes from TCs and Non-TCs will be explored in next section.
SSTan associated with extreme precipitation events
SSTan behavior during extreme wet and dry years is described in Fig. 9. SSTan characteristics during wet years (1969, 1973 and 1981, Fig. 6 d) were compared with those during dry years (1961, 1976 and 1982, Fig. 6 d). Negative anomalies (-0.6oC) in the EPAC near the Equator during wet years are associated to weak La Niña/Neutral negative conditions, while positive anomalies (0.5oC) in the eastern Equatorial Pacific are observed during dry years associated to very weak El Niño to Neutral positive conditions.
Discussion
The rainfall regionalization (Fig. 4 and Fig. 5) in the study area is influence by orographic factors, but in the PC4 region, an underestimation of the mean precipitation is possible because of the lack of stations in the NW Sierras (Fig. 1 c) and Oaxaca Valley. Arbingast (1975) assigned this particularity in Oaxaca Valley to a decrease in precipitation due to orographic effects, observing a precipitation pattern following the isolines in the study area with low precipitation values in Oaxaca Valley. In central-northeastern Mexico, a rainfall regionalization was found consistent with topography and vegetation changes (Pineda-Martínez et al., 2007). But topography is not the only cause of for the regional patterns. Other processes involved are related to the Pacific Ocean and the Gulf of Mexico. The ITCZ influences the establishment of the rainy season (Fig. 5) from May to July and August, but each region reaches different peaks and shows different precipitation distribution patterns due to TCs and the proximity of the Gulf of Tehuantepec and the Gulf of Mexico (Fig. 4 and Fig. 5). Dilley (1996) mentioned that orography and local convection determined the precipitation pattern in Oaxaca Valley, but this is also governed by synoptic factors of large scale like the easterlies, tropical storms, ENSO and the PDO. Here we find a significant, but low, correlation with ENSO (0.39, Table 2) only PC3 region. Cavazos and Hastenrath (1990), for example, observed that May-October precipitation, averaged over several stations in the state of Oaxaca from 1966 to 1987, correlates with the July-August average of the SO1 at 0.38. This trend is consistent with our results using the ONI index. The regionalization is also consistent with other climatic regionalizations for Mexico (García et al. 1990; Giddings et al. 2005).
Wet conditions in the negative phase of PDO have been observed in southern Mexico for the summer (Méndez et al., 2010), however correlations between PDO and precipitation anomalies in each region was low and not significant, just a positive correlation (0.39) was found in PC1 over the winter period from December to February. Pavía et al. (2006) found that wet conditions during the summer in the coast of Oaxaca are also associated with a negative PDO phase and El Niño events, as the case in 1969. Méndez and Magaña (2010) explained that during the negative phase of the PDO, the Caribbean low-level jet weakens and the easterly wave activity increases, leading to more tropical convection over Mesoamerica. In the case of Oaxaca, more cases of wet years are observed during the negative phase of the PDO but no significant correlation appears. The time period evaluated was another problem, because only 3% of the initial 184 stations evaluated cover a PDO period completely and with an intermittent series of data, the rest of the stations do not cover a complete cycle of the PDO. In region 4, Oaxaca Valley, which has been related to drought conditions during El Niño events (Dilley, 1996), extreme dry years were related with the positive phase of PDO and weak El Niño/Neutral positive conditions, but no significant correlation was found during the complete period of study. Dilley (1996) found this correlation for August from 1978 to 1990 period (after a PDO positive phase change). Figure 9a shows dry years associated to El Niño conditions over the equatorial Pacific. Méndez and Magaña, 2010, associate prolonged drought over central and southern Mexico to the interaction between easterly waves and the trade winds over the intra-Americas seas, in addition to low frequency modulators as Atlantic multidecadal oscillation or PDO. These results suggest that predictability of wet and dry years in the region is difficult, due to the influence of several large-scale teleconnections interacting at different time scales and the lack of long data series.
TCs in the eastern Tropical Pacific and their contribution to extreme events (P95) was larger than that of Non-TCs; other rainfall contribution to annual precipitation was possibly caused by local topography or by TCs in the Gulf of Mexico that in the present work were not evaluated. The years with more events in both cases coincided with negative SST anomalies in the equatorial Pacific (Fig. 9 b).
Dilley, 1996, analyzed storm frequency (from the Gulf of Mexico and the Pacific Ocean) correlations with Oaxaca precipitation and found these were strongest during August and in the areas between 0 and 25°N latitude into the Gulf of Mexico and in the Pacific Ocean. In September the highest correlations were found in the grid-cells on the Mexican coast adjacent to Oaxaca. The author mention that as easterly flow abates during September, easterly waves become less influential and those storms that are proximate to Oaxaca are the ones with the greatest effect on precipitation. These results coincide with region 3, the largest contribution of P95 rainfall-derived from TCs to the annual precipitation.
In general, during El Niño (La Niña) has been reported that precipitation decreases (increases) in the Tehuantepec Isthmus (Magaña et al., 2003) and a reduced number of tropical storms making landfall during El Niño years (1961-1990 period) has also been observed (Jauregui, 1995) coincident with our results. Region 4 was the lowest TC contribution. In 1997, during the passage of hurricane Pauline, the Southern Sierra worked as a natural barrier preventing the phenomenon to enter Mexican territory (CONABIO, 2012 a) farther away from the coastal regions. Nevertheless, still 6% of extreme events associated to TCs were retained in this region (Table 2).
The overall regional average of extreme events associated with TCs were related to La Niña and Neutral conditions, consistent with Peralta-Hernández et al. (2009), who reported that extreme rainfall events occur more frequently during periods of La Niña and during the positive phase of PDO. The only significant positive trend (0.29%/yr) in the contribution of extreme events to the annual precipitation was observed in region 1. This trend is also consistent with the observations of Peralta-Hernández et al. (2009), who found a positive trend in the largest and moderate extreme events in Southern Mexico. The influence of TCs at the lower Río Verde section of the Pastoría coastal lagoon (part of the mouth of region 1) has been analyzed through sediment core studies and has been traced as far back as the Holocene; but an increase in storms driven by more frequent El Niño conditions was found (Goman et al., 2005). A diagram in figure 10 illustrates some of the main findings in this study.
Conclusions
Extreme wet and dry years as well as the top 95 percentile of daily precipitation events derived from tropical cyclone for the Eastern Tropical Pacific and non-tropical cyclone rainfall, were analyzed in coastal river basins in Southern Oaxaca, Mexico, for the 1961 to 1990 period. The aim of this study was to evaluate extreme, trends in the annual contribution of daily P95 precipitation events and to determine the relationship of summer precipitation with El Niño Southern Oscillation and the Pacifical Decadal Oscillation.
Rainfall extremes in Oaxaca coastal basins were associated with tropical cyclones in the eastern Tropical Pacific, with less contribution of non-tropical cyclones; these were associated with weak La Niña and Neutral conditions. Dry events were associated with weak El Niño/Neutral positive conditions. An upward trend, significant for the hurricanes only was determined in region 1, the maximum annual precipitation of the study area; a downward trend was found in region 4, the Oaxaca Valley. The principal contribution of tropical cyclones and non-tropical cyclones was found in region 3, the closest to the Isthmus of Tehuantepec. A bimodal rainfall distribution, the topography and the influence of the Gulf of Mexico and Gulf of Tehuantepec distinguish this region.
Finally, from this study it is evident to investigate further the detailed nature of a few major events and the importance of a continuous monitoring of climate data, particularly in regions with gaps and lack of stations over inaccessible areas of high elevation. The study of the hydrology of the Oaxaca basins analyzed will be the next step to connect their variability with the climate patterns and extreme events studied in the present work.
Acknowledgments
The authors thank CONACYT and CICESE for their financial support to the first author N. Perez-Morga through her PhD. studies.
Bibliography
Arbingast S.A., Gill C.C., Blair C.P., Holz R.K., Buchanan J.R., Marin R., C.A., Ryan, R.H., Bonnie, M.E. and Weiler J.P., 1975, Atlas of Mexico, University of Texas. [ Links ]
Arriaga-Ramírez S., Cavazos T., 2010, Regional trends of daily precipitation indices in northwest Mexico and Southwest United States. J. Geophys. Res., 115, D14111, doi:10.1029/2009JDOI13248. [ Links ]
Amador J.A., Alfaro E.J., Lizano O.G., Magaña V.O., 2006, Atmospheric forcing of the Eastern tropical Pacific: A review. Prog. Oceanogr., 69, 101-142. [ Links ]
Bitrán B.D., 2002, Características del impacto socioeconómico de los principales desastres ocurridos en México, en el periodo de 1980–99. CEPAL 8–25. México, D.F., 2002. [ Links ]
Brito-Castillo L., Douglas A., Leyva-Contreras A., Lluch-Belda D., 2003, The effect of large-scale circulation on precipitation and streamflow in the Gulf of California continental watershed, Int. J. Climatol. 23, 751-768. [ Links ]
Cattel R.B., 1966, The scree test for the number of factors. Multivar. Behav. Res., 1, 245-276. [ Links ]
Cavazos T., Hastenrath S., 1990, Convection and rainfall over Mexico and their modulation by Southern Oscillation. Int. J. Climatol., 10, 377-386. [ Links ]
Cavazos T., Turrent C., Lettenmaier D.P., 2008, Extreme precipitation trends associated with tropical cyclones in the core of the North American monsoon. Geophys. Res. Lett., 35, L21703, doi:10.1029/2008GL035832. [ Links ]
CONABIO, cited 2012 a: Natural Hazards hurricane Pauline case. Mexico: Federal Government. [Available online at http://www.conabio.gob.mx/conocimiento/cambios_veg/doctos/hp_s.html. [ Links ]]
CONABIO, cited 2012 b: Priority Regions. Mexico: Federal Government. [Avalaible on line at http://www.conabio.gob.mx/conocimiento/regionalizacion/doctos/terrestres.html. [ Links ]
Comrie A.C., Glenn E.C., 1998, Principal components-based regionalization of precipitation regimes across the Southwest United States and northern Mexico with an application to monsoon precipitation variability. Clim. Res., 10, 201-215. [ Links ]
Cortéz V.M., 1999, Marcha Anual de la Actividad Convectiva en México. Atmósfera, 12, 101-110. [ Links ]
Curtis S., 2004, Diurnal cycle of rainfall and surface winds and the mid-summer drought of Mexico Central America. Clim. Res., 27, 1-8. [ Links ]
Dilley M., 1996, Synoptic controls on precipitation in the Valley of Oaxaca, Mexico. Int. J. Climatol., 16, 1019-1031. [ Links ]
Dilley M., 1997, Climatic factors affecting annual maize yields in the Valley of Oaxaca, Mexico. Int. J. Climatol., 17, 1549-1557. [ Links ]
Easterling D.R., Evans J.L., P. Ya. Groisman, Karl T.R., Kunkel K.E., Ambenje P., 2000, Observed Variability and trends in extreme climate events: A brief review. Bull. Amer. Meteorol. Soc., 81, 417-425. [ Links ]
Endfield G.H., Fernández-Tejedo I., O'Hara S.L., 2004, Drought and disputes, deluge and dearth: climatic variability and human response in colonial Oaxaca, Mexico. J. Hist. Geogr., 30, 249–276. [ Links ]
Englehart P.J., Douglas A.V., 2002, Mexico's summer rainfall patterns: an analysis of regional models and changes in their teleconnectivity. Atmósfera, 15, 147-164. [ Links ]
García E., Vidal R., Hernández M.E., 1990, Las regiones Climáticas de México. In García de Fuentes, Ana. Editora. Atlas Nacional de México, UNAM, Instituto de Geografía. 2, IV, 10. Map at 1:12,000,000. México, D.F. [ Links ]
Giddings L., Soto M., Rutherford B.M., Maarouf A., 2005, Standardized Precipitation Index Zones for México. Atmósfera, 33-56. [ Links ]
Goman M., Joyce A., Mueller R., 2005, Stratigraphic evidence for anthropogenically induced coastal environmental change from Oaxaca, Mexico. Quaternary Res., 63, 250– 260. [ Links ]
Guirguis K.J., Avissar R., 2008, A precipitation Climatology and Dataset Intercomparison for the Western United States. J. of Hydrometeorology, 9, 825-841. [ Links ]
INEGI cited 2012: CENSO de Población y Vivienda 2010. Mexico: Federal Government. [Avalaible on line at http://www.inegi.org.mx/est/contenidos/proyectos/ccpv/cpv2010/principales2010.aspx] [ Links ]
Jauregui E., 1995, Rainfall fluctuation and tropical storm activity. Erdkunde, 39-47. [ Links ]
Kendall M.G., 1955, Rank correlation methods. Charles Griffin, 196 pp. [ Links ]
Magaña V.O., Amador J.A., Medina S., 1999, The Midsummer Drought over Mexico and Central America. J. Climate, 12, 1577-1588. [ Links ]
Magaña V.O., Vázquez J.L., Pérez J.L., Pérez J.B., 2003, Impact of El Niño on precipitation in Mexico. Geofísica Internacional, 42, 3, 313-330. [ Links ]
Magaña V.O., Caetano E., 2005, Temporal evolution of summer convective activity over the Americas warm pools. Geophys. Res. Lett., 32, L02803, doi:10.1029/2004GL021033. [ Links ]
Mann H.B., 1945, Non-parametric tests against trend. Econometrica, 13, 245–259. [ Links ]
Mantua N.J., Hare S.R., Zhang Y., Wallace J.M., Francis R.C., 1997, A Pacific interdecadal climate oscillation with impacts on salmon production. Bull. Amer. Meteor. Soc., 78, 1069-1079. [ Links ]
Méndez M., Magaña V.O., 2010, Regional Aspects of Prolonged Meteorological Droughts over Mexico and Central America. J. Climate, 23, doi: 10.1175/2009JCLI3080.1. [ Links ]
Méndez G.J., Ramírez A., Cornejo O.E., Zarate L.A., Cavazos T., 2010, Teleconexiones de la Oscilación Decadal del Pacífico (PDO) a la precipitación y temperatura en México. Investigaciones Geográficas, Boletín del Instituto de Geografía, UNAM. ISSN 0188-4611, 73, 57-70. [ Links ]
Mosiño A.P., García E., 1966, Evaluación de la sequía intraestival en la República Mexicana. Conferencia Regional Latinoamericana. Ciudad de México, 9-15 de agosto. [ Links ] Unión Geográfica Internacional, 3, 500-516. [ Links ]
Mosiño A.P., García E., 1974, The climate of Mexico. World Survey of Climatology. Climates of North America. R. A. Bryson and F. K. Hare. Eds., Elsevier. 11, 345-404. [ Links ]
Pavía E.G., Graef F., Reyes J., 2006, Notes and Correspondence PDO-ENSO effects in the Climate of Mexico, J. Climate, 19, 6433-6438. [ Links ]
Peralta-Henández A.R., Balling R.C. Jr., Barba-Martínez L.R., 2009, Comparative analysis of indices of extreme rainfall events: variations and trends from Southern México. Atmósfera, 22, 2, 219-228. [ Links ]
Pineda-Martínez L.F., Carbajal N., Medina-Roldán E., 2007, Regionalization and classification of bioclimatic zones in the central-northeastern region of Mexico using principal component analysis (PCA), Atmósfera, 20, 2, 133-145. [ Links ]
Sánchez O., Raga G.B., Zavala-Hidalgo J., 2009, Is the ocean responsible for the intense tropical cyclones in the Eastern Tropical Pacific? Elsevier Editorial System (tm) for Dynamics of Atmospheres and Oceans. DYNAT-D-09-00016. [ Links ]
Sen P.K., 1968, Estimates of the regression coefficient based on Kendall's Tau, J. Amer. Statist. Assoc., 63, 1379-1389. [ Links ]
Valdés M.A., Cortéz V.M., Pastrana F.J., 2005, Un Estudio Explorativo de los Sistemas convectivos de Mesoescala de México. Investigaciones Geográficas, Boletín del Instituto de Geografía, U.N.A.M., Abril, 056, 26-42. [ Links ]
Villegas-Romero I., Oropeza-Mota J.L., Martínez-Ménes M., Mejía-Sáenz E., 2004, Producción de agua y sedimentos por impacto de ciclones tropicales en la cuenca hidrográfica del río La Sabana, Guerrero. Terra Latinoamericana, Julio- Septiembre, 323-333. [ Links ]
Villegas-Romero I., Oropeza-Mota J.L., Martínez-Ménes M., Mejía-Sáenz E., 2009, Path and relation rain-runoff caused by hurricane Pauline in the Sabana River, Guerrero, México, Agrociencia, 43, 4. [ Links ]
White D., Richman M., Yarna B., 1991, Climate regionalization and rotation of principal components. Int. J. Climatol., 11, 1-25, doi:551.582.2:551.501.45: 551.577.21(748). [ Links ]

