


Servicios Personalizados
Revista
Articulo
 Inglés (pdf)
 Artículo en XML
 Referencias del artículo
 Enviar artículo por email
Indicadores
-
 Citado por SciELO
 -
 Accesos
Links relacionados
-
 Similares en
SciELO
Similares en
SciELO
Compartir

 Permalink
Geofísica internacional
versión On-line ISSN 2954-436Xversión impresa ISSN 0016-7169
Geofís. Intl vol.52 no.1 Ciudad de México ene./mar. 2013
Original paper
Hydro-climatic variability and forest fires in Mexico's northern temperate forests
José Návar* and Liliana Lizárraga-Mendiola**
* Professor, Natural Resource Management CIIDIR-IPN Unidad Durango Sigma 119, Fracc. 20 de Noviembre II, 34220 Durango, Dgo., México *Corresponding author: jnavar@ipn.mx
** Professor, Universidad Autónoma de Hidalgo, Departamento de Ingeniería Civil Email: lililga.lm@gmail.com.
Received: December 14, 2011;
accepted: August 08, 2012;
published on line: December 14, 2012
Resumen
Los cambios globales en las temperaturas pueden estar modificando el ciclo hidrológico de las cuencas forestales. Este reporte tuvo como objetivos estimar las variables del ciclo hidrológico interceptación, I, la evapotranspiración actual, E, y potencial, Et, la escorrentía, Q, y los cambios en el contenido del agua del suelo, θ; así como evaluar si las variables del ciclo hidrológico están presentando tendencias u oscilaciones que pudieran estar asociadas al calentamiento global en cuencas forestales del centro de Durango, México. El procedimiento del balance de masas sirvió para calcular las variables diarias del ciclo hidrológico con el uso de los sub-modelos de I y Et para evaluar finalmente la Q y θ. Los datos se sujetaron a un análisis de regresión y a técnicas auto-regresivas y de promedios móviles, ARIMA, para evaluar la significancia estadística de las tendencias. El valor acumulado del valor estándar de z magnificó y los modelos ARIMA proyectaron estadísticamente bien las oscilaciones mensuales y anuales de las variables del ciclo hidrológico. Las ecuaciones de regresión y las tendencias de los modelos ARIMA mostraron que las variables mensuales y anuales de P, I, E y Et, Q, y θ no siguen tendencias claras en tiempo con significancia estadística; éstas a su vez, siguen oscilaciones que pudieron ser predichas adecuadamente con modelos ARIMA. Se encontró una asociación consistente (p ≤ 0.05) entre θ y el número de incendios y la superficie forestal incendiada a pesar de las diferentes escalas en las cuales se evaluaron estas variables. El análisis muestra que el calentamiento global está contribuyendo a incrementar la variabilidad hidrológica estacional al aumentar los pulsos de sequía y humedad en tiempo. Sin embargo, se requiere de investigaciones adicionales para probar esta hipótesis con el uso de series de tiempo más largas, con otro tipo de técnicas estadísticas y con la incorporación de otras variables en el análisis.
Palabras clave: análisis de regresión, modelos auto-regresivos con promedios móviles, precipitación, interceptación, evapotranspiración, escorrentía y contenido del agua del suelo, incendios forestales, plagas y enfermedades.
Abstract
Global warming is likely modifying the hydrological cycle of forested watersheds. This report set as objectives to: a) assess the hydrological variables interception loss, I, potential and actual evapo-transpiration, E, Et, runoff, Q, and soil moisture content, θ; b) evaluate whether these variables are presenting consistent trends or oscillations that can be associated to global warming or climate variability; and c) relate θ to the number of wildfires and the burned area in Durango, Mexico. A mass balance approach estimated daily variables of the water cycle using sub-models for I and Et to calculate Q and θ for a time series from 1945 to 2007. Regression and auto-regressive and moving averaging (ARIMA) techniques evaluated the statistical significance of trends. The cumulative standardized z value magnified and ARIMA models projected statistically similar monthly and annual time series data of all variables of the water cycle. Regression analysis and ARIMA models showed monthly and annual P, I, E, and Et, Q, and θ do not follow consistent up or downward linear tendencies over time with statistical significance; they rather follow oscillations that could be adequately predicted by ARIMA models (r2 ≥ 0.70). There was a consistent statistical association (p ≤ 0.05) of θ with the number of wildfires and the area burned regardless of the different spatial scales used in evaluating these variables. The analysis shows seasonal variability is increasing over time as magnifying pulses of dryness and wetness, which may be the response of the hydrological cycle to climate change. Further research must center on using longer time series data, testing seasonal variability with additional statistical analysis, and incorporating new variables in the analysis.
Key words: regression analysis, autoregressive moving average models, precipitation, interception loss, evpo-transpiration, runoff, soil moisture content; forests fires, pests and diseases.
Introduction
Global warming by the continued build up of greenhouse gasses, GHG, in the atmosphere is predicted to lead to significant changes in climate (Ritter, 2009). The IPCC (2001; 2009) reported how Earth temperature has increased in the last century in contrast to the previous 200 years. Transient increasing temperatures of 0.6-0.80C in the last 150 years may already be magnifying climate as Held and Sodden (2006) predicted robust hydrological responses to global warming by additional increases of GHG in the atmosphere. In the present, instrumental records show in-creased precipitation of 0.5 to 1.0% per decade in much of the Northern Hemisphere mid and high latitudes; in contrast to the subtropics where rainfall has decreased during the 20th Century by 0.3% per decade (Folland et al., 2002).
Forests, as oceans regulate and buffer climate changes at the expenses of increased pressure. The world forests influence climate through physical, chemical, and biological processes that affect planetary energetics, the hydrologic cycle, and atmospheric composition. The complex and non-linear forest-atmosphere interactions are issues widely studied since these connections can be dampened or amplified (Bonan, 2008). The effect of regional warming and consequent increases in water deficits as likely contributors to the pervasive boost in tree mortality rates of forests of western United States is one issue of these interactions recently reported (van Mantgem et al., 2009). Recent drought-related and warming has also been implicated as contributing to pulses or episodes of regional forest dieback such as those caused by bark beetle outbreaks in southwestern North America (Breshears et al., 2005; Raffa et al., 2008) and northern Mexico (SEMARNAT, 2005). Increased pulses of wildfire activity in the Rocky Mountains temperate forests has also been associated to increased spring and summer temperatures (Westerling et al., 2006).
Forest fuels, heat and oxygen are necessary for a fire to burn. Ground (organic soil, duff, and moss), slash (litter), living trees and miscellaneous (grass) are classifications of forest fuels (Reinhardt and Crookston, 2003). Drought desiccates all kinds of fuels; living fuels, large dead fuels, deep duff layers, and organic soils and it has an obvious effect on wildfires; spread rates and fire intensities. Intense wildfires occur when drought and frosts happen continuously since these perturbations add large amounts of young foliage onto the soil; and the burn probability increased with the presence of young fuels in Portugal (Fernandes et al., 2012).
In northern Mexico, increased tree mortality rates have not been documented so far. However, significant pulses of wildfire events have been recorded during the last three decades (SEMARNAT, 2005). Although these pulses of tree mortality have been associated to drought elsewhere, there is no information on the drought episode itself, its magnitude, frequency, and how it could be related to global or regional warming. Large wildfires in the region are believed to have increased in extent, frequency, magnitude and duration due to the likely effect of land-tenure changes and the suppression of frequent light fires (Fulé and Covington, 1997; Drury and Veblen, 2008) although the potential effect of global warming cannot be ruled out. Consensus has been that increasing temperatures causing soil dryness beyond normal thresholds are responsible for the pervasive tree mortality rates as well as for tree mortality by wildfire activity. However no evidence of soil dryness and its magnitude has ever been reported.
In spite of this information, little research has gone toward determining whether environmental changes are contributing to chronic, long-term shifts in variables of the hydrological cycle as an aid to quantify water deficits in Mexico's northern temperate forests in order to assess global warming impacts. Neither has the water deficit issue been documented in the region and associated to global warming-related events. Since forests regulate the hydrological cycle by redistributing precipitation; climatological drought reported as a reduction of precipitation in contrast to its mean value is different than soil water deficit that is the most important variable for tree survival and dieback. Therefore, this report aimed at: a) evaluating the variables of the hydrological cycle daily interception loss, potential and actual evpotranspiration, runoff and soil moisture content; b) assessing whether the mean values of these variables in addition to instrumental precipitation and pan evaporation are transiently changing over time; c) relating large-scale climatic events to wildfires, and d) associating assessments of soil moisture content to wildfires in a forested watershed near El Salto, Durango, Mexico.
The hypothesis tested was that variables of the hydrological cycle do not follow consistent trends in dryness or water deficits. If the null hypothesis is rejected, then these findings suggest forests of Northern Mexico are under increasing drought-related stress that could lead to the potential increased continuous mortality rates as those observed in western North America by van Mantgem et al. (2009). The acceptance of the null hypothesis would lead to the conclusion that cycles or oscillations in hydrological variables cause forest stress that produce pulses of tree mortality such as those noted by increased wildfire activity reported by Breshears et al. (2005) in southwestern U.S.A as well as those observed for the studied Mexico's northern temperate forests (SEMARNAT, 2005). Both types of disturbances can happen simultaneously but they have never been reported in Mexico's northern temperate forests. The forest ecosystem responses to climate change must be understood and reported as an aid to potentially convey sustainable practices to buffer climate change and/or variability impacts on forests.
Materials and Methods
Description of the study area
This study was conducted at the watershed 'La Rosilla', which drains into the 'La Rosilla II' reservoir; both located at the Ejido La Victoria, Municipality of Pueblo Nuevo, Durango, Mexico. The watershed covers an area of 944 ha and spans 23° 44' 00" north latitude and 105° 27' 00" west longitude, at the southwestern portion of the Sierra Madre Occidental mountain of Durango, Mexico (Figure 1).
The watershed sits within the Hydrologic Region No 11 (Presidio-San Pedro), in the uplands of the Rio Presidio basin. The main stem of the river is named Arroyo Quebrada El Salto, a tributary of the Rio Presidio (CFE, 1998).
La Rosilla watershed features several microclimates, according to the Köppen climatic classification scheme and modified for Mexico by García (1987): a) in the highlands, the temperate-cold, humid climate, with summer rains and mean annual temperature between 5 to 12°C is classified as C(E)(W2); the rest of the ejido presents a temperate, humid climate with summer rains, and mean annual temperature ranging from 12 to 18°C. Summer rains are characterized by thunderstorms concentrated between July to September. Mean annual rainfall depth and temperature at the climatic station of El Salto is approximately 900 mm and 9.3°C.
Most of the watershed is covered by temperate forests with mixtures of pines, oaks, and other conifers. Main distributed pine species are Pinus cooperi, P. durangensis, P. engelmannii,P. teocote, P. herrerae, P. leiophylla and P.ayacahuite. The most frequent oak species observed are Quercus sideroxyla, Q. durifolia,Q. rugosa and Q. candicans. Juniperus spp., Cupressus spp., Pseudotsuga spp. and Abies spp. are other temperate conifer species that make up the forest community within the watershed. Other broad leaf species found within these forests are Arbutus spp and Alnus spp. The lower strata are conspicuous and dominated by manzanita (Arctostaphylos pungens) and encinilla (Quercus striatula).
The hydrological model to evaluate itscomponents
The components of the water cycle in the forested watershed used a model based on the mass balance approach (Návar, 2008). The model physically computes changes in θ as a function of the difference between inputs and outputs (model 1). Input is P and outputs are I, Et (transpiration, T, and evaporation of water from the soil, Es) and Q (surface runoff and leakage to aquifers); see Equations (1), (2), (3), (4), and (5). This model assumes that θ above field capacity leaks down into shallow perched water tables that eventually transforms into discharge via subsurface, surface, and aquifer discharge. The intrinsic assumption is that there is little or no Hortonian surface runoff, and it appears to be correct for most forested soils for most of the time, since high average final infiltration rates of the order of close to 130 mm h-1 had been measured (Dueñez et al., 2006). Only 7% of the rains that occur annually and close to 30% of rains that have a frequency of a two-year return period produces surface runoff in Mexico's northern forested watersheds (Dueñez and Návar, 2005; Dueñez et al., 2006).
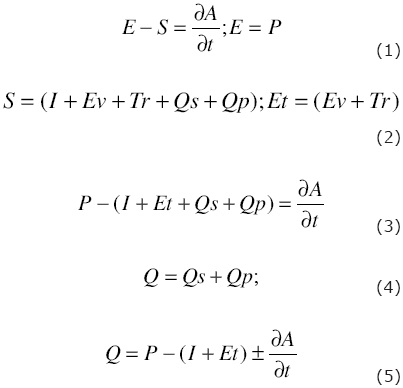
Precipitation, P, is conventionally recorded in rain gauges set at the climatic station El Salto, Dgo., Mexico. Leakage, percolation, or deep infiltration, Qs, equals to discharge, Q, since surface runoff, Qs ≈ 0. Interception loss is the amount of rainfall that wets canopies and litter (foliage, bark, and litter) and returns to the atmosphere via evaporation without contributing to soil moisture.
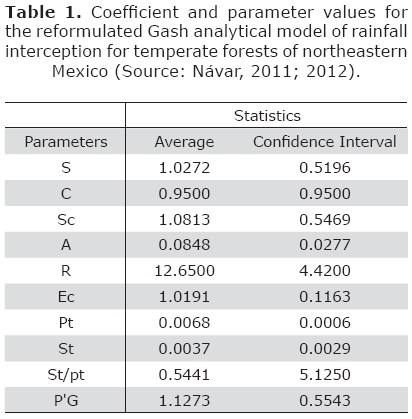
The revised Gash analytical model (Gash et al., 1995; Valente et al., 1997) was used to predict I since it is simple, flexible, and requires few parameters that can be easily derived. The model has been reformulated to give a better description of the evaporation flux from sparse forests and appropriately tested for forests of northeastern temperate forests (Návar, 2012). Gash et al. (1995) introduced the following analytical model of rainfall interception (6):

Where: I is the interception loss depth, m is the number of small storms insufficient to saturate the canopy (e.g., < P'G), n equals the number of events which saturate the canopy (e.g., > P'G ) and q equals the number of storms which saturate the stems, PGj is gross rainfall, st is the trunk storage capacity, pt is the proportion of rainfall reaching the trunks, P'G is amount of rainfall necessary to fill the canopy storage capacity.

Where: Ēc = the evaporation rate during the storm per unit area of cover, Sc = the canopy storage capacity per unit area of cover, R = the average rainfall rate onto the canopy.
The coefficient and parameter values for the Gash revised analytical model used in this research are reported in Table 1.
Evapo-transpiration, Et, is the amount of water that leaves the soil via evaporation from the soil surface, Ev, and via transpiration, Tr, as a vital process conducted by plants. An estimator of Et is measured in conventional pan evaporimeters; and it is named potential evaporation because water is fully available for climate to evaporate. Actual evapo-transpiration, Etp, is the evapo-transpiration weighted by soil moisture content (θi), plant (Ftv), and climatic (Fc) factors. For example, soil factors that control Etp are the current soil water content, θi, the soil water con-tent at wilting point, θpmp, and the soil water content at field capacity, θcc. The plant factor is a function of the type of vegetation, density, age, etc. The climatic factor is controlled by evapo-transpiration. Actual evapo-transpiration is estimated using these factors as in equation (8):

Details of the soil, plant and climatic factors can be found in several hydrology and soil physics books (Hillel, 1982; Viessman et al., 2007). In this study, twelve soil samples were collected and distributed within the watershed for laboratory analyses to estimate the field capacity, wilting point, soil bulk density, and soil specific density. On site, the depth of soil and litter layer was also measured. The coefficient and parameter values for the soil components of sub model 8 are reported in Table 2.
Where: ASNM = Altitude above sea level (m); P = slope (%), PMO = depth of litter layer (mm); PS = depth of soil (cm); DA = soil bulk density (g cm-3); DR = soil specific density (g cm-3); CC = field capacity (%); PMP = wilting point (%).
The model was run in a time difference of one day to estimate the current soil moisture content; e.g., θi = θi -1 ± [Precipitación i-1 – Intercepción i-1 – Etp i -1 – Qi-1]. Where: the i-1 refers as the day before day i. Again, discharge was estimated as the soil moisture content that runs off and that is mathematically described as the amount of soil moisture content above field capacity and this amount of water is subtracted immediately to attain the soil water content at field capacity. Since at this time there is a lack of information on the shape and rate of recession flow, the time of concentration, time to peak, peak flow, etc., hydrographs cannot be derived at this point with this model.
Information to develop the reformulated interception loss model of Gash was obtained from measurements conducted on mixed, pine-oak temperate forests of Nuevo Leon, Mexico by Návar (2011; 2012). The climatic factor, Fc, was estimated to be 0.75 in agreement with findings carried out by Penman (1986). The plant factor, Ftv, was estimated to be 1.25.
The mass balance model (1) has been indirectly validated by associating thresholds of the number of days below certain soil moisture content with the number of wildfires and the area burned by wildfires with very good degree of precision (Návar-Cháidez, 2011). In this report, further validation of this model is provided using the burned area and the number of forest wildfires as dependent variables and the average soil moisture content as the dependent variable. Návar (2008) also calculated daily, monthly and annual discharge into "La Rosilla II" reservoir with good preliminary expectations since accountability was precise by quantifying for changes in reservoir sto-rage, losses to deep recharge, evaporation, and supply. At this time, there are no measurements of soil moisture content, interception, or discharge in the studied watershed, therefore the model could not be directly checked and validated.
Data analysis
Daily measurements and assessments of precipitation, interception loss, potential and actual evaporation, runoff, and soil moisture changes summed or averaged over a month or over a year provided monthly and yearly measurement and assessments of each variable. Conventional regression analysis using least square techniques tested the hypothesis for trends; e.g., Y = a + bX; where Y = is the variable of the hydrological cycle and X is just a consecutive number (1 to 756 for monthly or 1945 to 2007 for annual data); a, B are statistical parameters to be estimated using SAS v 8.1. The null hypothesis that B = 0 was tested; if Ho is true then no statistical significant tendencies are shown by the variable. That is, the time series is stationary in its first momentum. In addition, ARIMA models fitted to monthly and annual data statistically tested for trends. Monthly and annual hydrologic data variables were smoothed using a moving average of t=3; then the ARIMA models were fitted to this data set. The Southern Oscillation Index, SOI, an index of the El Niño/Southern Oscillation, ENSO, was related to the variables of the hydrological cycle using regression analysis.
The magnification of variability
In order to magnify oscillations or cycles, the data was analyzed by accumulating the standardized z parameter as in model (8):

Where: xi = the hydrological variable at time t=i;  = mean value of the hydrological variable; σ = the standard deviation of the hydrological variable of interest.
Procedure
The variables of the hydrological cycle were estimated with model (1), (2), (3), (4), (5), (6), and (7). Regression analysis and ARIMA models tested the hypothesis that B = 0. ARIMA models fitted the data for prediction purposes in addition to detect patterns and oscillation on the hydro-climatic data. The cumulative z departures magnified oscillations and cycles. Hydro-climatic cycles and oscillations were then associated to pulses of disturbances on forests such as increasing wildfire events; as well as to the ENSO related events such as the SOI. Trends could then likely be associated to pervasive perturbations such as continuous forest dieback or increased tree mortality rates in Mexico's northern temperate forests.
Results
Regression equations
The slopes, standard errors, F values and probabilities larger than F for all regression equation are shown in Table 3.
Where: S error= standard error; F = value of the Fisher F density function; P>F = probability calculated from the F value to the infinite; Eta = actual evapo-transpiration.
For the regression equations, all probability data had values larger than 0.05; therefore the null hypothesis (e.g., B = 0) was accepted for monthly and annual data. That is, the slope values statistically approached a value of 0. Hence, the hydrological variables do not show consistent up or down monotonic linear trends or tendencies in the mean value that can be linked to continuous global warming or climate change that can be further related to increasing forest disturbances for the study period (1945-2007). The effect of climate change may be on shifts of the frequency and magnitude of these variables; on the second momentum (the variance); in the magnitude of pulses or dryness and wetness, etc. However, at this time there is not sufficient information to test these other indications of climate change. The mean monthly and annual P, I, E and Et, Q, and θ values remain quite constant throughout the study period. Probabilities of between 0.12 ≤ P>F ≤ 0.19 were estimated for annual Q, annual Et, annual I and annual P.
The statistics for the best fitted ARIMA models with a trend are depicted in Table 4.
Where: SX = standard error; R2 = coefficient of determination; P > t = probability calculated from the t value to the infinite for the linear trend of each model; Eta = Actual evapo-transpiration; θ. = Moisture content; ARIMA = auto-regressive integrated with moving average models with a linear trend; (n, 0, p) = number of auto-regressive and moving average parameters, respectively with a lack of seasonal tendencies, 0.
For all ARIMA models, the probability larger than t was > 0.05. Therefore, ARIMA models did not account for statistical significant linear trends or tendencies. However, the linear trend improved quality statistics of all models that it is useful for prediction purposes. Most models required only 2 or 3 auto-regressive and 1 moving average parameter to fit data well. The variance explained by the models (e.g., the R2) was larger for monthly, with a mean value of 0.84 than for annual (R2 = 0.59) data. That is, ARIMA models fitted better monthly than annual data perhaps because of the number of data values (n = 756 for monthly and n = 64 for annual data) or the consistent seasonal variability in the monthly data sets.
Raw hydrologic, smoothed and modeled data are depicted in Figure 2 for monthly and in Figure 3 for annual data for precipitation, interception loss, actual evapo-transpiration, runoff and soil moisture content, respectively.
The ARIMA models for annual data did not fully display variability because they predict the smoothed time series. However, oscillations and cycles are well noted in the annual and monthly time series, respectively. The magnification of cycles and oscillations are better observed in Figure 4.
Cycles and oscillations describe the data better than linear trends or tendencies in the hydrological variable datasets. The intra and inter-annual variability can be observed by the up and downs of all hydrological variables in Figures 2, 3, and 4. For example for precipitation, the dry season (November-May) repeats itself every year. The inter-annual variability is noted because it takes on the average every 1, 2 or sometimes 3 years annual precipitation to repeat itself. That is, larger or smaller figures than the average are expected every 1, 2 or 3 years.
The decadal drought episode of the 1950's (1945-1963) is well depicted in all these time series of Figures 3 and 4 because of a consistent reduction in precipitation, interception loss, and runoff. Actual evapo-transpiration and soil moisture content show the large dry effect of the 1950's was dampened a few years later, from 1955-1962. The 1990's drought spell is observed in precipitation, interception loss and runoff. Actual evapo-transpiration remains quite constant during this period and soil moisture content diminishes from 1987-1997 and from 1998 to 2004. Longer time scale oscillations that ended and started somewhere between 1963-1965 are noted in these time series. However, information for longer time series is required to verify these potential cycles. The water deficit expressed as soil moisture content below the average does not appear to show well defined temporal cycles beyond the intra-annual variability. However, well defined downward tendencies in different time periods (1950's, early 1980's, early 1990's, and from 1993-2004) and of different duration (9, 4, 3, and 11) are observed in Figure 4.
Time series for the 1945-2005 dry season(January-May)
The annual time series of the hydrological variables for the dry season (January-May) is depicted in Figure 5.
The mean soil moisture content values attain a figure very close to the wilting point (0.27 cm cm-1) during 1994-1996 and 1998-2001 (Figure 5). Quite wet soil moisture content during the dry seasons is found during 1949-1952; 1966-1970; 1980-1985. Years 1992 and 1997 had high unseasonal soil moisture content immersed within a prolonged drought during the dry season. Precipitation, actual evapo-transpiration, and runoff were quite small during 1974-1977; 1988-1991; 1993-1996; and 1998-2001. On the other side, potential evapo-transpiration and the difference between Etp-Eta showed high values during these last time periods.
The number of days with soil moisture content values smaller than 0.30 or 0.35 showed upward tendencies across time but with no statistical significance (p=0.42 and p=0.34, respectively). However, the number of runoff events is statistically increasing over time (p=0.038). A value of θ = 0.30 cm cm-1 is quite close to the wilting point for these forest soils, that is, θpmp = 0.27 cm cm-1 (Table 2). Soils with moisture content near the wilting point (θ = 0.30 cm cm-1) persisted during the 1990's. In eight years, the number of days with 0.30 cm cm-1 was larger than 105 out of 151 for the period of 1998-2001, more than 122 days out of 151 had soil moisture content values smaller than 0.30 cm cm-1. This is a drought spell lasting four consecutive years with soils near the wilting point during most of the dry season.
Associating soil moisture content to wildfires
The area burned by forest wildfires and its predicted exponential decaying 3-parameter function are depicted in Figure 6. The equation projects a large burned area (e.g., > 30,000 ha) with soil moisture content near the wilting point; a sharp decrease in burned area with increased soil moisture content until it reaches a steady, constant burned area with θ ≥ 0.32. Average soil moisture content values during the dry season accounts for by 43% of the total burned area variation in the State of Durango, Mexico. The soil moisture content near the wilting point (e.g., < 0.30 cm cm-1) produce a mean burned area of close to 30,000 ha while soil moisture contents of between 0.32 ≤ θ ≤ 0.41cm cm-1 produce only a mean burned area of close to 5,000 ha. A lack of biomass density on top of soils, sources of ignition, or a combination of both may have accounted for by the small area burned by forest fires in soils near the wilting point.
The number of forest wildfires also decays as a function of soil moisture content, although the variance accounted for by the equation was only 33% (Figure 6). Two sets of data can be observed in Figure 6; the first one for more than 300 wildfires and the second one for less than 230 wildfires. The former data set has a quite small (θ ≤ 0.30 cm cm-1) and the later one has a large soil moisture content variability (0.28 ≤ θ ≤ 0.41 cm cm-1). Other sources of information such as wind speed, direction, the amount of biomass on the forest floor, ignition sources, etc. may account for fewer fires per unit time during dry soil moisture conditions in the second data set.
Climate variability and its association towildfires
Spectral density analysis, autocorrelograms and cumulative standardized deviations on hydro-climate variables showed statistically significant peaks (p ≤ 0.05) at three time scales; 1-2; 3-7; and 9-11 years. The annual Southern Oscillation Index, SOI, was significantly associated to dry seasonal values for soil moisture content (r2=0.08; p=0.05), precipitation (r2=0.11; p=0.02), interception loss (r2=0.11; p=0.02), actual evapo-transpiration (r2=0.108; p=0.02), and the difference between Et and Etp (r2=0.12; p=0.02). The first four variables had negative slopes unlike the last one. Smaller soil moisture content, precipitation, interception loss, and actual evapo-transpiration and larger Et-Etp values are expected with the presence of El Niño/Southern Oscillation. La Niña/Southern Oscillation produces the opposite effect, according to the regression equations. Although this association is statistically significant, the amount of variation explained by these synoptic climatic phenomena is less than 12% leaving a great deal of unexplained variation.
The PDO raw data did not predict well dry seasonal soil moisture content (p=0.11), precipitation (p=0.14), interception loss (p=0.14), pan evaporation (p=0.11), actual evapo-transpiration (p=0.11), runoff (p=0.29) unlike the difference between pan evaporation and actual evapo-transpiration, Et-Etp (p=0.03). The PDO produces a negative effect in the Et-Etp values; in contrast to the El Niño/Southern Oscillation phenomenon. That is, these two climatic phenomena appear to somehow offset each other during the 1945-2007 studied time series.
The combined effect (ENSO, PDO) was not statistically significant for dry seasonal soil moisture content (p=0.10), precipitation (p=0.06), interception loss (p=0.06), unlike for actual evapo-transpiration (p=0.05), and the difference between Et-Etp (p=0.03). The ENSO is negatively related and the PDO is positively related for the first four variables and the inverse is correct for the difference between Et-Etp, respectively. Positive values of El Niño/Southern Oscillation and negative values of PDO reduce the soil moisture content, precipitation, interception loss, and significantly reduce actual evapo-transpiration but increase the difference ET-Etp.
Discussion
A lack of statistical significant trends or tendencies in mean values of variables of the hydrological cycle is consistent across instrumental and estimated data sets. This finding show the mean value of the studied hydrological variables with these techniques appears be only slightly related to the effect of global warming over time since the probability was near 0.10 for the annual time series. A different approach to test the effect of global warming on the hydrological variables is by relating it to the variance, the frequency and shifts in the magnitude of these variables. Climate change may dampen its effect as pulses of change of different magnitude and time interval since forests and oceans may regulate and buffer this effect. These are issues that require further study. For example, dry pulses can be observed at the temporal scales; seasonal, inter-annual, every 3-7 years; and every 10-13 years and likely every 70-80 years. Further studies on the frequency, magnitude, and intensity of these pulses may shed more light into the effect of global warming on hydro-climate variables at El Salto, Durango, Mexico.
A simple argument would then be that the number of observations is a shortcoming for testing correctly the hypothesis B = 0. For example, for the annual variables precipitation, interception loss, and weighted actual evapo-transpiration the probability of rejecting the null hypothesis was close to 10%. That is, in the near future the hypothesis of no shifts in the mean values would probably be rejected as more hydro-climatic data is recorded. A second approach to increase the number of observations is to reconstruct paleoclimate by using several techniques, amongst which dendrochronology is an important methodology for this case studies (Cleaveland etal., 2003; Stahle et al., 1999; González-Elizondo et al., 2005; Návar-Cháidez, 2012).
The pervasive continuous forest decline or increased rates of forest loss as those found over western North America by van Mantgem et al. (2009) are explained by regional warming and consequent continuous increases in water deficits. Data analysis for this report shows the 1990's reported more frequent water deficits in Mexico's northern temperate forests than any other time recorded in this analysis. Further data will show if this dry pulse would repeat itself in the near future as a more important sign of climate change. In the meantime, continuous tree mortality rates have not been recorded in the region, independent sources of data such as the volume of harvested dead trees shows also a lack of statistical significant linear trends over the years for the State of Durango, Mexico (SEMARNAT; 2005). A large pulse of harvested dead trees was recorded during 2002 and the future would also tell whether this record breaks as a consequence of magnified pulses of dryness by climate change.
Soil moisture content is probably the best indicator of water deficit in forests because of its regulating effect on the hydrological cycle. This variable is the single most important one to assess how trees can be potentially stressed by droughts. Pan evapo-transpiration and the difference between Et-Etp, on the other hand are likely the best indicators of global warming as water evaporation is a function of temperature. None of these variables showed consistent linear tendencies or trends in the mean values of this data set that can be straightforwardly associated to global warming. Pulses of up and downward cycles or oscillations were the norm in this case study.
The hydrological variables studied showed instead short term tendencies or oscillations that can be associated to pulses of tree mortality by increased wildfire activity as those recorded for southwestern North American dry forests by Breshears et al. (2005) and Mexico's northern temperate forests during later last and early this century (SEMARNAT, 2005); as it has been also observed for other ecosystems as well (Raffa etal., 2008). In Durango, Mexico, large-scale (> 40000 ha) forests wildfires in number and area burned occurred during 1989, 1991, 1993, 1995, 1996, 1998, 1999, and 2011 for the period of 1970-2011 (SEMARNAT, 2012). Years 1998 and 2011 recorded the largest area (> 70000 ha) burned by wildfires in type, number and area burned. Years 1998 and 2011 reported the driest years in terms of soil moisture content, the later one with close to 250 consecutive days with 0 precipitation. The former one with an average soil moisture content of 0.28 cm cm-1 and approximately 10% of likelihood of occurrence in the number of dry days (127 and 151 out of 151) with soil moisture content values near the wilting point (e.g., of less than 0.30 and 0.35 cm cm-1, respectively), and seasonal precipitation was the smallest ever recorded (18 mm) during the dry season (January-May). Wildfire events of 1998 and 2011 would probably have been magnified by the antecedent and widespread frosts that recorded below -150C in the region. Frosts of this magnitude make trees shed their leaves in a time-scale of weeks and kills herbaceous understory fuels that carry large fires. All this litter-foliage provides an important dry biomass source for starting fires. In addition, the wildfires of 1998 were combined with strong Pacific Ocean dry winds that hit the country in most of late winter and spring of 1998 (CNA, 1998).
The following three years (1999, 2000, and 2001) remained consistently dry (Figure 5) during the dry season; with a mean value of 0.28 cm cm-1; with less than 18% of probability of the occurrence of these events and number of days with less than 0.30 and 0.35 cm cm-1 was more than 122 days per each year, a statistic well above the average. By the year 2000, seasonal actual evapo-transpiration reached one of the smallest values ever recorded (32.6 mm) because of a lack of soil moisture content to evapo-transpirate soil water. This translates that almost always soils were close to the wilting point and left little or no soil water for evapo-transpiration during the dry season. The stress caused by this dry episode (1998-2001) was sufficient to weaken trees and to make them prone for bark beetle outbreaks that spread all over the Mexico's temperate forests. Note that this hydrological study was conducted on a specific site near El Salto, Durango, Mexico. However bark beetle infested simultaneously much of the Mexico's northern forests in a reported area of close to 50,000 ha stressing the importance of large scale perturbations that can be monitored at short spatial scales. It is important to note that during the period of 1993-1996, the number of dry years during the dry season was also above the average with 1997 being the only wet year in between these two dry episodes (only 6 and 34 days reported θ values < 0.30 and 0.35 cm cm-1, respectively).
The drought spell of the 1990's appeared to be stronger than that of the 1950's. For the later decade, the number of dry days was just on the average number of dry days for the entire time series, close to 90. Only 1956 and 1957 reported n > 108 dry days. Breshears et al. (2005) for southwestern North American woodlands reported extensive bark beetle infestations in 2002-2003 and stressed that it was also highly likely that this last episode may have had warmer conditions than the drought episode of the 1950's. Preliminary analysis of this data for Durango, Mexico shows that the 1950's and the 1990's had 353 and 320 mm and 250 and 243 mm of potential evapo-transpiration and Et-Etp, respectively, indicating the former drought spell was warmer than the second one. The 1950's drought spell was less dry than that of the 1990's. However, this is a matter of further study with this and other additional sources of information.
Large-scale climatic events causing these oscillations and potential tendencies have been well documented in the last two to three decades. Although the inter-annual variability requires additional sources of information in order to be more explicitly described; the annual position of the Bermuda High in the North Atlantic Ocean combined with the northward seasonal displacement of the Inter-tropical Convergence Zone, ITCZ, may partially control this variability.
The second dry-wet cycle (3-7 years) correlates well with indices of El Niño/Southern Oscillation, ENSO, as it has been found for other places and datasets (Cavazos and Hastenrath, 1990; Cleaveland et al., 2003; Stahle et al., 1999; Méndez-González et al., 2008). Hydrological data for this study exhibits statistically significant spectral peaks in the ENSO frequency band near periods of 4 years as it has been found for instrumental and proxy precipitation records of Durango, Mexico as well (Stahle et al., 1999). In northern Mexico, the ENSO causes severe and prolonged summer droughts and wet winters (Cavazos and Hastenrath, 1990; González-Elizondo et al., 2005) with total reduced annual rainfall and it has a direct control on all variables of the hydrological cycle as well. For example during the decade of the 1990's two ENSO events occurred (1992 and 1998) with the second one being the strongest of the last century.
The third quasi decadal discharge dry-wet variability is evident in all ARIMA models, spectral density analysis, as well as in the hydrological variable data sets. The northeastern Pacific Ocean cooling - warming cycle, called the Pacific Decadal Oscillation, PDO, appears to be slightly related to this phase for northern Mexico (Jones, 2003). Quasi-decadal sequences repeated in the time series and ARIMA models during the 1950's and 1990's. The cooling of the northeastern Pacific Ocean surface waters brings above average rainfall and discharge to northern Mexico (Návar-Cháidez, 2012). The PDO effect has also been noted in Utah although its control is not consistent over time and appears insignificant during periods of instrumental recorded data (Tingstad and MacDonald, 2010). Weak associations between annual discharge and PDO variability can be explained since the latter manifests mostly in the North Pacific region and can persist over several decades. Mantua et al. (1997) described periods of 15-25 years and 50-70 years and dry spells last at the most 15 years (1950's) for this time series data.
Longer time-scale climatic events are also causing oscillations and likely tendencies in the hydrological variables studied that appeared to end and start during 1963. The Atlantic Multidecadal Oscillation, AMO, is a climate pattern of SST anomalies in the North Atlantic with a recurring period of 65-80 years (Knight et al., 2006). Positive AMO index values have been associated with drought in the continental U.S. during the 20th Century (Enfield et al., 2001). This cycle appears to control all hydrological variables when calculating and plotting the cumulative Z index time series data (Figure 4). However, instrumental precipitation data and evaluated variables are not sufficient at this time to statistically correlate this tendency.
The future decadal drought spell would occur likely under warmer temperature and probably under dryer soil moisture conditions as potential climate change progresses and larger, magnified pulses of drought-induced vegetation die-off could be expected as explained by Breshears et al. (2005) for southwestern U.S.A. Increased dieback pulses would be the temperate forest ecosystem response to drought and associated increased wildfire activity; since the number of dry days near the wilting point (θ ≤ 0.30 cm cm-1) is steadily increasing over time during the dry season as well. The number of runoff events is also statistically increasing over time, then, potential climate change would appear is erratically increasing seasonal hydrological variability in the region as it has been also reported for other places but this is a matter of further studies.
Conclusions
This report analyzed variables of the hydrological cycle of a Mexico's northern forested watershed using a mass balance model; tested whether these mean values of these variables are transiently changing over time or changes obey to climate variability oscillations of different magnitudes and durations; and associated hydrological variables, large-scale climate events, and forest wildfires in the region. Regression techniques and ARIMA models provided a better understanding of these changes and how they are associated to recent forest wildfires that have spurred into the region. Long-term linear trends or tendencies in mean values were absent in the studied time series, and oscillations of different magnitude and duration featured these data sets (1945-2007). Soil water deficits or drought spells could then be associated to forest fires that occurred in the last two decades. Future research may center on how these drought spells are controlling tree growth in such a way that eventually growth slows leading to the weakening of trees and finally to promoting die-off by wildfires.
Acknoeledgemnts
I would like to thank M.C. Ramon Silva F. for his help at excavating soil samples in the La Rosilla II watershed. This research was funded by the IPN through research grant given to J. Návar during 2012. The author is a COFAA scholar.
Bibliography
Bonan G.B., 2008, Forests and climate change: forcing, feedbacks, and the climate benefits of forests. Science, 320, 5882, 1444-1449. [ Links ]
Breshears D.D., Cobb N.S., Rich P.M., Price K.P., Allen C.D., Balice R.G., Romme W.H., Kastens J.H., Floyd M.L., Belnap J., Andeson J.J., Myers O.B., Myere C.W., 2005, Regional vegetation die-off in response to global-change-type drought. Proc. Natl. Acad. Sci. U.S.A., 102, 15144, 1599-1612. [ Links ]
Cavazos T., Hastenrath S. 1990, Convection and rainfall over Mexico and their modulation by the Southern Oscillation. International Journalof Climatology, 10, 377-386. [ Links ]
CFE, Comisión Federal de Electricidad, 1998, Manifiesto de Impacto Ambiental Modalidad General de La Presa La Rosilla II. Elaborado en convenio con CNA. Durango, México. [ Links ]
Cleaveland M.K., Stahle D.W., Therrell M.D., Villanueva-Diaz J., Burns B.T., 2003, Tree-ring reconstructed winter precipitation and tropical teleconnections in Durango, Mexico. Climate Change, 59, 369-388. [ Links ]
CNA, Comisión Nacional del Agua. 1998. Condiciones climáticas en la República Mexicana durante 1998, México, D.F. [ Links ]
Drury, S.A., Veblen T.T., 2008, Spatial and temporal variability in fire occurrence within the Las Bayas Forestry Reserve, Durango, Mexico. Plant Ecology, 197, 299-316. [ Links ]
Dueñez-Alanís J., Navar J., 2005, Estimación de la frecuencia y magnitud de los escurrimientos superficiales en bosques de coniferas de Durango. Divulgación 4, 6, 42-43. [ Links ]
Dueñez-Alanís J., Gutiérrez J., Pérez L., Návar J., 2006, Manejo silvícola, capacidad de infiltración, escurrimiento superficial y erosión. Terra Latinoamericana, 24, 233-240. [ Links ]
Einfield D.B., Mestas-Nuñez A.M., Trimble P.J., 2001, The Atlantic Multidecadal Oscillation and its relationship to rainfall and river flows in the continental U.S. Geophysical Research Letters 28, 10, 2077-2080. [ Links ]
Fernandes P.M., Loureiro C., Magalhaes M., Ferreira P., Fernandes M., 2012, Fuel age, weather and burn probability in Portugal. International Journal of Wildland Fire http://doi.org/10.1071/WF10063. [ Links ]
Folland CK., Karl TR., Salinger M.J., 2002, Observed climate variability and change. Weather 57: 269-278. [ Links ]
Fulé P.Z., W.W., Covington, 1997, Fire regimes and forest structure in the Sierra Madre Occidental, Durango, Mexico. Acta Botánica Mexicana, 41, 43-79. [ Links ]
García E., 1987, Modificaciones al sistema de clasificación climática de Köppen (adaptación a la Republica Mexicana). 4ª. Edición, D.F. 130 p. [ Links ]
Gash J.H.C., Lloyd C.R., Lachaud G., 1995, Estimating sparse forest rainfall interception with an analytical model. Journal of Hydrology 170, 79-86. [ Links ]
González-Elizondo M., Jurado E., Návar J., González-Elizondo M.S., Villanueva J., Aguirre O., Jiménez J., 2005, Tree-rings and climate relationships for Douglas-fir chronologies from the Sierra Madre Occidental, México: a 1681-2001 rain reconstruction. Forest Ecology & Management 213: 39-53. [ Links ]
Held IM., Soden B.J., 2006, Robust responses of the hydrological cycle to global warming. Journal of Climate Change, 19, 5686-5699. [ Links ]
Hillel D., 1980, Fundamentals of Soil Physics. Academic Press Ltd. London. U.K. [ Links ]
IPCC, Intergovernmental Panel on Climate Change. 2001. Impacts, adaptation, and vulnerability. Summary for Policy Makers. Cambridge University Press. Cambridge, UK. 17 pp. [ Links ]
IPCC, Intergovernmental Panel on Climate Change, 2009, Impacts, adaptation, and vulnerability. Summary for Policy Makers. Cambridge University Press. Cambridge, UK. 17 pp. [ Links ]
Jones D.L., 2003, El Niño, PDO, climatic cycles and drought in the Sierra Nevada. El Dorado County Water Agency. Water Resources Development and Management Plan. California. USA. [ Links ]
Knight J.R., Folland C.K., Scaife A.A., 2006, Climate impacts of the Atlantic Multidecadal Oscillation. Geophysical Research Letters 33:LI7706, doi: 10.1029/2006GL026242. [ Links ]
Mantua N.J., Hare S.R., Zhang Y., Wallace J.M., Francis R.C., 1997, A Pacific interdecadal climate oscillation with impacts on salmon production. Bulletin of the American Meteorological Society 78: 1069-1079. [ Links ]
Méndez-González J., Návar-Cháidez J.J., González-Ontiveros V., 2008, Análisis de tendencias de precipitación (1920-2004) en México. Investigaciones Geográficas 65: 38-55. [ Links ]
Mulholland PJ., Best, GR., Coutant CC., Hornberger GM, Meyer JL., Robinson PJ., Stemberg JR., Turner RE., Vera-Herrera F., Wetzel RG. 1997. Effects of climate change on freshwater ecosystems of United States and the Gulf of Mexico. Hydrological Processes 11: 949-970. [ Links ]
Návar J., 2008, Atlas Hidrológico del Estado de Durango. Inedito. 220 p. [ Links ]
Návar J., 2011, Stemflow variation in Mexico's northeastern forest communities: its contribu-tion to soil moisture content and aquifer recharge. Journal of Hydrology, 408: 35-42. [ Links ]
Návar J., 2012, The performance of the reformulated Gash's interception loss model in Mexico's northeastern temperate forests. Hydrological Processes. DOI: 10.1002/hyp.9309. [ Links ]
Návar-Cháidez J.J., 2011, Modelación del contenido del agua de los suelos y su relación con los incendios forestales en la Sierra Madre Occidental de Durango, México. Madera y Bosques 17: 65-81. [ Links ]
Návar-Cháidez J.J., 2012, Modeling annual discharge for six Mexico's northern rivers. Ambiente & Agua. An Interdisciplinary Journal. doi:10.4136/1980-993X. [ Links ]
Penman H.L., 1986, Natural evaporation from open water, bare soils and grass. Proc. Roy. Soc. London A (194), S. 120-145. [ Links ]
Raffa K.F., Aukema B.H., Bentz B.J., Carroll A.L., 2008, Cross-scale drivers of natural disturbances prone to anthropogenic amplification: the dynamics of bark beetle eruptions. Bioscience 58, 501, 507-521. [ Links ]
Ritter S.K., 2009, Global warming and climate change. Chemical and Engineering News 87: 11-21. [ Links ]
SEMARNAT, Secretaria del Medio Ambiente y Recursos Naturales. 2005. Informe de la situación de los Incendios Forestales en México. http://portal.semarnat.gob.mx/semarnat/portal. [ Links ]
Stahle D.W., Cleaveland M.K., Therrell M.D., Villanueva-Díaz J., 1999, Tree ring reconstruction of winter and summer precipitation in Durango, Mexico, for the past 600 years. In: 10th Symposium Global Change Studies. American Meteorological Society. Dallas, p 205-211. [ Links ]
Tingstad A.H., MacDonald G.M., 2010, Long-term relationships between ocean variability and water resources in northeastern Utah. Journal of the American Water Resources Association 46, 5, 987-1002. [ Links ]
Valente F., David J.S., Gash J.H.C., 1997, Modelling interception loss for two sparse eucalypt and pine forests in Central Portugal using reformulated Rutter and Gash analytical models. Journal of Hydrology 190, 141-162. [ Links ]
Van Mantgem P., Stephenson N.L., Byrne J.C., Daniles L.D., Franklin J.F., Fulé P., Harmon M.E., Larson A.J., Smith J.M., Taylor A.H., Veblen T.T. 2009, Widespread increase of tree mortality rates in the western United States. Science 323, 521-524. [ Links ]
Viessman W.J., Lewis G.L., Knapp J.W., 2007, Introduction to Hydrology. Fourth Edition. Harper & Row. New York. USA: 780 p. [ Links ]
Westerling A.L., Hidalgo H.G., Cayan D.R., Swetnam T.W., 2006, Warming and earlier spring increase western US forest wildfire activity. Science 313, 5789, 940-943. [ Links ]

