


Serviços Personalizados
Journal
Artigo
 Inglês (pdf)
 Artigo em XML
 Referências do artigo
 Enviar este artigo por email
Indicadores
-
 Citado por SciELO
 -
 Acessos
Links relacionados
-
 Similares em
SciELO
Similares em
SciELO
Compartilhar

 Permalink
Geofísica internacional
versão On-line ISSN 2954-436Xversão impressa ISSN 0016-7169
Geofís. Intl vol.51 no.3 Ciudad de México Jul./Set. 2012
Original paper
Mass changes from GRACE data in Argentina. A preliminary qualitative analysis
Ayelen Pereira1*, María Cristina Pacino2 and Rene Forsberg3
1 Facultad de Ciencias Exactas. Ingeniería y Agrimensura. Universidad Nacional de Rosario– CONICET. Av. Pellegrini 250, 3°– Rosario Argentina. *Corresponding author: apereira@fceia.unr.edu.ar.
2 Facultad de Ciencias Exactas. Ingeniería y Agrimensura. Universidad Nacional de Rosario– CONICET. Av. Pellegrini 250, 3°– Rosario Argentina.
3 National Space Institute. Technical University of Denmark. Juliane Maries vej 30, Building Rockefeller Office/Room 269 Denmark.
Received: May 05, 2010;
accepted: March 07, 2011;
published on line: June 29, 2012.
Resumen
Las misiones satelitales gravimétricas introducen un nuevo concepto en el modelado del campo gravitacional, ya que proveen valiosa información acerca del comportamiento geodinámico de nuestro planeta. La misión satelital GRACE permite obtener variaciones del campo de gravedad para una región determinada; además, estos cambios pueden relacionarse con el almacenamiento de agua y con el rebote postglacial, por ejemplo. El objetivo de este trabajo es mostrar las variaciones temporales del campo de gravedad detectadas en Argentina, provistas por los cuatro centros de procesamiento GRACE: CSR, JPL, GFZ y BGI. Todas las soluciones detectaron cambios de masas significativos en la región; sin embargo, existen algunas diferencias entre los cuatro centros de procesamiento de GRACE. Los mapas de tendencia y amplitud de la gravedad para el período 2002- 2008 muestran tres zonas de variaciones importantes: en la Patagonia, en la Cuenca del Plata y en la Cordillera de los Andes. Los cambios de gravedad en las dos primeras regiones están relacionados principalmente con la redistribución de agua continental; y en la tercera, con movimientos sísmicos. Asimismo, se muestran para las tres áreas los perfiles con las variaciones de tendencia y amplitud de la gravedad.
Palabras clave: GRACE, almacenamiento de agua, cambios de masa.
Abstract
Gravimetric satellite missions have introduced a new concept in gravitational field modeling, providing valuable information about the geodynamic behavior of our planet. The GRACE satellite mission allows obtaining monthly variations of the gravity field for a certain region; furthermore, in particular these changes can be related to terrestrial water storage and postglacial rebound, for example.
The aim of this work is to analyze the temporal variation of the gravity field as measured over Argentina, provided by four different GRACE processing centers: CSR, JPL, GFZ and BGI. All the solutions detected the significant mass changes of the area, thought there are some discrepancies between the four GRACE processing centers. Gravity trend as well as amplitude maps of these variations for the period 2002- 2008 show important features in three zones: Patagonia, La Plata basin, and the Andes Mountain chain. The gravity changes in the first two areas are mainly related to the continental water redistribution; and in the third one, with seismic movements. Also, the profiles over the three areas with the gravity trend and amplitude variations are shown.
Key words: GRACE, water storage, mass changes.
Introduction
The practical use of the theories elaborated a century ago for the study of the Earth by Gauss, Molodensky and Stokes, among others, (Heiskanen and Moritz, 1985; Torge, 2001) was only possible once the advance of satellite technology and computing tools enabled it. In practical specific applications, having a geoid model allows us to use an algorithm from which ellipsoidal heights can be transformed into orthometric heights.
Many countries, including Argentina, are encouraging the investigation and computing of Geoid Models mainly because of the increasing use of GNSS (Global Navigation Satellite Systems) technology. Besides, many geological and geophysical applications demand knowledge of the terrestrial gravity field. Basically, this demand is concentrated in engineering, mining and petroleum companies.
Recent gravity satellite campaigns represent a tool to improve several applications related to the gravity field modeling; moreover, they provide valuable information about the geodynamic behavior of our planet since they offer monitoring the temporal variations of the gravity field (Reigber et al., 2005; Rodell et al, 2007).
GRACE (Gravity Recovery And Climate Experiment) mission can map the mass distribution by measuring the changes in the Earth's gravity field. Most of the monthly gravity changes detected by this mission can be associated with the variations in terrestrial water storage, which includes hydrological reservoir changes, groundwater, soil moisture, lakes, streams, snow, ice and glaciers (Ramillien et al, 2005; Velicogna and Wahr, 2005, 2006). A few years ago, these studies were achieved from ground measurements, obtaining results of low precision and for small areas. Temporal and spatial variations of water storage in large areas (a river basin, a glacier, for example) are difficult to analyze from ground measurements because of its size. With the present development of technologies represented by GRACE mission it is possible to detect the monthly spatial changes in the distribution of water masses in these regions. Furthermore, GRACE can map water storage changes to a height of about 1 centimeter for areas ranging in size on the order of 400 km.
The La Plata Basin is one of the largest in the world, with an area of 3,100,000 km2, which is equivalent to the 17% of South America's surface. This basin covers 5 countries: Brazil (1,415,000 km2), Argentina (920,000 km2), Paraguay (410,000 km2), Bolivia (205,000 km2), and Uruguay (150,000 km2).
The main rivers in Argentina that are part of this hydrographic system are the Paraná (its basin is the largest one with an area of 1,510,000 km2 and a longitude of 4,000 km), Uruguay and Paraguay.
Also in the La Plata basin lies a large part of the second fresh groundwater reservoir of the world (the Guaraní Water-bearing System), thus the knowledge of its behavior is of extreme importance for being an important environmental, economic and strategic resource.
The Patagonia is located in the southernmost part of Argentina, between 40° and 56° of South latitude. This region is characterized by the presence of a big continental ice extension (the third greater of the world after the Antarctica and Greenland), located in the "Andes Patagónicos" in the border between Argentina and Chile. The continental ice extends throughout 350 km and 49 glaciers descend from them. In Argentina, they have an extension of 3,000 km2.
At present, GRACE data is a remarkable tool to study and quantify the variations related to climate change, like the regression of the glaciers in the south of Argentina and the water redistribution in the Paraná River basin and in the Guaraní Water- bearing System.
In this paper, the mass changes for Argentina obtained from different processing centers are shown and compared, analyzing the possible causes of the variations and showing that GRACE mission can actually detect the glaciological and hydrological changes.
Data and methods
Study area
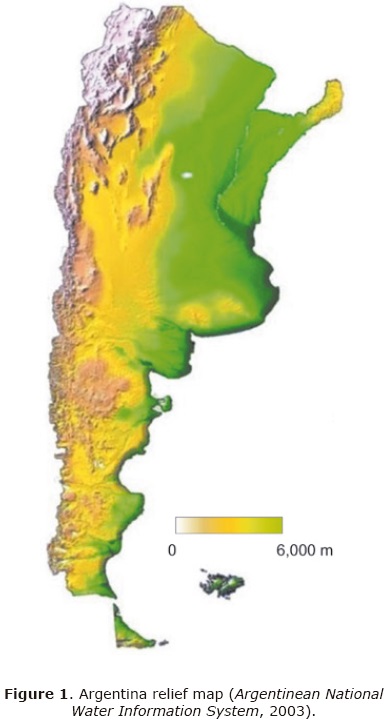
Argentina is the second largest country in South America, with an area of 2,766,891.2 km2, and is located between 20° and 56° South Latitude and 53° and 74° West Longitude. It comprises different geological and physiographical areas, presenting mainly plains at the eastern region, hills in the center and mountains at the West (Figure 1). The country is limited at its western extreme by the Andes Mountain chain. The physiography is diverse, with heights ranging from -100 to 7,000 m approximately; the highest point is located at Cerro Aconcagua with 6,962 m above sea level, and the lowest is at Laguna del Carbón (105 m below sea level).
The continental territory includes four major geological regions: the Patagonian massif -a Precambrian basement-; the Andes System -caused by the Andean bending-; the Brazilian massif -Precambrian basement-; and the Pampa Plain comprising marine and volcanic sediments (Gentili et al, 1980).
The major rivers in Argentina are the Paraná, Uruguay, Paraguay, Bermejo, Pilcomayo, Colorado, Salado and La Plata. Also, there are several lakes, like the Argentino and Viedma; and numerous reservoirs created by dams, like the Esteros del Iberá.
GRACE data
Before this new gravity satellite mission era, the long wavelength of the Earth gravity field was obtained from the tracking measurement of satellites orbiting our planet. These measurements had varied quality and quantity, and had a low geographical coverage density. Therefore, the accuracy and precision of the gravity models that had come up this way was limited and only the important geophysical features of the Earth's structure could be detected. But in the last few years, this scenario has changed and a great advance has been achieved concerning the knowledge of the terrestrial gravity field, thanks to the combined use of GPS (Global Positioning System) receivers, accelerometers and gradiometers.
The successful launching of CHAMP (CHAllenging Mini-satellite Payload) in 2001 and GRACE in 2002 marked the beginning of a new age in satellite gravimetry (Wahr et al., 1998; Beutler, 2004).
In the present investigation, the GRACE Level-2 data from four processing centers were analyzed and compared to determine the gravity trend and amplitude in Argentina for the period 2002-2008.
GRACE Level-2 data consists of monthly spherical expansions of the Earth's gravity field. Each solution is represented by a set of harmonic coefficients up to a defined order and degree (Bettadpur, 2007).
The data used in this investigation were provided by four processing centers: UTCSR (University of Texas, Center for Space Research), GFZ (GeoForschung Zentrum, Potsdam), JPL (Jet Propulsion Laboratory, NASA) and BGI (Bureau Gravimétrique International, France)1.
In this research, the following data were used: the released 4 (RL04) from UTCSR and GFZ, the release 4.1 from JPL, and the version 1 from BGI.
The CSR RL04 solutions are complete to degree and order 60 in terms of spherical harmonic expansions, the ones from GFZ RL04 and JPL RL04.1, to 120; and the data sets of the BGI, to 50.
The time period used in this study spans from January 2002 to December 2008. The data were filtered by truncating the coefficients at degree and order 30 and by doing the calculation at satellite altitude (500 km). This was made to allow a fair comparison and to reduce the uncertainties of the GRACE data in the higher order coefficients (Forsberg and Reeh, 2006; Sandberg Sørensen and Forsberg, 2010).
The time- variability of each set is represented by a sequence of 30 days approximately, except for the BGI solutions, where the data are provided every 10 days and are based on the running average of three 10-day periods (Lemoine et al., 2007, 2008). The resulting epochs for each center were 71 for UTCSR, 63 for GFZ, 70 for JPL and 202 for BGI. For the first three data sets, the months June- July of 2002 and June 2003 are missing due to the missing accelerometer data.
Method and results
In general, the trend, amplitude and phase of a time-dependent function can be defined as:
where b.t is the trend and it is represented by the slope of the function x(t); and a is the origin ordinate.
From (1) the amplitude A of the variable and its corresponding phase  would be:
Where

The first step is to determine the change of the monthly gravity fields, δg, in time, which is done by a 4-parameter trend analysis of the gravity disturbances. A bias (a), trend (b.t) and two yearly seasonal terms (c.cos t; d.sin t) are estimated in each grid point defined for Argentina, where the amplitude is a combination of c and d (3). The solutions were processed with software specially developed for GRACE by the National Space Institute, Technical University of Denmark. Finally, the gravity trend and amplitude for the 4 centers for the period from August 2002 to May 2008 were obtained (Forsberg and Reeh, 2006) with:

The resulting gravity trends (in µGal per year) and amplitudes (in µGal per year) at satellite altitude (500 km), based on the CSR, JPL, GFZ and BGI epochs respectively, are shown in Figures 2 and 3.
The gravity trend maps for Argentina from August 2002 to May 2008, given in µGal per year, from the data of the four processing centers are presented in Figure 2 (above).
The trend plots indicate some differences among the GRACE solutions, but they do agree on a negative trend over two regions, indicating a significant mass loss.
The first one is located in the Patagonian Ice Field. The mass changes detected in this area correspond with the water, ice and snow redistribution. The second one is located in the La Plata basin. In this area, the significant gravity trend variations are mainly related to seasons, drought and flood periods, and at inter-annual scales, with phenomena like El Niño and La Niña (Berbery and Barros, 2002).
Also in Figure 2 (below), the gravity trend profiles over the La Plata Basin and the Patagonia, from the data of the four processing centers, showing the maximum and minimum values reached for each center, are presented.
In Figure 3 (above) the gravity amplitude maps for Argentina from August 2002 to May 2008, given in µGal per year, from the data of the four processing centers, are shown. It can be detected an important gravity amplitude change in the middle-west part of Argentina, in coincidence with a region of large earthquakes. Gravity amplitude profiles over the central Andes Mountain chain, from the data of the four processing centers, are presented also in Figure 3 (below).
Analyzing the amplitude and trend maps and profiles, the solutions from the JPL is the one that always presents the greatest differences in relation to the others centers. The analysis centers follow different data pre-processing, processing and post-processing strategies, which cause differences in the sets of spherical harmonic coefficients (Klees et al., 2008).
The gravity trend and amplitude statistics can be found in Table 1, which shows that the amplitude ranges from a minimum of 0.040 (BGI) to a maximum of 3.149 (GFZ) µGal per year; and for the trend the values varies from -0.479 (BGI) to 0.281 (CSR) µGal per year.

These results show that the research in Argentina should be extended and the detected mass changes should be validated with hydrological and glacial models, climatic data (temperature, rainfall records) and satellite images series. Also, in a next stage, the variations detected will be estimated in km3/year of water equivalent.
Conclusions
Comparing the results obtained from the four processing centers, the JPL is the one that shows the highest differences for both trend and amplitude variables. The estimated trend and amplitude values are slightly different but the same pattern could be found in the results from the four processing centers, except for JPL amplitude. GRACE products differences are currently being studied in terms of resolution and pre-processing.
From the amplitude figures, an important variation can be seen in the Andes Mountain chain, in an area of oil exploitation and exploration, and also in the north part of the country.
It can be concluded from the analysis of the trend figures that significant mass changes could be detected in two areas in particular: the main one in the glaciers zone in the Patagonia, and the other one corresponding to the La Plata Basin.
There is a clear negative trend (maximum absolute value of 0.25 µGal per year approximately) in the La Plata Basin and another one at the Patagonian Ice Field (maximum absolute value of 0.63 µGal per year approximately). The first one can be related to the Paraná River behavior and the seasonal variations in the basin area that are being affected by extreme weather events. The second variation can be associated with the water, snow and ice redistribution, among others, and partly also by the climatic change that is generating a great regression and loss of mass in most of the Patagonian glaciers. Moreover, the connection between ice mass loss and postglacial rebound signal can be derived from that.
These patterns agree with other preliminary results that are still under study, like altimetry from ENVISAT and equivalent water change grids derived from NASA and GRGS- CNES (Andersen et al., 2008; Pereira, 2011; Pereira et al., 2012).
Acknowledgements
This paper was partially supported by PICT-01590 (ANPCyT).
Bibliography
Argentinean National Water Information System. Maps and data of Argentina. Available at <http://www.hidricosargentina.gov.ar/InformacionHidrica.html>. July 2003. [ Links ]
Andersen O., Berry P., Freeman J., Lemoine F.G., Lutsckhe S., Jakobsen F., Butts M., 2008, Satellite altimetry and GRACE gravimetry for studies of the annual water storage variations in Bangladesh. Terr. Atmos. Ocean. Sci., 19: 447-52. [ Links ]
Berbery E.H., Barros V.R., 2002, The hydrologic cycle of the La Plata Basin in South America. J. Hydrometeorology, 3:630-645. [ Links ]
Beutler G., 2004, Revolution in Geodesy and Surveying. FIG Article, July 2004, pp. 19. [ Links ]
Bettadpur S., 2007, Level-2 Gravity Field Product User Handbook (Rev. 2.3, February 20, 2007), Center for Space Research, University of Texas at Austin. [ Links ]
Forsberg R., Reeh N., 2006, Mass change of the Greenland ice sheet from GRACE. Proc. First Meeting of the International Gravity Field Service: Gravity Field of the Earth 2006, Springer Verlag. [ Links ]
Gentili C., Rimoldi H., Di Gregorio J., Ullana M., González Díaz E., Nullo F., Riccordi A., Rolleri E., Russo A., Fabres M., Di Benedetto H., Stepancic P., Methol E., Caminos R., Leste P., Perello R., Theabli W., 1980, Geología Regional Argentina. Vol I-II. Academia Nacional de Ciencias. [ Links ]
Heiskanen W.A., Moritz H., 1985, Geodesia Física. Ed. Instituto Geográfico Nacional- Instituto de Astronomía y Geodesia, Madrid. 371 pp. [ Links ]
Klees R., Liu X., Wittwer T., Gunter B.C., Revtova E.A., Tenzer R., Ditmar P., Winsemius H.C., Savenije H.H.G., 2008, A Comparison of Global and Regional GRACE Models for Land Hydrology. Survey Geophysics, 29: 335-359, doi: 10.1007/s10712-008-9049-8. [ Links ]
Lemoine J.M., Bruinsma S.L., Biancale R., 2008, 10-day gravity field solutions inferred from GRACE data. Proc. IAG International Symposium on Gravity, Geoid and Earth Observation 2008. [ Links ]
Lemoine J.-M., Bruinsma S., Loyer S., Biancale R., Marty J.-C., Perosanz F., Balmino G., 2007, Temporal gravity field models inferred from GRACE data. Advances in Space Research 39 (2007) 1620-1629, doi:10.1016/j.asr.2007.03.062. [ Links ]
Pereira A., 2011, Estudio comparativo de modelos de geopotencial y análisis geodinámico de las variaciones temporales del campo gravitacional para la Argentina. PhD thesis presented in the National University of Rosario, Argentina. [ Links ]
Pereira A., Miranda S., Pacino M.C., Forsberg R., 2012, Water storage changes from GRACE data in the La Plata Basin. IAG Series: Geodesy for Planet Earth 136 (2012) 613-618, doi: 10.1007/978-3-642-20338-1_75, - Springer Berlin Heidelberg Ed. [ Links ]
Ramillien G., Frappart F., Cazenave A., Güntner A., 2005, Time variations of land water storage from an inversion of 2 years of GRACE geoids. Earth and Planetary Science Letters, 283- 301. [ Links ]
Reigber C., Jochmann H., Wünsch J., Petrovic S., Schwintzer P., Barthelmes F., Neumayer K.-H., König R., Förste Ch., Balmino G., Biancale R., Lemoine J.-M., Loyer S., Perosanz F., 2005, Earth Gravity Field and Seasonal Variability from CHAMP. In: Reigber, Ch., Lühr, H., Schwintzer, P., Wickert, J. (eds.), 2004. Earth Observation with CHAMP - Results from Three Years in Orbit, Springer, Berlin, 25-30. [ Links ]
Rodell M., Chen J., Kato H., Famiglietti J.S., Nigro J., Wilson C.R., 2007, Estimating groundwater storage changes in the Mississippi River basin (USA) using GRACE. Hydrogeology Journal, 15: 159- 166. [ Links ]
Sandberg Sørensen L., Forsberg R., 2010, Greenland Ice Sheet Mass Loss from GRACE Monthly Models. Proc. IAG Symposium on Gravity, Geoid and Earth Observation, (135), Part 7, 527-532, doi: 10.1007/978-3-642-10634-7_70, Springer. [ Links ]
Torge W., 2001, Geodesy, 3a Edición. Ed. De Gruyter. 416 pp. [ Links ]
Velicogna I., Wahr J., 2005, Greenland mass balance from GRACE. Geophys. Res. Lett., doi: 10.1029/2005GL023955. [ Links ]
Velicogna I., Wahr J., 2006, Acceleration of Greenland ice mass loss in spring 2004. Nature, doi: 10.1038/nature05168. [ Links ]
Wahr J., Molenaar M., Bryan F., 1998, Time-Variability of the Earth's Gravity Field: Hydrological and Oceanic Effects and their possible detection using GRACE. J. Geophys. Res., 103, 30,205-30,230. [ Links ]
1 These solutions are now computed by the GRGS– CNES (Groupe de Recherche de Géodésie Spatiale, Centre National d'Études Spatiales, Tolouse).

