


Servicios Personalizados
Revista
Articulo
 Inglés (pdf)
 Artículo en XML
 Referencias del artículo
 Enviar artículo por email
Indicadores
-
 Citado por SciELO
 -
 Accesos
Links relacionados
-
 Similares en
SciELO
Similares en
SciELO
Compartir

 Permalink
Geofísica internacional
versión On-line ISSN 2954-436Xversión impresa ISSN 0016-7169
Geofís. Intl vol.51 no.1 Ciudad de México ene./mar. 2012
Original paper
A source study of the October, 2007 earthquake sequence of Morelia, Mexico and ground-motion estimation from larger earthquakes in the region
Shri Krishna Singh1*, Arturo Iglesias1, Victor Hugo Garduño1, Luis Quintanar2, and Mario Ordaz3
1 Instituto de Geofísica, Universidad Nacional Autónoma de México. Ciudad Universitaria Delegación Coyoacán, 04510 México D.F., México *Corresponding author: krishnamex@yahoo.com
2 Departamento de Geología y Mineralogía, Universidad Michoacana de San Nicolás de Hidalgo. Morelia, Michoacán México
3 Instituto de Ingeniería, Universidad Nacional Autónoma de México. Ciudad Universitaria Delegación Coyoacán, 04510 México D.F., México
Received: February 28, 2011;
accepted: June 7, 2011;
published on line: December 16, 2011
Resumen
En este artículo se analiza una secuencia de siete sismos (2.5<Mw<3.0) ocurridos en la Ciudad de Morelia, México. Esta serie de temblores ocurrieron en un intervalo de 33 horas en el mes de octubre de 2007. Fueron registrados por dos estaciones locales ubicadas en esa Ciudad. Morelia se encuentra en la la parte central de la Faja Volcánica Trans-Mexicana (CTMVB, por sus siglas en inglés). Las formas de onda y los espectros de estos sismos son sorprendentemente similares, sugiriendo que sus localizaciones y mecanismos focales son casi idénticos. La inversión de forma de onda, restringida a partir de fallas descritas anteriormente en el área (rumbo ~E-O, buzando al norte), arroja un mecanismo focal definido por φ=265º, δ=75º y λ=-30º, lo cual es consistente con los mecanismos focales reportados previamente en la región. Dado que, para estos pequeños eventos, la señal se confunde con el ruido para frecuencias f<0.2Hz, se estimó el momento sísmico M0 a partir del espectro de las ondas S en una banda de frecuencias definida en el intervalo 0.2≤f≤1Hz. Sin embargo, en esta banda de frecuencias, existe una amplificación significativa de las ondas símicas debida a una capa de baja velocidad provocada por rocas volcánicas superficiales presentes en cualquier sitio localizado en el CTMVB. En la estimación del M0 y en la interpretación de los espectros observados, se aproximó esta amplificación usando el cociente espectral H/Z. Asumiendo un modelo de fuente ω2, los espectros observados pueden ser explicados con ternas (Δσ, t*, fm (5MPa, 0.02s, 20Hz) y (20 MPa, 0.03 s, 20 Hz), donde Δσ es la caída de esfuerzos asumiendo el modelo de Brune y t* y fm son los parámetros de atenuación. Con el fin de simular el movimiento fuerte del terreno, para un sismo postulado de Mw5, se usaron estas combinaciones de parámetros junto con las técnicas de Empirical Green Function (EGF) y Random Vibration Theory (RVT). Las aceleraciones horizontales PGA y velocidades PGV en los sitios de referencia están en el rango de 23 a 46 cm/s2 y de 1.5 a 3.52 cm/s para una caída de esfuerzos de Δσ=5Mpa. Los valores pronosticados para una caída de esfuerzos Δσ=20Mpa son casi el doble (44-89 cm/s2 and 2.5-6.1 cm/s). Las estimaciones obtenidas, especialmente para Δσ=5MPa, son considerablemente más pequeñas que las reportadas a partir de datos globales. Esta comparación sugiere que existe una alta atenuación en la región volcánica o una inadecuada estimación del efecto de t* y fm.
Palabras clave: Estimación de movimientos fuerte para la Ciudad de Morelia, efectos de sitio en la faja Volcánica Trans-Mexicana, atenuación.
Abstract
We analyze an earthquake sequence of seven small events (2.5<Mw<3.0) which occurred in Morelia, Mexico during a 33-hour period in October, 2007 and was recorded by two local stations. Morelia lies in Central Trans-Mexican Volcanic Belt (CTMVB). The waveforms and spectra of the events are surprising similar, suggesting that their locations and focal mechanisms were nearly identical. Waveform inversion, with constraints imposed from mapped faults in the area (strike ~E-W, dipping to the north) yields a focal mechanism defined by φ=265º, δ=75º y λ=-30º, consistent with reported focal mechanisms in the region. For these small events, the signal is lost in the noise at f<0.2Hz. For this reason, we estimate seismic moment, M0 , from S-wave spectrum in the frequency band of 0.2≤f≤1Hz. Unfortunately, in this band significant amplification of seismic waves, caused by upper low-velocity volcanic rocks, is expected at all sites in the CTMVB. In the estimation of M0 and interpretation of the observed spectra, we approximate the amplification by H/Z spectral ratio. Assuming an ω2-source model, the observed spectra can be explained by the (Δσ, t*, f ) triplets of (5 MPa, 0.02 s, 20 Hz) and (20 MPa, 0.03 s, 20 Hz), where Δσ is the Brune stress drop, and t*and fm are attenuation parameters. We use these parameters and EGF and RVT techniques to simulate ground motions for a postulated Mw5 earthquake. The estimated horizontal PGAs and PGVs at the two sites inMorelia with Δσ=5MPa range between 23 and 46 cm/s2 and 1.5 and 3.52 cm/s, respectively. The predicted values are almost twice as large for Δσ=20MPa: 44-89 cm/s2 and 2.5-6.1 cm/s. Our estimated PGAs, especially that for Δσ=5MPa, are significantly smaller than those predicted from regression of world-wide data, suggesting either higher attenuation in this volcanic region and/or inadequate estimation of the site effect, and the attenuation parameters t*and fm.
Key words: Strong motion estimation for Morelia city, Site effects in Central Trans-Mexican Volcanic Belt, Attenuation.
Introduction
The Trans-Mexican Volcanic Belt (TMVB) is an E-W, Miocene to Quaternary, calc-alkaline volcanic arc related to the subduction of oceanic Rivera and Cocos plates below Mexico along the Middle America trench. TMVB is traversed by networks of faults that are nearly parallel and orthogonal to its axis (Pasquaré et al., 1987; Johnson and Harrison, 1990). The central part of the Trans-Mexican Volcanic Belt (CTMVB) is characterized by a 100-to-150 km-wide zone of Quaternary to active normal faults which are oriented E-W, with a left-lateral strike-slip component (e.g., Pasquaré et al., 1987; Suter et al., 1992, 1995a,b, 2001; Marquez et al., 1999) (Figure 1). The estimated horizontal extensional nd left-lateral slip rates across CTMVB along E-W-trending normal faults are 2 mm/year and less than 7 mm/year, respectively (Ego and Ansan, 2002). In the CTMVB, between 99ºW and 102ºW, Suter et al. (2001) report about 100 E-W-striking, normal faults which are >2 km in length. Of these faults, ~65 cut rocks <1.6 Ma old and ~22 are younger than 750 Ka. Although several for these faults have been studied in recent years, a detailed paleoseismological study is available only for the Acambay-Tixmadeje fault (Langridge et al., 2000).
Seismicity in the CTMVB is moderate. Due to sparse seismic network and complex crustal structure of the region, the earthquake locations are inadequate to map active faults and reliable focal mechanisms are available only for a few earthquakes. Furthermore, the scarcity of data has severely limited our capability to estimate ground motions from future earthquakes. As a consequence, seismic hazard from earthquakes in the CTMVB is very poorly known. This is an unfortunate since large earthquakes are known to occur in the region. An example is the Acambay earthquake of 1912 (M7.0), which caused severe damage in the epicentral area (Urbina and Camacho, 1913). The problem is compounded by the fact that several highly-populated cities are located in the CTMVB (e.g., Mexico City, Toluca, Morelia, Puebla).
In this context, an analysis of an earthquake sequence, which occurred in Morelia in October, 2007, is important as it provides useful information on the characteristics of earthquake sources in the CTMVB. The earthquakes were recorded at two local stations (Figure 2). We also take advantage of these recordings to estimate ground motion from a postulated local Mw5 earthquake in Morelia. Recurrence period of such an event is not known. Suter et al. (2001) report ~10 faults with Quaternary activity in the Morelia region. Morelia fault (also called La Paloma fault, e.g., Garduño-Monroy et al., 2009), which is 13 km long, has been active in Holocene time. Rupture of a small segment of this fault could give rise an Mw5 earthquake.
The Earthquake Sequence
The earthquake sequence began on October 16, 2007 at 09:46. A broadband seismographic station, MOIG, situated in the Morelia campus of UNAM, recorded seven earthquakes in a 33-hour period (Figure 2, Table 1). MOIG is a permanent station of the Mexican National Seismological Service (Servicio Sismológico Nacional, SSN) network. It is equipped with a Streckeisen STS-2 sensor and a Quanterra Q330 data logger recording at 100 sps in a continuous mode. Four of the earthquakes (events 4 to 7 in Table 1) also triggered an accelerographic station, STAM, located in the city. STAM is a temporary station operated by Universidad Michoacana de San Nicolás de Hidalgo. It is equipped with Kinemetrics K2 accelerograph. STAM recorded the earthquakes at 100 sps in a trigger mode.
MOIG and STAM are situated on ignimbrite which overlies severely fractured and altered andesite. The thickness of ignimbrite below STAM is ~180 m. This thickness below MOIG is not known. The waveforms of the earthquakes are remarkably similar to each other (Figure 3), as are their Fourier amplitude spectra (Figure 4). (S-P) times of the events at MOIG and STAM are 1.7 and 1.6 s, respectively. The waveform similarity and almost constant (S-P) time of the events imply that their locations and focal mechanisms are nearly identical. Iglesias et al. (in preparation) studied these common characteristics and, by using a multiplet coda-correlation technique, found that relative distances between events are between 50 to 350 m. For these reasons, we located only the event of October 17, 2007; 17:44. We estimated the seismic moment, M0, and the focal mechanism of this event. The moment of other events in the sequence were obtained by scaling the low-frequency level of the spectra.
P and S arrival times at MOIG and STAM along with the azimuths of the source were used in the location using the SEISAN code (Haskov and Ottemoller, 2001) and its hypoinverse module (Fred, 2000).
The crustal structure below Morelia is not known. In locating the earthquake, we employed a crustal model reported by Campillo et al. (1996). It consists of a three-layer crust (layer 1: α=5.1 km/s, h=5 km; layer 2: α=5.9 km/s, h = 12 km; layer 3: α=6.7 km/s, h=28 km). This 45-km-thick crust overlies a half space (α=7.95 km/s). We assumed a Poisson ratio of 1.78. We also tested a slightly modified model in which layer 1 was split in two: layer 1a with α=2.9 km/s, h=2 km, and layer 1b with α=5.1 km/s, h=3 km. Layer 1a is consistent with a relatively low-velocity, 2-km-thick layer reported below the Valley of Mexico (Havskov and Singh, 1977-78). The locations obtained from the two models are almost identical: 19.706ºN, 101.163ºW; H = 11.4 km. Computed distances from MOIG and STAM were ~ 9km and ~4 km, respectively. Table 1 gives a list of the seven events.
Cracks and faults, caused by subsidence due to extensive pumping of water, have been reported in Morelia. The depth of the earthquakes (11.4 km) suggests that they may not be related to the water depletion in the aquifer.
Focal mechanism
As mentioned earlier, the waveform similarity of the events at MOIG and STAM (Figure 3) suggests that the focal mechanisms of these earthquakes are almost the same. The first-motion data are available only at these two local stations. However, it is possible to obtain focal mechanism from waveform data at one or two local stations only (e.g., Kanamori et al., 1990; Singh et al., 2000). To determine the focal mechanism of the Morelia events, we performed waveform inversion of the displacements at MOIG and STAM for the 17 October, 17:44 event. In the inversion, we required that the solution be consistent with the first-motions and the reported fault orientation in the region (strike ~E-W, dipping towards north, Figure 1). For this reason, we restricted the azimuth, φ, and the dip, δ, of the fault to lie between 250º and 285º and 55º and 85º, respectively. The inversion assumes that the event may be approximated by a point-source shear dislocation. Synthetic seismograms include near- and intermediate-field contributions (Singh et al., 2000). The effect of the free surface is approximately taken into account by multiplying infinite-space synthetics by two. These approximations are reasonable, especially for SH wave, if the epicentral distance, Δ, is smaller than the depth, H. In our case, H is 11.4 km and Δ is 5 and 9 km to STAM and MOIG, respectively. The inversion yields a nodal plañe defined by φ=2650, δ=75º, and λ= -30º, and a seismic moment, M0 of 1.1x10¹⁴ N-m. This M0 is likely to be an overestimation since no correction for local site effect has been made (see later discussion). The focal mechanism is similar to the mechanism of the 22 February, 1979, mb=5.3, Maravatio earthquake (φ=2800, δ=66º, λ= -48º) reported by Astiz (1980). Figure 5 shows the fit between the observed and synthetic seismograms. S waves on radial and transverse components at MOIG are well fit by the synthetics. However, P wave on Z component is nodal in the synthetic waveform, while it is clearly compressional on the observed seismogram. We attribute this discrepancy to possible error in the location of the earthquake. The synthetics at MOIG are more sensitive than those at STAM to small changes in the azimuth of the source. At STAM, SH wave on transverse component and P wave on Z component are well fit, but the fit to Sv wave on radial and Z components is poor. In fact, SV pulses at STAM are not unipolar as would be expected from the simple infinite-space model. This underscores the inadequacy of the simple model used in generating the synthetics (Kanamori, 1990; Singh et al., 2000). It will require a detailed knowledge of the crustal structure to better model the observed high-frequency displacement pulses. This, as mentioned earlier, is lacking at present. The focal mechanism given above, while not well constrained from the seismograms, is consistent with mapped faults in the region.
Spectral study of the Morelia Sequence
Fourier amplitude spectrum of S-wave group of small and moderate earthquakes is often used to estimate seismic moment, M0, and stress drop, Δσ (Brune, 1970). The observed spectrum of small earthquakes, however, is strongly affected by near-surface attenuation and local site effect. The corrections for these effects at high frequencies are very poorly known. As a consequence, for small earthquakes, the estimation of corner frequency, fc, and, hence, Δσ, (which is computed from fc) is very uncertain. Even the estimation of M0 in the TMVB is problematic. For small earthquakes, low-frequency waves (f≤0.1 Hz), which may not be affected by local site effects, are dominated by ambient noise. Thus, one is forced to estimate M0 from spectral amplitudes at f≥0.2 Hz. At these frequencies large amplification of seismic waves is expected in the TMVB due to low-velocity, recent volcanic materials which comprise the upper-most layers. This amplification is reasonably well documented in the hill-zone of the Valley of Mexico (e.g., Singh et al., 1995). However, the information on local site effect is lacking in Morelia, as also in much of the TMVB. In the following, we will assume that ratio of spectrum of vertical component and horizontal component (H/Z) provides a first-order approximation to the site effect (Nakamura, 1989). Figure 6 illustrates H/Z spectral ratio at MOIG and STAM computed from the recordings of the October, 2007 sequence.
The Fourier acceleration spectral amplitude of the intense part of the ground motion at a station may be written as
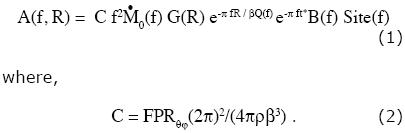
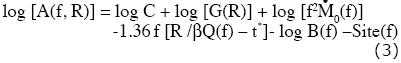
In equations above,  is the moment rate spectrum so that →M0 as f→0, R = hypocentral distance, Rθφ = average radiation pattern (0.55), F = free surface amplification (2.0), P takes into account the partitioning of energy in the two horizontal components (1/√2), (3= shear-wave velocity at the source (taken here as 3.4 km/s), r= density in the focal region (assumed 2.85 g/cm3), and Q(f) = quality factor, which includes both anelastic absorption and scattering. The attenuation in the near-surface layer and the finite bandwidth of the observed spectrum imposed by the sampling rate are accounted by the parameter t* (Singh et al., 1982; Anderson and Hough, 1984) and/ or the Butterworth filter, B(f) (Boore, 1983). We take B(f)=(1.0+(f/fm)**(8))**(-0.5). Site(f) in equation 3 is the local site effect. As mentioned above, we assume that it is given by H/Z spectral ratio shown in Figure 6. The geometrical spreading term, G(R), in equation (1) is taken as 1/R. Taking logarithm of equation (1) we obtain
We analyze the 17 October, 17:44 event in detail and invoke similarity of the waveforms and spectra (Figure 3 and 4) to determine the source parameters of other events listed in Table 1. Figure 7 illustrates observed median acceleration spectrum of the two horizontal components at MOIG and theoretical A(f) computed from equation 3. In the computation, we assume an w2-source and Ds values of 20 and 5 MPa. We tested many reasonable values of the (t*, fm) doublet. As Figure 7 shows, A(f) below 2 Hz is insensitive to the choice of (Δσ, t*, fm). The spectral level at f≤2 Hz requires M0 of 4.0x10¹³N-m (see left frames in Figure 7). If the site effect is well approximated by the H/Z spectral ratio, then this is the seismic moment of the 17:44 event. The seismic moments of the other 6 events, obtained from their relative low-frequency spectral levels with respect to that of the 17:44 event, are listed in Table 1. The moment magnitude, Mw, of the earthquakes listed in Table 1 ranges between 2.53 and 3.04.
The right hand frames in Figure 7 demonstrate that (Δσ, t*, fm) triplets of (20 MPa, 0.03 s, 20 Hz) and (5 MPa, 0.02 s, 20 Hz) reproduce equally well the observed A(f). Although the parameters of these triplets are reasonable, it is clearly possible to fit the observed spectrum with other values. Observed and computed A(f) at STAM are shown in Figure 8. Here M0 and the two triplets (Δσ, t*, fm) used in the calculations are the same that fit the MOIG spectrum of the 17:44 event. The fit is, relatively, poor; the observed median spectrum is lower than the computed one between 3 and 20 Hz (especially between 10 and 20 Hz) and higher below 3 Hz. Clearly, the near-surface attenuation and local site effect at STAM differ from those at MOIG. From Figures 7 and 8, and in common with many previous studies, we conclude that a reliable estimate of stress drop of small earthquakes is not possible unless attenuation of seismic waves at high frequencies is well known.
Ground-Motion Estimation in Morelia from a Local Mw5.0 Earthquake
The earthquake sequence of 2007 provides elements to estimate ground motions from future, postulated earthquakes in the city of Morelia. Below we estimate ground motions in Morelia from a scenario local earthquake of Mw5.0. As mentioned earlier, recurrence period of such an earthquake is not known. Nevertheless, Mw5 earthquake is a reasonable scenario event in Morelia in view of 10 mapped faults in the region and 13-km-long La Paloma fault which has been active in the Holocene (Suter et al., 2001). New building code of Mexico City also contemplates a local M5 earthquake (Rosenblueth et al., 1989). In the synthesis of the ground motion in Morelia, we will use techniques based on empirical Green's function and random vibration theory.
If the entire length of La Paloma fault were to rupture in one event, it could give rise to an Mw6.3 earthquake (see, e.g., Wells and Coppersmith, 1994). For such an earthquake, the far-field, point-source approximation would be grossly violated and alternative approaches would have to be employed for the synthesis of the ground motion.
(1) Empirical Green's Function (EGF) Technique
The recordings of the earthquake sequence may be used as EGFs to estimate ground motions in Morelia from local scenario earthquakes. We use the recordings of the 17 October 2007; 17:44 event (Table 1) as EGF to synthesize ground motions from a postulated Mw5.0 earthquake.
For the synthesis, we use a random summation scheme of EGF proposed by Ordaz et al. (1995). The method assumes that far-field and point-source approximations are valid. The summation scheme obeys the ω2-source scaling law at all frequencies and produces realistic time histories. The method requires specification of only the seismic moments and the stress drops of the EGF and the target events. We assume the same stress drop for the target and the EGF event. We consider two values of stress drop: 5 and 20MPa. Figure 9 shows observed horizontal geometrical mean PGA and PGV during the sequence and the synthesized values for postulated Mw4 and Mw5 earthquakes. We note that the PGA and PGV values are roughly two times greater for Δσ=20MPa than for Δσ=5MPa.
(2) Technique Based on Random Vibration Theory (RVT)
A powerful method to estimate ground motion, which is especially useful in regions with sparse earthquake recordings, is based on the application of random vibration theory (RVT) (Hanks and McGuire, 1981; Boore, 1983). In this method, the spectrum of the ground motion is related to the root-mean-square (rms) amplitude in the time domain through Parseval's theorem. The expected peak amplitude is obtained from the rms amplitude using results from random vibration theory (Cartwright and Longuet-Higgins, 1956).
As discussed earlier, the observed spectra during the Morelia sequence can be explained by an ω2-source model, 1/R geometrical spreading, whole-path Q given by Q(f)=98f0.72, local site effect shown in Figure 6 and (Δσ, t*, fm) triplet of (20MPa, 0.03s, 20Hz) or (5MPa, 0.02s, 20Hz) in equation 1. A further parameter needed is the effective duration of the ground motion, TR. TR is, often, taken as TR= fc-1+0.05R (Herrmann, 1985), where R is the hypocentral distance in km and fc is the corner frequency (Brune, 1970). We find that this relation underestimates TR for small earthquakes. For Morelia sequence, a more appropriate TR is given by TR= 3.0+fc-1+0.05R. Predicted horizontal PGA and PGV from RVT are shown by curves in Figure 9. As the computed spectrum with parameters listed above fits well the observed spectrum at MOIG of the 17:44 earthquake (and other earthquakes of the sequence as well), we expect the RVT predictions of PGA and PGV to be close to the observed ones at this station during the sequence. Figure 9 confirms this. For larger Mw, the RVT predictions from the two triplets differ. This is to be expected since the predicted spectra from the two sets of parameters also now differ. The results from EGF and RVT predictions are given in Table 2. We note that the predictions from the two techniques with the same Δσ are in reasonable agreement with each other. An exception is the PGV at STAM where EGF prediction is nearly twice that from RVT. This is a consequence of higher observed A(f) than the theoretical one at f<3 Hz (Figure 8). From Figure 9 and Table 2, the expected geometrical mean horizontal PGA and PGV at MOIG from a local Mw5 earthquake are 23 to 56 cm/s2 and 1.5 to 3.0 cm/s, respectively. The corresponding values at STAM are 32 to 89 cm/s2 and 1.6-6.1 cm/s, respectively.
It is useful to compare our predicted PGA values with those of Spudich et al. (1999) who derive a ground motion prediction relation for extensional tectonic regime that is valid for M≥5.5. An extrapolation of this relation predicts horizontal geometrical mean PGA of about 90 and 120 cm/s2 at MOIG and STAM, respectively for a M5 earthquake at the same focus as the 2007 sequence, assuming that these are hard rock sites. The corresponding values for soft sites are ~115 and 155 Gal. MOIG and STAM, which are situated above ignimbrite, would probably qualify as hard sites in Spudich et al.'s classification. Even for hard sites, our predictions are somewhat low. Low predictions from EGF technique may arise from the following causes: (1) Overestimation of M0 of the 17:44 event. If so, then a smaller number of EGF records have been used in the random summation, giving rise to smaller expected ground motions. An overestimation of M0 is possible because H/Z spectral ratio provides only a rough approximation to the local site effect. Furthermore, data from only two stations are available for the estimation of M0 which may result in a biased, overestimation. (2) The earthquake sequence involved smaller than "normal" stress drop and, hence, relatively small ground motions. This possibility does not seem likely as our choice of Ds=20 MPa is on the high side. Low PGA from RVT may result if the site effect is underestimated in some critical frequency band. Of course, low PGA from both EGF and RVT techniques may be simply a consequence of higher attenuation in the TMVB.
Discussion and Conclusions
Although a detailed knowledge of seismicity in the TMVB is critical to understand the seismotectonics and seismic hazard of the region, it is sorely lacking at present. This is because of few seismographs, relatively low seismicity, complex crustal structure, and significant local site effect in the región. As a result, reliable locations and focal mechanisms are available for only a handful of earthquakes. Furthermore, since Mw≥5 earthquakes are rare but important in seismic hazard estimation, the source characteristics of such earthquakes must be inferred from the study of small earthquakes in the region. Unfortunately, reliable estimation of source characteristics of small earthquakes in the TMVB still remains a challenging task. Morelia sequence of October 2007 provides an example of the difficulties faced in the analysis of small TMVB earthquakes.
The October 2007 earthquake sequence was recorded by two local stations. Hence, we could only confirm that the waveforms are consistent with known focal mechanisms in the region (φ=265º, δ=75º y λ=-30º). Amplification of seismic waves is expected in the TMVB due to low-velocity upper volcanic rocks. This amplification probably occurs at frequencies greater than about 0.2 Hz. Unfortunately, seismic moments of small TMVB events have to be determined at frequencies between about 0.2 and 1 Hz since the signal is lost in the noise at lower frequencies. Thus, unless the observed spectra are corrected for local site effect, the seismic moment is likely to be overestimated. This is true for all small earthquakes in the TMVB. For the Morelia sequence, we have assumed that Nakamura technique (i.e., H/Z spectral ratio) provides reasonable approximation of the local site effect. Based on this assumption, we have estimated the seismic moments of the events and, within the framework of ω2-source model and two values of stress drops, the attenuation parameters t* and fm. The chosen stress drops are 5 and 20 MPa. Stress drop of 5 MPa, which may represent a reasonable average value, yields (t* and fm) doublet of (0.02s and 20Hz). The corresponding doublet is (0.03s and 20Hz) when the unusually large stress drop of 20 MPa is chosen. In order to estimate ground motions in the epicentral region of a postulated Mw5.0 earthquake in the focal region of the October 2007 sequence, we have used EGF and RVT techniques assuming stress drops of 5 and 20MPa. The estimated horizontal PGA and PGV at the two sites in Morelia, for the stress drop of 5MPa, range between 23 and 46 cm/s2 and 1.5 and 3.52 cm/s, respectively. If we assume a stress drop of 20MPa, then the estimated values are almost twice as large: 44-89 cm/s2 and 2.5-6.1 cm/s (Table 2). Our estimated range of PGA, especially that corresponding to the stress drop of 5MPa, is significantly smaller than the predicted value of 90-120 cm/s2 at hard sites from world-wide, strong-motion, extensional-regime data (Spudich et al., 1999). The two possible explanations are: (1) Anomalously high attenuation along wavepaths from the sources to the sites in Morelia during the sequence (and, possibly, along all similar source/site paths in the TMVB). (2) Error in the estimation of local site effect (thus resulting in an underestimation of the seismic moment), and the attenuation doublet (t*, fm). We think (1) above is more likely but we can not reject (2) as the cause. Much more data from local earthquakes in the TMBV is needed to resolve this issue and to better understand the seismotectonics of the region.
Acknowledgements
We are grateful to F. Ego for providing us with PDF of a figure. The research was partially supported by DGAPA UNAM projects IN111411 and IN112411.
Bibliography
Astiz L.M., 1980, Sismicidad en Acambay, Estado de México. El temblor de 22 de febrero de 1979. B. S. thesis, Universidad Nacional Autónoma de México, Mexico City, 130 pp. [ Links ]
Anderson J.G., Hough S.E., 1984, A model for the shape of the Fourier amplitude spectrum of acceleration at high frequencies. Bull. Seism. Soc. Am.,74, 1,969-1,993. [ Links ]
Boore D.M., 1983, Stochastic simulation of high-frequency ground motions based on seismological models of radiated spectra. Bull. Seism. Soc. Am., 73, 1,865-1,884. [ Links ]
Brune J.N., 1970, Tectonic stress and the spectra of seismic shear waves from earthquakes. J. Geophys. Res., 75, 4,997-5,009. [ Links ]
Campillo M., Singh S.K., Shapiro N., Pacheco J., Herrmann R.B., 1996, Crustal structure south of the Mexican volcanic belt, based on group velocity dispersion. Geofís. Intern., 35, 361-370, 1996. [ Links ]
Cartwright D.E., Longuet-Higgins M.E., 1956, The statistical distribution of maxima of a random function. Proc. Roy. Soc. London, Ser. A., 237, 212-232. [ Links ]
Ego F., Ansan V., 2002, Why is the Central Trans-Mexican Volcanic Belt (102º - 99º W) in transtensive deformation? Tectonophysics, 359, 189-208. [ Links ]
Fred W.K., 2000, User's guide to HYPOINVERSE-2000, a Fortran program to solve for earthquake locations and magnitudes. USGS Open File Rept, pp. 2-171. [ Links ]
Garduño-Monroy V.H., Pérez-Lopez R., Israde-Alcantara I., Rodríguez-Pascua M.A., Szynkaruk E., Hernández-Madrigal V.M., García-Zepeda M.L., Corona-Chávez P., Ostroumov M., Medina-Vega V.H., García-Estrada G., Carranza O., López-Granados E., Mora Chaparro J.C., 2009, Paleoseismology of the southwestern Morelia-Acambay fault system, central Mexico. Geofís. Intern., 48, 319-335. [ Links ]
Hanks T.C., McGuire R.K., 1981, The character of high-frequency strong ground motion. Bull. Seism. Soc. Am., 71, 2,071-2,095. [ Links ]
Havskov J., Singh S.K., 1977-78, Shallow crustal structure below Mexico City. Geofís. Intern., 17, 223-229. [ Links ]
Haskov J., Ottemoller L., 2001, Seisan, the earthquake analysis software, University of Bergen, Norway, pp. 25-40. [ Links ]
Herrmann R.B., 1985, An extension of random vibration theory estimates of strong ground motion at large distances. Bull. Seism. Soc. Am., 75, 1,447-1,453. [ Links ]
Kanamori H., Mori J., Heaton T.H., 1990, The 3 December 1988, Pasadena earthquake (ML=4.9) recorded with the very broadband system in Pasadena. Bull. Seism. Soc. Am., 80, 483-487. [ Links ]
Johnson C.A., Harrison C.G.A., 1990, Neotectonics in central Mexico. Phys. Earth Planet. Int., 64, 187-210. [ Links ]
Langridge R.M., Weldon R.J., Moya J.C., Suarez G., 2000, Paleoseismology of the Acambay earthquake and the Acambay-Tixmadejé fault, Trans-Mexican Volcanic Belt. J. Geophys. Res., 105, 3,019-3,037. [ Links ]
Marquez A., Verma S.P., Anguita F., Oyarzun R., Brandle J.L., 1999, Tectonics and volcanism of Sierra Chichinautzin: extension at the front of the central TMVB. J. Volcanol. Geotherm. Res., 93, 125-150. [ Links ]
Nakamura Y., 1989, A method for dynamic characteristics estimation of subsurface using microtremor on ground surface. QR-RTR1, 30, 1, February. [ Links ]
Ordaz M., Arboleda J., Singh S.K., 1995, A scheme of random summation of an empirical Green's function to estimate ground motions from future large earthquakes. Bull. Seism. Soc. Am., 85, 1,635-1,647. [ Links ]
Pasquaré G., Vezzoli L., Zanchi A., 1987, Morphological and structural model of Mexican Volcanic Belt. Geofís. Int., 26, 159-176. [ Links ]
Rosenblueth E., Ordaz M., Sánchez-Sesma F.J., Singh S.K., 1989, Design spectra for Mexico's Federal District. Earthquake Spectra, 5, 258-272. [ Links ]
Singh S.K., Apsel R., Fried J., Brune J.N., 1982, Spectral attenuation of SH-wave along the Imperial fault. Bull. Seism. Soc. Am., 72, 2,003-2,016. [ Links ]
Singh S.K., Quaas R., Ordaz M., Mooser F., Almora D., Torres M., and R. Vásquez , 1995. Is there truly a "hard" site in the Valley of Mexico? Geophys. Res. Lett., 22, 481-484. [ Links ]
Singh, S.K., Ordaz M., Pacheco J.F., Courboulex F., 2000, A simple source inversion scheme for displacement seismograms recorded at short distances. J. Seismology, 4, 267-284. [ Links ]
Singh S.K., Iglesias A., García D., Pacheco J.F., Ordaz M., 2007, Q of Lg waves in the Central Mexican Volcanic Belt, Bull. Seism. Soc. Am., 97, 1,259-1,266, 2007. [ Links ]
Spudich P., Joyner W.B., Lindh A.G., Boore D.M., Margaris B.M., Fletcher J.B., 1999, SEA99: A revised ground motion prediction relation for use in extensional tectonic regime, Bull. Seism. Soc. Am., 89, 1,156-1,170. [ Links ]
Suter M., Quintero O., Johnson C.A., 1992, Active faults and state of stress in the central part of the TMVB, Mexico: 1. The Venta de Bravo fault. J. Geophys. Res., 97, 11,983-11,993. [ Links ]
Suter M., Quintero-Legorreta O., López-Martínez M., Aguirre-Díaz G., Farrar E., 1995a, The Acambay graben: active intra-arc extension in the TMVB, Mexico. Tectonics, 14, 1,245-1,262. [ Links ]
Suter M., Martínez M.C., López-Martínez M., Farrar E., 1995b, The Aljibes half-graben-active extension at the boundary between the TMVB and the Basin and Range province, Mexico. GSA Bull., 107, 627-641. [ Links ]
Suter M., López-Martínez M., Quintero Legorreta O., Carrillo-Martínez M., 2001, Quaternary intra-arc extension in the central Trans-Mexican Volcanic Belt. GSA Bulletin, 113, 693-703. [ Links ]
Urbina F., Camacho H., 1913, La zona megaseísmica Acambay-Tixmadejé. Estado de México, conmovida el 19 noviembre 1912. Bol. Inst. Geol. Méx., 32, 125 pp. [ Links ]
Wells D.L., Coppersmith K.J., 1994, New empirical relationship among magnitude, rupture length, rupture width, rupture area, and surface displacement, Bull. Seism. Soc. Am., 84, 974-1,002. [ Links ]

