


Servicios Personalizados
Revista
Articulo
 Inglés (pdf)
 Artículo en XML
 Referencias del artículo
 Enviar artículo por email
Indicadores
-
 Citado por SciELO
 -
 Accesos
Links relacionados
-
 Similares en
SciELO
Similares en
SciELO
Compartir

 Permalink
Geofísica internacional
versión On-line ISSN 2954-436Xversión impresa ISSN 0016-7169
Geofís. Intl vol.51 no.1 Ciudad de México ene./mar. 2012
Original paper
Structures and petroleum prospects of the Saramaguacán basin, Cuba, from 3D inversion of gravimetric data
José Batista Rodríguez*1, Jesús Blanco Moreno2, Marco Pérez-Flores3 and Alina Rodríguez Infante4
1 College of Engineering Universidad Autónoma de Coahuila, Blvd. Adolfo López Mateos S/N, Nueva Rosita. Coahuila, México. Department of Geophysics Centro de Investigación Científica y de Educación Superior de Ensenada Baja California - CICESE Baja California, México *Corresponding author: jabatistar@yahoo.com
2 Department of Geology, Instituto Superior Minero Metalúrgico de Moa - ISMMM Las Coloradas Moa Holguín, Cuba Email: jblancoismm@edu.cu
3 Department of Geophysics, Centro de Investigación Científica y de Educación Superior de Ensenada Baja California - CICESE Baja California, México Email: mperez@cicese.mx
4 Department of Geology, Instituto Superior Minero Metalúrgico de Moa - ISMMM Las Coloradas Moa Holguín, Cuba
Received: October 5, 2010;
accepted: October 10, 2011;
published on line: December 16, 2011
Resumen
Se presentan nuevas particularidades estructurales de la cuenca Saramaguacán, Cuba, a partir de la inversión 3D de datos gravimétricos, constreñidos por información de pozos y geología de superficie. Esas particularidades muestran una tectónica compleja de procesos de cabalgamiento, revelando el esquema estructural más probable dentro de la cuenca, el cual indica estructuras en formas de rampa y plataforma, así como la ubicación y geometría de la cuenca y varias sub-cuencas. También se conocen las ubicaciones y comportamiento en profundidad de las principales fallas, y se sugieren posibles nuevas fallas. A las diferentes formaciones rocosas se le determinaron las variaciones de su geometría, profundidad y espesor. Esta determinación posee particular importancia para las rocas sedimentarias (rocas colectoras) y las rocas del paleomargen (rocas madres) porque constituye la base para futuras investigaciones orientadas a seleccionar los mejores sitios para ubicar las perforaciones petroleras y calcular el volumen de hidrocarburo que pueden almacenar las rocas colectoras. Ambos grupos de rocas son potenciales para la prospección petrolera. A 4 km de profundidad se localizaron las rocas madres del sistema petrolero cubano, asociadas a las rocas carbonatadas del paleomargen. Las rocas colectoras alcanzan 10 km de profundidad. El modelo 3D obtenido apoya la hipótesis de un emplazamiento tectónico de sur a norte de las ofiolitas y las rocas volcánicas cretácicas, sobre las secuencias terrigenous-carbonatadas del paleomargen de Bahamas. Las particularidades estructurales mostrada por el modelo constituyen indicadores de la tectónica compresiva que originó la cuenca Saramaguacán en el Mesozoico-Terciario. También indican que la cuenca Saramaguacán posee condiciones favorables para la preservación de petróleo.
Palabras clave: teoría inversa, anomalías gravimétricas y estructura de la Tierra.
Abstract
New structural details of the Saramaguacán basin in central Cuba are presented, based on 3D inversion of gravimetric data constrained by wells and surface geology information. The basin shows complex tectonics of the overthrust process. A probable structural analysis of the basin suggests structures of ramp and shelf, as well as the location and geometry of the basin and several sub-basins. Known location and behavior of fault depth suggests some possible new or unknown faults. Geometry variation, depth and thickness were determined for different rock formations. This has great importance for the sedimentary (oil-bearing) and paleomargin (oil-source) rocks, because it is the basis for future research to select the best sites for drilling, as well as a broad estimate calculation of hydrocarbon volume that can be stored in the oil-collector rocks. Both groups of rocks are potential targets for oil prospecting. The oil-source rocks of the Cuban system were found to be around 4 km depth. They are associated with carbonated rocks of the Paleomargin. The oil-bearing rocks reache a depth of 10 km. The 3D model obtained supports the hypothesis that the ophiolites and the Cretaceous volcanic arc rocks were tectonically emplaced from south to north, on top of carbonate-terrigenous sequences from the Bahamas paleomargin. The model shows elements of the compressive tectonics that originated the Saramaguacán basin in the Mesozoic-Tertiary. It also suggests that the Saramaguacán basin presents favorable geologic conditions for oil deposits.
Key words: inverse theory, gravity anomalies and Earth structure.
Introduction
The Cuban territory is a folded belt, faulted and overthrusted on top of the North America passive paleomargin. This structure takes place at the contact between the North American and the Caribbean plate with oblique convergent motions (Mann et al., 1995), that allows the creation of a foreland basin system with a complex geometry, sedimentation and evolution from Late Campanian to Late Eocene, covered by less deformed Oligocene-Miocene sequences (Blanco and Proenza, 2000). These are favorable conditions for oil accumulation and storage (Blanco, 1999).
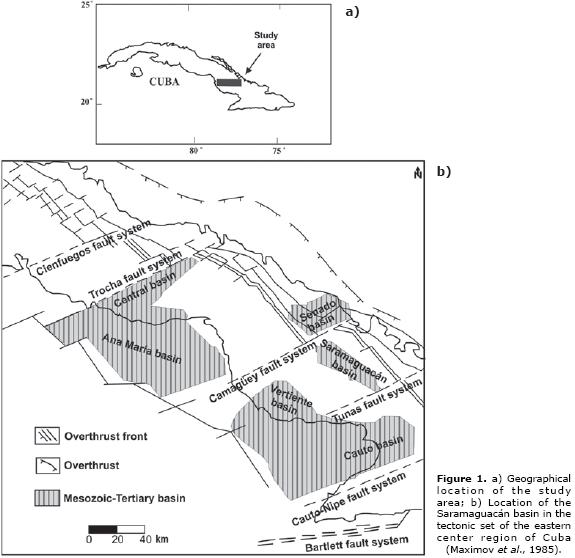
The Saramaguacán basin is located in Central Cuba (Figure 1), north of the granitoid belt of Camagüey County (Figure 2). It is bounded by ophiolitic rock sequences to the west. The basement consists of volcanic island arc rocks of Cretaceous age (Iturralde-Vinent and Thieke, 1986; Iturralde-Vinent et al., 1981). According to geophysical data (gravimetric and seismic), the basin is 10 km deep (Martínez et al., 1998; Blanco et al., 2000). Several geologic and geophysical investigations have been carried out for oil prospecting without conclusive data about the characteristics of the geological structures underground.
Using 3D inversion of gravimetric data it is possible to determine sedimentary basin shapes and limits, lithology depth and thickness as well as the location and extension of fault systems (Gallardo et al. 2003, 2005; Pérez-Flores et al., 2004; Batista et al., 2007). New structural features of the rock sequences in the Saramaguacán basin are obtained from 3D inversion of gravimetric data, with the method developed by Gallardo et al. (2003). The results yield information about deep structures, their link with oil-source and oil-collector rocks, and their distribution throughout the area. The results obtained by this technique should be very important to get relevant information about the Bahamas paleo-continental shelf, where the main oil-source rocks from the Cuban oil system are located (López-Rivera and López-Quintero, 2004; Magnier et al., 2004; Domínguez and López-Quintero, 2005).
Geologic setting
Two tectono-stratigraphic units constitute the Saramaguacán basin. The lower unit of Mesozoic-Early Tertiary age is characterized by a blanket-form folded structure, while the upper unit is a sedimentary sequence of Late Cenozoic age (Blanco, 1999). Both units have different tectonic characteristics (Figure 2).
Inside the Saramaguacán basin, Durán and Presa Jimaguayú Formations outcrop as a poly-mictic sand-gravel conglomerate of carmelite color with tuff clasts, volcanogenic rocks, serpentinites and gabbros. These rocks lay discordantly over Cretaceous vulcanites and granitoids belonging to the volcanic arc. The youngest rocks underlay discordantly Paleocene olistostrome sequences. Concerning the Eocene Formations, Saramaguacán and Maraguán units discordantly cover the latest geological units, as shown in Figure 3. These rocks consist of a sand-sandstone polymictic sequence with sporadic oblique interbedding, including conglomerates and polymictic gravelites.

The Saramaguacán basin presents facies varying from conglomérate to flyschoid with sedimentary environment from marine to continental. Sediments originate mainly from erosion of the Cretaceous volcanic sequences and ophiolites (Iturralde-Vinent, 1996). To the north, northwest and west of Saramaguacán basin these are outcrops of Cretaceous volcanic and carbonated rocks, as well as ophiolites and acid intrusives. In general, the group of sedimentary rocks that overlies the Cretaceous volcanic rocks has potential to collect oil (oil-collector rocks; Blanco, 1999). The volcanic rocks overlie ophiolitic rocks overlying limestones and marls belonging to the Bahamas paleomargin of Upper Jurassic and Lower Cretaceous age. These latter rocks are considered the main oil-source rocks in the Cuban oil system.
Tectonics of the Saramaguacán basin
The Saramaguacán basin is a synform structure with an axis SE-NW direction similar to a hemigraben according to seismic data. It is limited by a regional deep fault in the northern and southern part (Figure 4; Martínez et al., 1998).
The fault systems show SW-NE and SE-NW direction (Figures 1, 2 and 4), matching the Cuban tectonic pattern (Puscharovskiy et al., 1989). Stretching faults appear as well as deep vertical and strike-slip faults belonging to the Camagüey fault zone. The Saramaguacán basin is defined as a tensional basin developed from the stress of the Camagüey strike-slip fault system, producing a block system at different depths and making a set of small sub-basins (Blanco, 1999).
Methodology and data
Bouguer gravity anomalies were obtained from a 1:50,000 scale survey with 5812 measuring points and 0.051 mGal accuracy measured in a geologic cartography campaign in the CAME III Camagüey polygon (Iturralde-Vinent and Thieke, 1986). These data cover an area of approximately 1,600 km2 in central and northern Camagüey county. The Bouguer reduction was performed assuming a density of 2.6 g/cm3.
The 3D inverse process used the surface geology as constraints (Albear et al., 1988), plus the Pontezuela 1 well data (Álvarez-Castro et al., 1995). Topography correction was not necessary because the área is almost fíat and near sea level. The well was associated with a prism, and the thickness of the lithological groups traversed by the well during the inverse process remained unchanged. The surface geology, according to the geological map, was considered in the prisms of the first group and was not changed during inversion.
Details about the 3D inversion can be found in Gallardo-Delgado et al. (2003) and Gallardo et al. (2005). The ground is discretized in layers of rectangular prisms. Every layer is a rectangular conglomerate of prisms, simulating one rock formation; density or density contrast remain constant in the whole set of layer prisms. The horizontal section of every prism could be rectangular and the shape is maintained constant at all the prisms. In that way, it is possible to compute which prism is on the left side or the bottom of each. The top depth of every prism fits the top topography of such a layer. The bottom of every prism is the corresponding bottom topography of that layer. In this research, we needed five layers with five different densities or density contrasts. Every layer is constituted of a set of rectangular prisms. The inverse process computes the top and bottom tridimensional topography for every rock formation through the calculation of the top and bottom depth for every single prism in every layer: a huge amount of calculations. The process is non-linear and converges iteratively. After convergence criteria are fulfilled we get the top and bottom depth for every prism. A smoothing parameter is added to the objective function: it works with the spatial derivatives of the prism depths. A large value yields a very smooth topography for every layer; small parameters yield very rough layers. We tried several parameters but we selected a smooth solution, so that large topography deflections will be avoided. The actual deflection could be seen only if the data are sensible to them. Those deflections could be caused by faults.
A smoother parameter gives us some confidence that such deflections exist and that the faults also exist. The use of quadratic programming (Gill et al., 1986) allows us to add constraints to the prism depth estimation. Surface geology is introduced in the algorithm through those constraints. Forexample, if one part of the third layer prisms outcrops, we force the first and second layer prisms to collapse to zero thickness in order to allow such an outcropping. Well log information can be easily added. The more additional information we add, the easier and faster is the inversión process to find the optimal solution.
First we analyzed densities (r) for the different lithologies in the survey area (Iturralde-Vinent and Thieke, 1986). After the density analysis and considering the stratigraphic position of these lithologies, we selected five groups of rocks (Figure 2) with average values of densities according their lithologies. Group 1: sedimentary rocks (ρ =2.35 g/cm3), Group 2: volcanic rocks (ρ=2.61 g/cm3), Group 3: acid rocks intrusive complex (ρ =2.7 g/cm3), Group 4: ophiolitic rocks (ρ =2.46 g/cm3), Group 5: paleomargin rocks (ρ =2.5 g/cm3).
We assigned an average density values to each lithology representing the five groups of rocks used at this research. Group 1 is dominated by limestone, marl, calcareous sandstone, as well as breccias and polymictic conglomerates. Group 2 or volcanic rocks, consists mainly of basalts, andesites and diabases. Group 3 or acid rocks are represented by quartzite and granodiorite. Group 4 or ophiolites are gabbros and peridotites, the latter with a high serpentinization degree, which leads to low density values. Group 5 presents mainly limestone, dolomite, dolomitized and clayed limestone.
The study area was gridded into 360 prisms. Every prism area was 3x3 km2. Minimum and maximum thicknesses for every prism were established according to previous geological and geophysical studies (Iturralde-Vinent et al., 1981; Iturralde-Vinent and Thieke, 1986). These geological and geophysical studies suggest thickness up 10 km for the group 1, likewise, 5 km for group 2, 4 km for group 3 and 4.
After running the 3D iterative inversion program, a comparison between gravity data and response was done. For a better understanding of the 3D model, we made several cross-sections.
Results
Some minimums separated by relative highs are observed on the gravimetric map, suggesting sub-basin locations inside the main basin (Figure 5a). TowardtheSEofthebasin, a minimum of -45 mGal (Letter A) is located indicating the largest thickness of the sedimentary rocks (oil-collector rocks) and also the depocenter of the Saramaguacán basin. The latter was also suggested by seismic surveys (Martínez et al., 1998).
After 20 iterations during 80 minutes the following model was obtained, with a misfit of 3.2% suggesting an excellent fit to the data (Figure 5b).
The most important oil-source rocks in Cuba are related to the Bahamas paleomargin (López-Rivera and López-Quintero, 2004; Magnier et al., 2004; Domínguez and López-Quintero, 2005) that outcrops northward of the Saramaguacán basin (Figure 2) and reach 10 km depth within the Saramaguacán basin, according to 3D model obtained (Figure 6). Ramp and shelf is the typical morphology (Figure 7), getting closer to the surface northeastward (< 4 km). Paleomargin and the ophiolites rocks show large variations at depth. These structural variations match with the deep drilling oil holes in Varadero (Cuba oil producing area) and northward Camagüey (Blanco, 1999).
Analyzing the thickness map for the sedimentary rocks (Figure 6a), the cross sections (Figure 7) and the 3D drawing (Figure 8), we can infer that the potential oil-collector rocks (group 1: sedimentary rocks) reach 10 km of depth.
Their, thickness was not reached by previous drill holes in the Saramaguacán and Maraguán formations (Martínez et al., 1998). This 10 km thickness is in agreement with seismic (Martínez et al., 1998) and gravimetric profiles (Blanco et al., 2000).
Cross-sections show ophiolites and paleomargin rocks at the crests (Figure 7; cross-section 4), excepting volcanic rocks for cross-section 1 (Figures 7 and 8). Cross-sections show that structural crests of volcanic rocks, limiting the sub-basins, are in discordant contact with the Cretaceous-Tertiary sedimentary sequences. Other basins present similar features and tectonic development (e.g., the Central Basin of Cuba) and are considered as potential oil targets fordrilling (Blanco, 1999).
Knowledge of the lateral variations of the depth and thickness of oil-source and oil-collector rocks allows us to decide the best sites for future oil drilling and to conduct a preliminary estimation of the hydrocarbon volume that can be stored by the oil-collector (considering that this has favorable characteristics as; porosity and permeability for the whole thickness).
The cross-sections in the 3D model were done in SW-NE and SE-NW direction (Figure 7), trying to cut the faults perpendicularly. This fault behavior is due to the oblique collision and strike-slip faulting that began in the Maastrichtian (Late Cretaceous) time (Mann et al., 1995; Iturralde-Vinent, 1996). The geometry of the rock groups show slope changes that can be related with the observed faults on the surface. Other faults are inferred as new or not reported previously (Figures 7 and 8).
Ophiolites outcrop NE of cross-section 4 (Figure 7) and reach 9.7 km depth at southwards with 4 km as maximum thickness. Ophiolites are shown over the passive paleomargin, thanks to the inverse paleo-faults producing overthrusting (Pindell et al., 2006). Therefore, the shape of the ophiolites bodies are related with this process.
The structural relations between the different rock groups are inferred from the cross-sections analysis, confirming a compressive tectonic process that produced the south to north emplacement of the ophiolites and Cretaceous volcanic arc rocks over the passive paleomargin during the Mesozoic-Tertiary time.
The main results obtained from the analysis of the 3D model include the limits of the Saramaguacán basin, the sub-basins location and their maximum depths as shown in Figure 9.
Conclusions
New structural features of the Saramaguacán basin were obtained based from 3D inversion of gravimetric data. The depocenter depth and thickness for the different rock groups were also determined. The cross-sections show the tectonic complexity of the overthrust process, revealing structures of ramp and shelf, as well as the location and geometry of the sub-basins and depths of the probable oil-collector rocks. It is very important to know the lateral variation with depth of the oil-source (Paleomargin rocks) and oil-collector (sedimentary rocks) rock, for the later one, it will be important to know the thickness to support future research to locate oil drilling and oil volume to calculate that could be stored by the oil-collector rocks. Evidence was obtained for the compressive tectonics that originated the Saramaguacán basin in the Mesozoic-Tertiary. The 3D model supports the hypothesis concerning south to north tectonic emplacement of the ophiolites and Cretaceous rocks over the carbonate-terrigenous sequences from the Bahamas paleomargin. The basin limits, its structural scheme and the more probable inside stratigraphy were determined. The contact relations between volcanic, intrusive, ophiolites and paleomargin rocks obey the faulting originated along the push, tectonic transport, and isostatic equilibrium process. In cross sections and isometric diagrams indicate the location and behavior of the fault depth and the possible presence of new or unknown faults. It is important to identify the source rocks (carbonates from paleomargin) at depths lower than 4 km. The Saramaguacán basin exhibits favorable geologic conditions for oil preservations.
Acknowledgments
We thank Esthenis Martínez Rojas for the well records and geophysical data used in this research. Financial support was granted to the principal author through a scholarship from CONACYT.
Bibliography
Albear J., Boyanov I., Brezsnyanszky K., Cabrera R., Chejovich V., Echevarría B., Flores R., Formell F., Franco G., Haydutov I., Iturralde-Vinent M., Kantchev I., Kartashov I., Kostadinov V., Millán G., Myczynski R., Nagy E., Oro J., Peñalver L., Piotrowska K., Pszczolkowski A., Radoczj J., Rudnicki J., Somin M.L., 1988, Geological map of Cuba, Scale 1:250 000, Cuba Academy of Sciences and Institute of Geology and Paleontology. [ Links ]
Alvarez-Castro J., Otero R., Valladares S., García R., López J.O., Cruz R., Villavicencio B., Sánchez-Arango J., 1995, Geological Characterization Block 14-15. CEINPET file, Havana, Cuba. [ Links ]
Batista J., Pérez-Flores M.A., Quiroga-Goode G., Gallardo L.A., 2007, Geometry of ophiolites in Eastern Cuba from 3D inversion of aeromagnetic data, constrained by surface geology. Geophysics, 72, (3), May-June, B81-B91. [ Links ]
Blanco J., 1999, Stratigraphy and paleogeography of piggyback basins eastern Cuba Center. PhD. Thesis, Dept. of Geol., Instituto Superior Minero Metalúrgico de Moa, Cuba. [ Links ]
Blanco J., Batista J., Riverón B., 2000, Structure of the foreland basin in the suture zone in the region Esmeralda, Minas, Camaguey province according to gravity data. Paper presented at 1st. Cuban Congress of Geophysics. Cuban Society of Geology. [ Links ]
Blanco J., Proenza J., 2000, Tectonostratigraphic Systematization of central-eastern Cuba. Minería y Geología, 3, (1), 35-45. [ Links ]
Domínguez Z., López-Quintero J.O., 2005, Geochemical characterization of crude Cubans: classification based on saturated biomarkers. Paper presented at III Brazilian Congress P & D in Oil and Gas. [ Links ]
Gallardo L.A., Pérez-Flores M.A., Gómez-Treviño E., 2005, Refinement of three-dimensional multilayer models of basins and crustal environments by inversion of gravity and magnetic data. Tectonophysics, 397, 37-54. [ Links ]
Gallardo-Delgado L.A., Pérez-Flores M.A., Gómez-Treviño E., 2003, A versatile algorithm for joint 3- D inversion of gravity and magnetic data. Geophysics, 3, (68), 1-11. [ Links ]
Gill P., Hammarling S., Murray W., Saunders M., Wright M., 1986, User's guide for LSSOL: A package for constrained linear least-square and quadratic programming: Stanford Univ. Tech. Report SOL-886-1. [ Links ]
Iturralde-Vinent M., Tchounev D., Cabrera R., 1981, Geology of the territory Ciego-Camagüey-Las Tunas: the results of scientific research and geological mapping at 1:250 000. Technical Report. Academy of Sciences of Cuba and Bulgaria. ONRM. Havana. [ Links ]
Iturralde-Vinent M., Thieke H., 1986, Final report on the results of complex geological survey and accompanying search at 1:50 000 in the polygon CAME III, Camagüey. Technical Report. Havana. [ Links ]
Iturralde-Vinent M., 1996, Introduction to Cuban geology and geophysics. In: Ophiolites and volcanic arcs of Cuba. Iturralde-Vinent, M. (ed.) Miami. Florida: 83-120. [ Links ]
López-Rivera J.G., López-Quintero J.O., 2004, The Main Scenarios for Petroleum Exploration in the Southeastern Part of the Gulf of Mexico. Paper presented at AAPG International Conference. Mexico. [ Links ]
Magnier C., Moretti A.I., López-Quintero J.O., Gaumet F., López J.G., Letouzey J., 2004, Geochemical characterization of source rocks, crude oils and gases of Northwest Cuba. Marine and Petroleum Geology, 21, (2), 195-214. [ Links ]
Mann P., Taylor F., Lawrence E., Ku T., 1995, Actively evolving microplate formation by oblique collision and sideway motion along strike-slip faults: An example from the northeastern Caribbean plate margin. Tectonophysics, 246, 1-69. [ Links ]
Martínez E., Sorá A., García R., 1998, The geological-structural portion of the Basin Western Central California according to geophysical data. Paper presented at Geology and Mining '98. Volume 1. CNIG. Institute of Geology and Palaeontology (ed.). Cuba: 404-407. [ Links ]
Maximov S.P., Shein V.S., Furrazola-Vermúdez G., 1985, Tectonic map of Cuba. 1:500 000. 4 sheet (ed.) ICGC. Cuba. [ Links ]
Pérez-Flores M.A., Suárez-Vidal F., Gallardo L.A., González A., Vázquez R., 2004, Structural pattern of the Todos Santos Coastal Plain, based on geophysical data. Ciencias Marinas, 30(2), 349-364. [ Links ]
Pindell J., Kennan L., Stanek K.P., Maresch W.V., DraperG., 2006, Foundations of Gulf of Mexico and Caribbean evolution: eight controversies resolved. Geologica Acta, 4(1-2), 303-341. [ Links ]
Puscharovskiy Y.M., Mossakovskiy A.A., Suárez J., 1989, Tectonic map of Cuba at 1:500 000 (4 sheets): Academy of Sciences of Cuba, Institute of Geology and Paleontology and Academy of Sciences of the USSR, Moscow. [ Links ]

