


Servicios Personalizados
Revista
Articulo
 Inglés (pdf)
 Artículo en XML
 Referencias del artículo
 Enviar artículo por email
Indicadores
-
 Citado por SciELO
 -
 Accesos
Links relacionados
-
 Similares en
SciELO
Similares en
SciELO
Compartir

 Permalink
Geofísica internacional
versión On-line ISSN 2954-436Xversión impresa ISSN 0016-7169
Geofís. Intl vol.51 no.1 Ciudad de México ene./mar. 2012
Original paper
Structure of the Guaraní aquifer in the surroundings of the Uruguay river from magnetotelluric soundings
Fernando Corbo1*, Jorge Arzate2 and Alejandro Oleaga3
1 Posgrado en Ciencias de la Tierra Centro de Geociencias Campus UNAM - Juriquilla Blvd. Juriquilla 3001, 76230 Querétaro, México *Corresponding author: fcorbo@geociencias.unam.mx
2 Centro de Geociencias Campus UNAM - Juriquilla Blvd. Juriquilla 3001, 76230 Querétaro, México Email: arzatej@geociencias. unam.mx
3 INGESUR SRL Requena 1062/302 Montevideo, 11200 Montevideo, Uruguay
Received: June 3, 2010;
accepted: October 13, 2011;
published on line: December 16, 2011
Resumen
Este trabajo se enfoca en obtener un modelo geológico del Sistema Acuífero Guaraní (SAG) en una de las zonas de mayor explotación, mediante sondeos magnetotelúricos de espectro amplio. La región analizada comprende ambos flancos del Río Uruguay entre las latitudes 30° 30' y 31° 52' Sur y las longitudes 57° y 58° 22' Oeste. Como parte de este estudio se realizaron un total de 31 sondeos AMT y MT los cuales fueron calibrados con 14 pozos profundos con información del subsuelo. Previo a la interpretación cuantitativa de los datos, se llevó a cabo un análisis de distorsión de los datos para determinar la dimensionalidad del medio geológico de la región. Los resultados indican que a frecuencias mayores de 1 Hz el subsuelo se comporta como un semi-espacio estratificado (1D) a excepción de algunos sitios en donde existe distorsión asociada a estructuras geológicas locales. A partir de la inversión unidimensional del conjunto de sondeos, se estimó la distribución de las principales unidades litológicas que constituyen el relleno de la cuenca Chaco-Paranense en esta zona, incluyendo al SAG. La calibración de los modelos obtenidos y la asignación de rangos de resistividad de las principales unidades litológicas se llevó a cabo utilizando siete registros de perforaciones profundas disponibles en la zona. Los resultados muestran que el basamento precámbrico se hace más profundo en dirección Oeste, alcanzando profundidades mayores a los 4 km en el lado Argentino del área de estudio. Como parte de los resultados se destaca la presencia de una estructura próxima y paralela al Río Uruguay que parece corresponder a una falla regional que sugiere desplazamientos verticales mayores a los 2 km, con el bloque caído hacia el poniente. Según esta interpretación, el Río Uruguay es en sí mismo una expresión superficial de dicha estructura ya que tiene aproximadamente su misma dirección. A frecuencias inferiores a 1 Hz el subsuelo se comporta como un medio bidimensional con un azimuth de la estructura regional de aproximadamente 0º, el cual es consistente con la orientación aproximada NS del río Uruguay. Usando esta información se llevó a cabo una inversión bidimensional a lo largo de cuatro perfiles transversales a la dirección del río con el objeto de contrastar los modelos obtenidos con aquellos que resultan del tratamiento 1D. Los modelos 2D obtenidos arrojan resultados consistentes, mostrando rasgos y estructuras semejantes de la impedancia.
Palabras clave: sistema acuífero Guaraní, sondeos magnetotelúricos, modelo unidimensional, modelo bidimensional.
Abstract
We use wide band magnetotelluric soundings to infer the geological and structural surrounding of the Guarani Aquifer System (SAG) in an area of major exploitation. The studied region comprises both sides of the Uruguay river, between latitudes 30° 30' and 31° 52' South and longitudes 57° 00' and 58° 22' West. A total of 31 AMT and MT soundings were used for the geological interpretation, which were calibrated with 14 deep wells with lithologic information. Prior to a quantitative interpretation of the data, a distortion analysis of the impedance was carried out to define the dimensionality of the predominant geological structures in the zone. The results show that at high frequencies, larger than 1 Hz, the earth behaves as a stratified ground or one-dimensional (1D) earth, excepts at some of the sites where the observed distortion is associated to local geological structures. From the one-dimensional inversion of the impedance determinant of the data set we estimate the distribution of the main lithological units that conform the sedimentary filling in the zone of the Chaco-Paranense basin, including the SAG. The calibration of the obtained models and the assignation of the resistivity ranges of the main geological units were done using seven resistivity logs from deep wells available in the area. The results show that the Precambrian basement becomes deeper towards the west, reaching depths larger than 4 km in the Argentinian side of the studied area. The results also show the existence of a structure near and parallel to Uruguay river, that seems to correspond with a major regional fault, suggesting vertical displacements larger that 2 km. According to this interpretation the Uruguay river is a superficial expression of the deep regional fault having roughly the same azimuth. At frequencies below 1 Hz the ground turns out to be bi-dimensional with a regional strike angle of around 0º, which is consistent with the NS trend of the Uruguay river. Using this information a 2D inversion was performed along four profiles perpendicular to the river to contrast the results obtained using the more simple 1D approach. The 2D models obtained yield consistent results showing similar features and structure for the SAG obtained from the 1D inversion of the invariant of the impedance.
Key words: Guarani aquifer system, magnetotelluric soundings, one-dimensional models, two-dimensional models.
Introduction
The Guaraní Aquifer System (SAG) is one of the largest groundwater reservoirs known on earth. It has an extension of about 1,195,500 km2 (Araujo et al., 1999), of which 840,000 km2 are in Brazilian territory, 225,000 km2 are in Argentina, 71,700 km2 in Paraguay and 50,000 km2 in Uruguay. The Guaraní aquifer is located in southestern South America approximately between the 12° and 35° of southern latitude and 47° and 65° of longitude west (Figure 1). The aquifer is known to be hosted in Triasic to Jurasic (245 to 144 My) sedimentary rocks of variable thickness, sometimes outcropping in the periphery of the SAG and sometimes located at depths of more than 1.5 km below an early Cretaceous thick basaltic layer. Its annual recharge is estimated in 166 km3 (Da Cunha-Reboucas and Amore, 2002). According to the actual limits, the inhabitants over the SAG amount nearly 15 million people. In some regions, it represents the only available source of water supply for urban, agricultural and industrial uses. Despite the relative large number of water wells drilled for this purpose, the limits of the SAG at the south-west of basin are poorly defined compared to other regions (Costa-Ribeiro, 2008). In the surroundings of the Uruguay river, the furthest southwestern region of the SAG, the aquifer has been explored for thermal water supplies used mainly by the tourist industry. In this region, water wells (in some cases) reach depths of 1.3 km, with yields that reach 120 l/s and temperatures up to 51 °C. The wide band magnetotelluric survey carried out in this zone, that cover a total area of nearly 12,000 km2, is aimed to obtain a geological model of the SAG and how is affected by the presence of the Uruguay river.
The SAG in the area
The studied area is located in the Uruguay-Argentina border centered in the Salto-Concordia thermal area covering the northeast of the Entre-Rios province of Argentina and the northwest sector of Uruguay. This area is regarded as the southernmost part of the Paraná basin. The basement in this region consists of Precambrian granites at the bottom of the sequence. Overlying discordantly are a series of sedimentary deposits of Devonian age that range from fluvial to neritic depth marine environments. This sequence marks a transgressive-regressive tectonic cycle that apparently reversed during the early to middle Permian, where neritic marine sediments appear again in the sequence (Figure 2). From the middle Permian to the Upper Jurassic a new period of shallow sea, lacustrine and eolic sedimentation was emplaced discordantly upon Lower Permian marine deposits. The upper part of this sedimentary sequence corresponds to the eolic, fluvial, and lacustrine rock package of Triassic-Jurassic age that conform the SAG (De Santa Ana et al., 1994). The estimated thickness from available wells is 300 to 800 m at depths ranging between 400 and 1000 m below the surface, although the thickness is around 300 m at Salto city. The lower part of the Permian-Jurassic deposits, conformed by a rock package of marine and glacial deposits, has lower hydraulic permeability than the Triassic -Jurassic package, but its shallow marine origin is often conditioning the water quality. Towards the Jurassic-Cretaceous limit an important effusive volcanic event started in the Pangea continent associated to the rifting of the south Atlantic, and started a slow subsidence of the northern basin (Soares and Landim, 1976, cited in Sprechmann et al., 1981). During the Lower Cretaceous, successive fissure basalts flows were laid over the Permian-Jurassic sedimentary sequence reaching exceeding thicknesses of 1 km in the area (Bossi and Schipilov, 1998; Corbo Camargo, 2006; Oleaga Batzerrica, 2002), burying and confining the Triassic-Jurassic deposits. A sedimentary cover of variable thickness (0 to 200 m) is at the top of the basalts that some authors consider as more than 26 different magmatic pulses (Montaño et al., 2004). From the geological point of view, the SAG is constituted by sedimentary rocks of the Jurassic Tacuarembó Formation (Bossi et al., 1975 cited in Veroslavsky et al., 2003), and by the Triassic Formation Buena Vista (Ferrando and Andreis, 1986). In general, the SAG is formed by a progression of continental sandstones (Tacuarembó Fm.) deposited in fluvial and lacustrine environments with intercalated eolic deposits, and sedimentary rocks from a transitional - continental environment (Buena Vista Fm.). Underlying the SAG, Permian-Carboniferous sedimentary rocks are conformed by tidal and marine environment (Yaguarí Fm, Paso Aguiar Fm, Mangrullo Fm, Fraile Muerto Fm, Tres Islas Fm. and San Gregorio Fm; De Santa Ana and Ucha, 1994). The bottom of basins are conformed by Devonian transgressive-regressive sequence (La Paloma Fm, Cordobés Fm and Cerrezuelo Fm; De Santa Ana and Ucha, 1994).
Magnetotelluric soundings
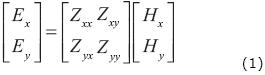
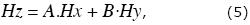
In general, the audio-magnetotelluric (AMT) and magnetotelluric (MT) soundings are used for different purposes. The AMT soundings are used for prospecting targets located at depths <1000 m, whereas the MT soundings are generally used for upper and middle crustal studies. In this work, we have used coincident AMT+MT soundings that combined cover a wide frequency range of naturally occurring electromagnetic fields from 104 to 10-3 hz. The acquisition time of sounding ranges from 16 to 24 hours, about 2 hours for the high frequency (AMT) record and the rest of the time for the intermediate and low frequency (MT) data. A wide spectrum frequency sounding produce apparent resistivity and phase curves that provide information from shallow surface deposits to deep regional basement structure. The measured horizontal electric and magnetic vector fields are related through the second rank frequency dependent impedance tensor Z through:
The estimation of the impedance elements from the horizontal electric and magnetic field components measured as time series is the first step in the processing scheme that leads to the estimation of the complex impedance elements (e.g., Jones et al., 1989).
From the impedance elements Zij, that together provide the response function of the ground, it is possible to define the apparent resitivities and phase differences between the electric and magnetic conjugated fields Ei and Hj Strictly speaking, the four complex elements of the tensor define an equal number of apparent resistivities and phase differences for a structurally complicated ground. However, the prevailing geology often allows to simplify Z in the event of a two-dimensional (2D) or one-dimensional (1D) ground. A regional geological contact or another elongated structural feature would correspond to the first case, while a stratified or thick uniform ground (stable craton or a marine platform) could represent the later. In both such cases, the diagonal elements of Z are nil whereas Zxy ≠ Zyx for the 2D case, and Zxy = Zyx for the stratified/uniform 1D ground. This means that for the two-dimensional case two orthogonal resistivities and two phases are defined, when one of the reference coordínate axis is coincident and the other perpendicular to the strike direction of the regional structure, in which case (Vozoff, 1989):
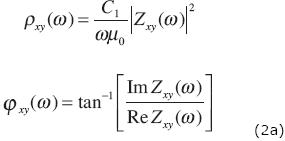
where C1 y C2 are constant quantities representing the static shift of the resistivity curves produced by the effect of electrical charge building across local heterogeneities. The units of apparent resistivity ρij and phase φij are Ohm-m and degrees (°) respectively. In these equations ω = 2πfwith f the prospecting frequency given in hertz, and µ0 is the magnetic permeability of vacuum equals to 4π x 10-7 H/m. In the case that a predominantly stratified ground with little or not structural complexity, the apparent resistivity as well as the phase are the same in any horizontal direction for a given frequency and, in principle, can be estimated using any pair of the above equations. However, it is more accurate to use the determinant average expression that account for possible lateral variations such as (Berchichevsky and Dmitriev, 1976):
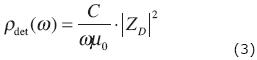
where ZD = ZxxZyy- Zxy Zyx. This expression is a geometric means respectively of Zyx and Zyx, and has the additional advantage that ZD is rotationally invariant, that means that its value do not depend on the rotation of the coordinate system. The determinant mode reduces the distortion effects caused shallow heterogeneities and non-finite lateral structures, and the phase is not affected by galvanic distortions (Berchichevsky and Dmitriev, 1976). The inversion, generally allows a good data fit while at the same time resolving reasonably well both resistive and conductive structures along any profile.
In total we measured 31 sites of which 21 where wide band (AMT+MT) soundings and 10 where just high frequency (AMT) soundings (Figure 1), seven of them where parametric soundings measured in the vicinity of wells with known lithology. Four of those wells have also available electric logs that allowed us to calibrate our models.
Apparent resistivity maps
The distribution of apparent resistivity at specific frequencies in the studied area is a useful representation of raw data to acquire a first insight of the underground geology and its complexity.
Previous to the elaborated an interpolated map the resistivity curves were analyzed for static shift and corrected by correlation using the available geological map as well as neighboring sites to fix the correct resistivity level. Figure 3 shows the distribution of apparent resistivities, calculated from the impedance determinant, in the zone, for frequencies of 100, 10, 1, and 0.1 Hz, which correspond to shallower to deeper depths respectively accordingly to the depth-frequency dependence given by (e.g. Vozoff, 1989):
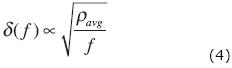
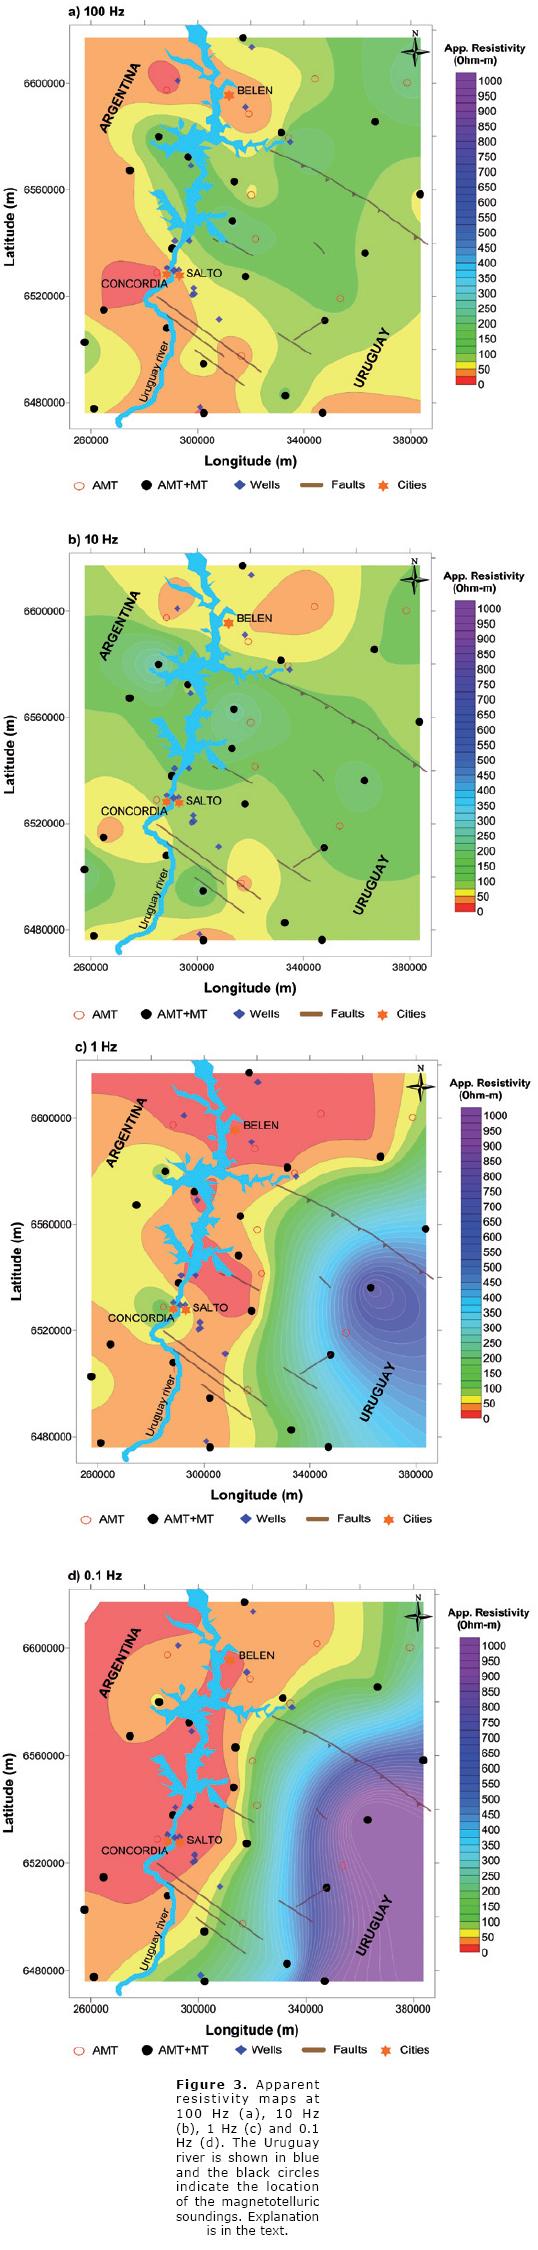
being d, the (skin) depth, ρavg, the average resistivity and f the testing frequency, in this case 100, 10, 1 and 0.1 Hz. As observed from this equation, the lower the frequency, the deeper the penetration depth and conversely. Hence, at 100 hz and 10 Hz low (less than 80 Ohm-m) and intermediate (from 80 to 400 Ohm-m) resistivities are characteristic at shallow depths (Figures 3a and 3b); the lower resistivities are distributed in the west and south of the studied area, whereas the intermediate resistivities are located mainly in the central and northeast regions. At 1 Hz (Figure 3c) the distribution of intermediate resistivities (80-400 Ohm-m) cover almost entirely the area except some isolated spots. In both cases, the intermediate resistivities are associated to the spatial distribution of the fissure basalts, known to be widespread distributed in the area at depths above 1 to 1.5 km. At frequencies lower than 0.1 (Figure 3d), representing deeper depths, a zone a higher resistivities ( > 400 Ohm-m) becomes apparent mainly to the east of the Uruguay river, that suggest a shallower resistive basement in this region in contact with more conductive deposits that extend towards the west.
Dimensionality of the ground
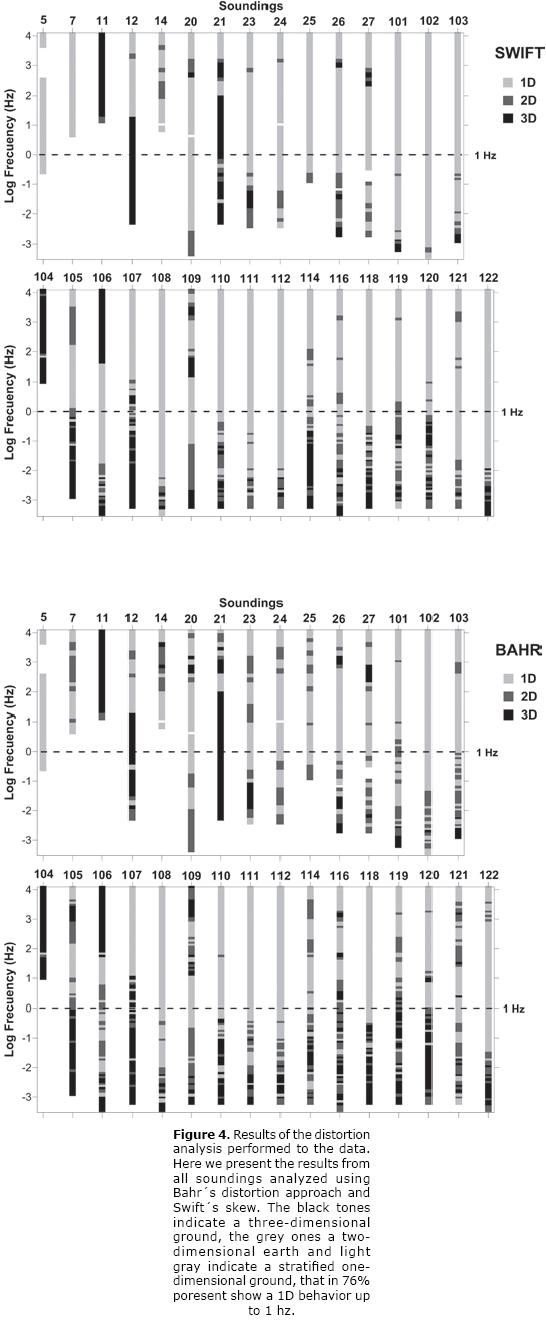
There are different techniques to establish the dimensionality of the ground from the measured impedance tensor Z (i.e. Swift, 1967; Groom and Bailey, 1989, 1991; Bahr, 1988, 1991; Lilley, 1998a,b; Weaver et al., 2000). From the distortion parameters estimated, particularly the skew, it is possible to define the complexity of the ground at different frequencies in terms of the geological structures that modify the flow of the natural electromagnetic fields propagating below the ground that are measured at the surface. From the distortion analysis of the data it is possible to make a decision on the appropriate treatment required by them. If the tensor do not has a distortion, then it is not necessary 2D or a 3D data treatment to adequately interpret he correct structure of the ground because the absence of distortion is telling us is that the earth behaves as a stratified ground. However, often happens that the impedance has different degrees of distortion for different frequency bands and therefore a single sounding can detect different dimensionality at different depths. A situation like this would indicate different degrees of geological complexity as a function of depth.
We have applied the dimensionality techniques of Swift (1967) and Bahr (1991) for every frequency of all 31 soundings in order to define the more appropriate treatment required by the data. The numerical criteria given by the authors were used to establish the dimensionality of the impedance Z, although the additional distortion parameters m and h of Bahr's criteria were also used, which provides a more robust estimation of dimensionality. Figure 4 represents the results applying both methods of dimensionality to all soundings. The results of this soundings suggest that the ground in the studied area can be regarded one-dimensional down to a frequency of 1 Hz approximately (light gray tone in Figure 4), except for sites where distortion occur associated to local structural complexity. About 80% of the analyzed soundings indicate a prevailing 1D ground for frequencies above 1 Hz and predominantly 2D for frequencies lower than this, with some sites showing a 3D behavior in limited band widths.
Parametric soundings
Seven of the AMT+MT soundings were carried out in the surroundings of equal number of water wells an which have lithology available; four of them had also electric logs. The wells where the parametric soundings were done are named Gaspar, Belén, Arapey, Guaviyú, Chajarí, Concordia and Federación, the first three located in Uruguay and the later four in Argentina (Figure 1). Their depths range from 800 to more than 2,500 m. The correlation of the lithology and the associated electrical well logs allowed us to assign ranges of formation resistivity values to the geological units along the column and extrapolate these values through the modeled resistivity at parametric soundings to the rest of the studied area. The resistivity ranges associated to the main geological units identified in the area from the available wells aresummarized in Table 1. These results show that the electrical resistivity of the Lower Cretaceous basalt layer is quite variable, the reason is that according to drilled samples there are alteration zones within this formation, but particularly at the top of the unit. The alteration zones decrease towards the base of the layer and the resistivity becomes larger and more stable. The electric logs show that the altered sectors have resistivities of around 50 Ohm-m whereas in sectors without alteration it takes values around 650 Ohm-m. On the other hand, the Jurassic-Triassic sedimentary unit, associated to saturated sandstones of the SAG underlying the basalt layer, shows a smaller range of variation from 17 to 70 ohm-m. In some areas, exist the presence of individual diabase intrusions, thin layers within the aquifer body, have observed resitivities ranging from 450 to 700 Ohm-m, however their thickness compared to that of the SAG (more that 200 m in the zone) represent only a fraction.
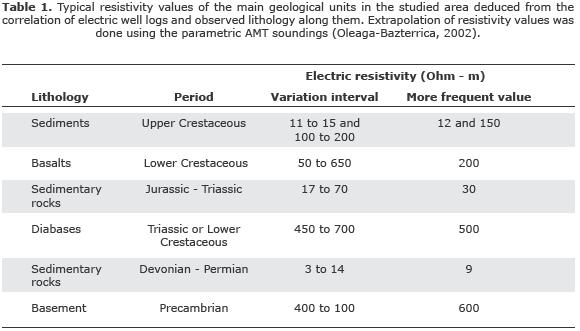
The Devonian-Permian package of sedimen-tary rocks underlying the SAG also shows a range of small resistivity variations, from 3 to 14 Ohm-m, suggesting a reasonable stratigraphic homogeneity for this unit, although is more probable that the brackish water content of this predominantly marine unit plays a major role in either its homogeneity and the lower values of resistivity observed. The low resistivity character of this layer makes relatively easy to identify it in the resistivity curves obtained from the magnetotelluric soundings, however because of the relatively small resistivity contrast with the SAG it often becomes uncertain to separate them from each other giving rise to ambiguity in the estimation of the aquifer thickness. At the bottom of the sequence is located the more resistive member, the Precambrian granitic basement, that shows a range of resistivity variation between 400 and 1000 ohm-m. The lower resistivity values correspond to the upper few meters of the basement where alteration occurs by effect of the chemical interchange with the overlying marine rock package. Deeper into the basement is expected to have larger and more homogeneous values as suggested by several measured resistivity curves.
One-dimensional inversions
According to the previous dimensionality results, the behavior of the ground for frequencies larger than 1 Hz, which corresponds to the SAG, can be regarded as one-dimensional. Likewise, the distortion analysis yielded unstable values for the strike of the regional structure for most of the frequency band above this 1 Hz, which is also an indication of an stratified earth. With few exceptions that seem to correspond to the presence of local fault structures besides the measuring sites, most of the analyzed soundings present characteristics of a 1D ground in the mentioned range. In addition, the induction vectors for the same range of frequencies provide consistent results with the distortion analysis. In a homogeneous or stratified ground, this means, in the absence of a structurally complex ground, the vertical field component is null.
The Geomagnetic Transfer Function (Tipper) is defined as the relation between the vertical with the corresponding horizontal components of the magnetic field Hz, given by the expression (e.g. Vozoff, et al., 1989; Lilley et al., 1982):
In this equation A and B are complex numbers. The Tipper can be decomposed into two real vectors in the xy plane, corresponding to its real and imaginary parts; these real vectors are called induction vectors. The expressions for the magnitude (I) and phase (β) of the induction vectors can be estimated through the expressions (Vozoff, 1991):
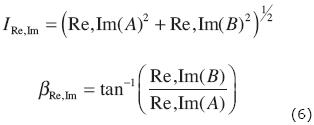
Both magnitude and phase of the real induction vectors are related to the presence of lateral changes in conductivity at specific ranges of frequencies. The vectors point towards the conducting structures, and their magnitude increases with their proximity as well as with their size with respect to the sounding location. If no lateral conductors exist in a range of frequencies, then the magnitude of Hz approaches to zero at that specific range frequencies, which is an indication that the ground is one-dimensional. Figure 5 shows examples of the real part of induction vectors at frequencies of 100, 1.0 and 0.01 Hz, where it is observed that their value at 1Hz (case b) is in general very small for most of the sites, and that for the other cases (a) and c) the values are in general considerably larger.
Depth charts
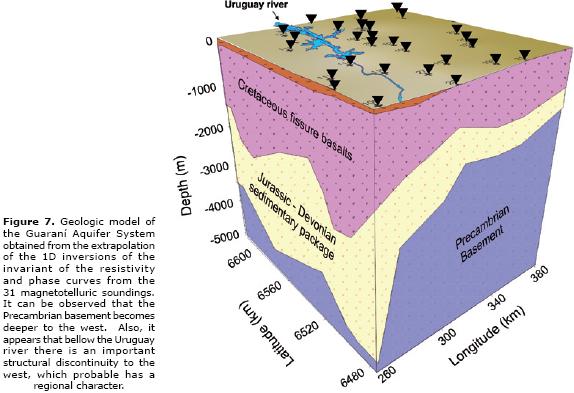
Base upon the previous distortion analysis and induction vector results, we carried out one-dimensional inversions of the resistivity and phase curves of the rotationally invariant, using an Occam algorithm. Several models were worked out but the depth maps were obtained from the extrapolation of the one-dimensional layered models of all the interpreted soundings. The results are shown in Figure 6 in form of depth maps to the bottom and tops of the main formation units related to the SAG and discussed above. Figure 6a represents the estimated depth to the top of the basalt unit, where the darker tones indicate the zones of larger depths. As observed, to the east of the Uruguay river the basalts are outcropping in most of the area, whereas to the west the sedimentary layer covering this unit reaches thickness of 90 m. Figure 6b represents the depth to the bottom of the Cretaceous basalts, that varies from few hundred of meters to more than 2,000 m in some sectors, in particular towards the west of the studied zone. The base of this unit, correspond to the top of the Jurassic sedimentary rocks that contain the Guaraní aquifer. To the east of the river, the interface of the basalt layer with the sandstones unit is well defined, but to the west of the river there are some intercalations of diabases in the top of sandstone that makes difficult to trace a clear limit between them. In Figure 6c the depth to the bottom of the Devonian sedimentary sequence is shown, which is regarded as the base of the Chaco-Paraná basin in the area. These results indicate that the Precambrian basement of the basin is dipping towards the west where it can reach depths of 4,500 m or more, whereas to the east of the river estimated maximum depths are around 800 m. Actually, there is an apparent sudden change in the basement depth suggested by the closing of the contour lines about 30 km east of the river and nearly parallel to its trace. The thickness of the Jurassic-Devonian sedimentary package (Figure 6d), obtained from the difference between the base of the basalt unit and the top of the basement, also suggest an important change of volume of sediments occurring at about the same location. Figure 7 shows the extrapolated one-dimensional interpretation summarized in a simplified geological model. It can be appreciated that there is a vertical displacement of several hundred of meters of the basement east of the Uruguay river and parallel to it. Also, the interpreted model suggests another vertical displacement just under the Uruguay river, implying that its trace at the surface is a manifestation of such regional buried structure. According to this interpretation, the major faulting of the Precambrian basement occurred previous or may be contemporary to the emplacement of the Cretaceous basalts.
Two-dimensional models
According to the distortion analysis carried out to the data set, the SAG is within a predominantly one-dimensional stratified earth. However, for frequencies larger than 1 hz, several soundings reveal a more complicated behavior. An indication of this become apparent from the results of the one-dimensional extrapolated model (Figure 7) that suggests the existence of regional faults corresponding to depths of the basement. In order to find out if such structures have a two-dimensional or a more complex distribution, we applied Swift (1967) and Bahr (1988, 1991) methods to analyze the azimuthal strike angle at every sounding for frequencies below 1 Hz and frequencies where the dimensionality was 2D or 3D. Figure 8 shows the results obtained, that suggest a consistent mainly two-dimensional behavior at low frequencies with values for the strike angle around 0º. This result implies the existence of a deep regional structure with a predominant North-South orientation that can be regarded as the direction of the principal structure in this zone. The little dispersion of estimated azimuth indicates a well defined two-dimensional feature.
Using the azimuth value of 0º we carried out the 2D inversión of 4 profiles approximately perpendicular to the regional structure, which approximately coincide with the Uruguay river, and 2 profiles parallel to it (Figure 9) using the Winglink7 program. There was not need to rotate the impedance tensor to the regional strike as the measurement X axis of the soundings coincided systematically with the north-south direction and the Y axis with the east-west direction. Under this conditions, the transverse magnetic or TM mode is defined by the resistivities ρxy (ω) = ρTM(ω) and phases φxy (ω) = φTM (ω) and correspondingly, the transverse electric or TE mode is defined by ρxy (ω) = ρTM(ω) and φxy (ω) = φTE (ω). Both modes were inverted simultaneously using 50 iterations and a fix variance of 2.5%. We used the Rodi and Mackie's (2001) inversion code, which makes a regularization of the Tikhonov equation using the method of non-linear conjugate gradients. We have made several attempts to find out the optimal number of necessary iterations for the inversion in order to obtain the minimum RMS error with the best regularization parameter. The regularization parameter τ controls the balance between the measured MT data and the model of resistivity; high values of τ produce a resistivity model with a poor fit with the measured data but spatially smoothed, while small values of τ produce a better fit of the measured data but the model can be coarse and containing artifacts (Unsworth et al., 2005). Figure 10 shows the resulting resistivity models (upper half) obtained after 50 iterations using a regularization parameter τ = 4, and the interpreted geology profiles (lower half) using the available lithology from wells. The mean quadratic error associated with the models fit, using a floor standard deviation error for resistivity and phase for both polarization modes and tipper was: RMS=3.1, profile 1; RMS=1.9, profile 2; RMS=2.4, profile 3; RMS=2.4, profile 4; RMS=1.91, profile 5; and RMS=2.84, profile 6. Profiles 1, 3, 5, and 6 cross approximately perpendicular the Uruguay river. They show a consistently dipping basement and thickening of the sedimentary Jurassic-Devonian package to the west, towards Argentina. To the east of the river, Profile 2 suggests a tectonically stable basement except for perceptible variations around Site 27, where it becomes deeper. It appears that the observed feature is related to the fault system mapped at the surface, which seems to be affecting the basement as well. The induction arrows at Sites 27 and 110 at 0.01 Hz (Figure 5c) support the existence of a nearby discontinuity at basal depths. This Profile 2, running parallel to the Uruguay river but crossing it to the north, shows a clear basement discontinuity that may be related to the westward continuation of the NE-SW fault mapped to the east. However, such fault does not have a significant vertical displacement to the east of the Uruguay river, although it is possible to observe a noticeable variation around Site 105. Figure 11 shows the resistivity and phase field curves, with the fitting curves obtained from the 2D data inversion.
Conclusions
Given the good contrast between the confining bottom and top resistive geological units with the more conductive sedimentary rock package that contains Jurassic and Devonian rocks, the magnetotelluric soundings of wide spectrum constitute an adequate tool to investigating the SAG as well as the Chaco-Paranense basin in this region. The 31 measured sites represent an important advance for the geological knowledge of the basin. The interpretation of this information produced a previously inexistent model of the distribution of the main geological units present in the area. However, despite the good lithologic control and the well defined electric contact between the Jurassic sandstones and the Cretaceous basalts, the presence of intercalations of thin sandstones reduces accuracy in the determination of the depth to this interface, in this cases we detect the boundary of the basalts at the midpoint of collations. Also, because of the poor resistivity contrast between the Jurassic-Triassic SAG and the Permian-Devonian sedimentary rocks, both relatively conductive, is not possible to separate them individually, thus we only estimate their combined thickness.
The applied distortion and dimensionality criteria to the data suggest that the ground can be regarded as stratified, without major lateral discontinuities, to depths larger than 2 km. Using these results we obtained a model of the distribution of the sedimentary Jurassic-Devonian package from the interpolation of the 1D inversion of the invariant of the 31 soundings. A complementary two-dimensional inversión along six selected profiles across and along the Uruguay river, show consistent results with the 1D interpolated block model. These results support the existence of a NS basement discontinuity below the river, which could be interpreted as a regional normal fault with the down block to the west. The deduced orientation of the structure appears to have a tectonic relation with the trace of the Uruguay river that also bears an approximately NS direction.
According to these results, the vertical displacements of basement rocks across the fault could be as large as 2 km or more. The Jurassic-Devonian sedimentary package west to the river is thicker than to the east and the basalts also appear to have larger thicknesses than to the east of the river. In addition, one of the 2D profiles (profile 4) suggests the existence of another possible vertical discontinuity in the basement at the NW quadrant of the study area. It appears that such basal discontinuity is related to the westwards prolongation across the river of the Arapey fault.
Acknowledgments:
The authors wish to acknowledge the financing of the Guaraní Aquifer System Project (PSAG) for the Sustainable Development and Environmental Protection. We also wish to thank the group of Groundwater Hydrology of the Faculty of Engineering of the Universidad de la República in Montevideo, the support we receive for the field work activities. Most of the data of this research work are from the master thesis of Fernando Corbo of the Earth Sciences program of the National University of Mexico. The postgraduate studies of Fernando Corbo were financed by the Dirección General de Estudios de Posgrado of the Universidad Nacional Autónoma de México (DGEP-UNAM).
Bibliography
Araujo L.M., Franca A.B., Potter P.E., 1999, Hydrogeology of the Mercosul aquifer system in the Paraná and Chaco-Paraná Basins, South America, and comparison with the Navajo-Nugget aquifer system, USA. Hydrogeology Journal, Springer, v 7(3), pp 317-336. [ Links ]
Bahr K., 1988, Interpretation of the magnetotelluric impedance tensor: regional induction and local telluric distortion. Journal of Geophysics, v 62, pp 119-127. [ Links ]
Bahr K., 1991, Geological noise in magneto-tellurical data a classification of distortion types. Phys. Earth Planet Interiors, v 66, pp 24-38. [ Links ]
Berdichevsky M.N., Dmitriev V.I., 1976, Distortion of magnetic and electric fields by near surface lateral inhomogeneities, Acta Geod. Geophys. Montan. Acad. Sci. Hung. 11, pp. 447-483. [ Links ]
Bossi J., Schipilov A., 1998, The Arapey Group: confining basalts of the Guaraní Aquifer in Uruguay, Revista Agrociencia, Facultad de Agronomía, Universidad de la República Oriental del Uruguay, v II (1), pp 12-25. [ Links ]
Bossi J., Ferrando L., Fernandez A., Elizalde G., Morales H., Ledesma J., Carballo E., Medina E., Ford I., Montaña J., 1975, Carta geológica del Uruguay. Departamento de Publicaciones. Universidad de la República. Montevideo. Uruguay. [ Links ]
Corbo Camargo, F., 2006, Modelo geofísico del Acuífero Guaraní: zona comprendida entre Uruguay y Argentina. Master Thesis. Universidad Nacional Autónoma de México [ Links ]
Costa-Ribeiro W., 2008, Aqüífero Guarani: Gestão compartilhada e soberania. Estudos Avançados, v 22 (64), pp 227-238, Brazil. [ Links ]
Da Cunha-Reboucas A., Amore L., 2002, O Sistema Aquifero Guaraní - SAG; Rev. Águas Subterrâneas, 16, pp 135-143, Brazil [ Links ]
De Santa Ana H., Ucha N., 1994, Exploration perspectives and hydrocarbon potential of the Uruguayan sedimentary basins. Administración Nacional de Combustibles, Alcohol y Pórtland (ANCAP). Internal report, pp 100. [ Links ]
Ferrando L.A., Andreis R.R., 1986, Nueva estratigrafía en el Gondwana del Uruguay. Actas I Congreso Latinoamericano de Hidrocarburos. ARPEL. Buenos Aires, Argentina. I: 295-323. [ Links ]
Groom R.W., Bailey R.C., 1989, Decomposition of magnetotelluric impedance tensor in the presence of local three-dimensional galvanic distorsion. Journal Geophysics Research, v 94, pp 1913-1925. [ Links ]
Groom R.W., Bailey R.C., 1991, Analytical investigations of the effects of near surface three dimensional galvanic scatterers on MT tensor descomposition. Geophysics, v 56, pp 496-518. [ Links ]
Jones A.G., Chave A.D., Auld D., Bahr K., Egbert G., 1989, A comparison of techniques for magnetotelluric response function estimation. Journal of Geophysical Research, 94, pp. 14,201-14,213. [ Links ]
Lilley F.E.M., Arora B.R., The Sign Convention for Quadrature Parkinson Arrows in Geomagnetic Induction Studies. Reviews of Geophysics and Space Physics, 20, 3, p 513-518. [ Links ]
Lilley F.E.M., 1998a, Magnetotelluric tensor decomposition 1. Theory for a basic procedure, Geophysics, 63, 1884-1897. [ Links ]
Lilley F.E.M., 1998b, Magnetotelluric tensor decomposition 2. Examples of a basic procedure, Geophysics, 63, 1898-1907. [ Links ]
Montaño, J., Da Rosa, E., and Hernández, M., 2004. Características hidrogeológicas del acuífero transfronterizo Guaraní. Asociación Latinoamericana de Hidrología Subterránea para el Desarrollo. http://www.alhsud.com/castellano/resultats.asp?results=articulos. [ Links ]
Oleaga-Bazterrica A., 2002, Contribución a la hidrogeología del acuífero Guaraní en el sector Uruguay. Un enfoque integral. Master Thesis. Universidad Nacional Autónoma de México. [ Links ]
Rodi W., Mackie R., 2001, Nonlinear conjugate gradients algorithm for 2-D magnetotelluric inversion. Geophysics, v 66, (1), pp 174-187. [ Links ]
Soares P.C., Landim P.M.B., 1976, Comparison between the tectonic evolution of the intracratonic and marginal basins in south Brazil. Anais da Academia brasileira de Ciencias, 48, p 313-324. [ Links ]
Sprechmann P., Bossi J., Da Silva J., 1981, Cuencas del Jurásico y Cretácico del Uruguay. In Volkheimer, W. y Mussachio (Eds.) Cuencas sedimentarias del Jurásico y Cretácico de América del Sur. Comité Sudamericano del Jurásico y Cretácico. Buenos Aires, Argentina, v 1, pp 239-270. [ Links ]
Swift C.M., 1967, A magnetotelluric investigation of an electrical conductivity anomaly in the southewesteern United State. Doctoral thesis, M. I. T. [ Links ]
Unsworth M., Soyer W., Tuncer V., 2005, Magnetotelluric measurements for determining the subsurface salinity and porosity structure of Amchitka Island, Alaska. Draft Report prepared for CRESP, Department of Physics and Institute for Geophysical Research University of Alberta, Edmonton, Alberta, T6G 0B9, Canada. [ Links ]
Veroslavsky G., Daners G., De Santa Ana H., 2003, Rocas sedimentarias pérmicas en la plataforma continental uruguaya: el prerift de la Cuenca de Punta del Este. Geogaceta, 34: 203-206. España. [ Links ]
Vozoff K., 1989, The magnetotelluric method, in Electromagnetic methods in applied geophysics, Nabigian M.N. (Ed.). Soc, Expl. Geophys. [ Links ]
Vozoff K, 1991, in Electromagnetic Methods in Applied Geophysics, Vol. 2, Application, pp. 641-711, Society of Exploration Geophysicists, Tulsa. [ Links ]
Weaver J.T., Agarwal A.K., Lilley F.E.M., 2000, Characterization of the magnetotelluric tensor in terms of its invariants. Geophys. J. Int., 141, 321-336. [ Links ]

