


Servicios Personalizados
Revista
Articulo
 Inglés (pdf)
 Artículo en XML
 Referencias del artículo
 Enviar artículo por email
Indicadores
-
 Citado por SciELO
 -
 Accesos
Links relacionados
-
 Similares en
SciELO
Similares en
SciELO
Compartir

 Permalink
Geofísica internacional
versión On-line ISSN 2954-436Xversión impresa ISSN 0016-7169
Geofís. Intl vol.51 no.1 Ciudad de México ene./mar. 2012
Original paper
Estimation of soil petrophysical parameters based on electrical resistivity values obtained from lab and in-field measurements
Omar Delgado Rodríguez1*, María Ladrón de Guevara Torres2, Vladimir Shevnin3 and Albert Ryjov4
1 Instituto Mexicano del Petróleo, Eje Central Lázaro Cárdenas 152 07730, México D.F.*Corresponding author: odelgado@imp.mx
2 Instituto Politécnico Nacional, Centro Interdisciplinario de Investigación para el Desarrollo Integral Regional - CIIDIR Unidad Oaxaca, México
3 Moscow State University, Faculty of Geology Moscow, Russia
4 Moscow State Geological Prospecting Academy, Geophysical Faculty Moscow, Russia
Received: January 20, 2010;
accepted: October 13, 2011;
published on line: December 16, 2011
Resumen
El conocimiento de los parámetros petrofísicos del suelo es muy útil para la agricultura y análisis de impacto ambiental. Por lo tanto, es importante desarrollar técnicas y metodologías que ayuden a obtener mapas petrofísicos del suelo de manera rápida y económica. Este trabajo muestra dos técnicas para la estimación del contenido de arcilla, porosidad y capacidad de intercambio catiónico a partir de mediciones eléctricas. La primera, basada en mediciones de resistividad del suelo (SRM) realizadas en laboratorio; la segunda técnica, ERT & WRM, mediante la aplicación de Tomografía de Resistividad Eléctrica (ERT) y mediciones en campo de resistividad en muestras de agua subterránea (WRM). Se realizó un estudio geoeléctrico en un sitio areno-limoso y los resultados alcanzados fueron comparado con los obtenidos mediante la técnica de análisis textural de Bouyoucos. La técnica SRM mostró ser más precisa y menos productiva que la técnica ERT & WRM. Los resultados obtenidos proponen una nueva aplicación de los métodos geoeléctricos en estudios de agricultura precisa, tanto para análisis de muestras de suelo en laboratorio utilizando la técnica SRM como para evaluar grandes extensiones de suelo agrícola utilizando la técnica ERT & WRM.
Palabras clave: tomografía de resistividad eléctrica, modelación petrofísica, contenido de arcilla, porosidad, CIC.
Abstract
Knowledge of soil petrophysical parameters is very useful for agricultural and environmental impact analysis. Therefore, it is important to develop techniques and methodologies to help obtain soil petrophysical maps both quickly and inexpensively. This paper shows two techniques for estimating clay content, porosity and cation exchange capacity from electrical measurements. The first one, based on soil resistivity measurements (SRM), is performed in the laboratory. The second technique, ERT & WRM, uses the Electrical Resistivity Tomography (ERT) and groundwater resistivity measurements (WRM) in the field. A geoelectrical study was carried out in a sandy-loam site and the results were compared to those determined by particle size analysis using the Bouyoucos technique for textural analysis. The SRM technique was more accurate but slower than the ERT & WRM technique. The obtained results suggest a new application of geoelectrical methods for precision farming, both for analysis of soil samples in the laboratory using SRM technique and to evaluate large tracts of agricultural land using ERT & WRM technique.
Key words: electrical resistivity tomography, petrophysical modeling, clay content, porosity, CEC.
Introduction
Usually, the planting and harvesting of diverse agricultural products involve large tracts of land. On the other hand, cultivation practice has always indicated that there are differences among nearby parcels, reflecting in the productivity of crops.
In several countries (e.g., USA, France, Germany) many techniques are used in carrying out research in order to determine the main soil parameters and their temporal variations; this procedure is known as Precision Farming (PF). The results of PF are used to exploit the farm soils in a more efficient way, allowing an increase of crops without using chemical fertilizers and pesticides, thus reducing the environmental impacts on agricultural activity (Robert, 2002).
PF has a great challenge: the study and mapping of soil parameters as rapidly and accurately as possible. Geophysical methods, specifically electrical and electromagnetic methods, are effective, quick, and inexpensive for the implementation of PF process (Sudduth et al., 2000) in the determination of the boundaries among genetic types of soils (Pascual et al., 1995), and changes in the degree of salinization (Williams and Baker, 1982) or moisture (McKenzie et al., 1989).
A new technology has been developed by the Mexican Petroleum Institute (Shevnin et al., 2006, 2007) based on electrical measurements made in both the laboratory and the field, that allows the determination of clay content, porosity and Cation Exchange Capacity (CEC). Soil samples taken at different study depths are subjected to electrical measurements in the lab to determine their petrophysical parameters, while the resistivity values calculated by the Electrical Resistivity Tomography (ERT) method, and groundwater salinity obtained in field, enabling the determination of petrophysical sections and maps for the entire study site. This inversion process starts with an initial model that includes previous information of the petrophysical parameters, which could be supplied from electrical measurements performed in the lab using soil samples collected from the site.
This paper describes two techniques for the estimation of clay content, porosity and CEC both from electrical measurements made in soil samples in the lab and from the resistivity values obtained with the implementation of ERT method in field. As a practical example, we present the results achieved at a site located in Oaxaca, Mexico.
Materials and methods
Water resistivity measurements (WRM)
The field procedure for performing the WRM is very simple: once the sampling point (e.g. pit or well) is identified a water sample is collected. Afterwards, by using a combo portable resistivity meter (e.g., Hanna HI98130) the readings of water conductivity (s), in mS/cm, and temperature, in °C are taken. Conductivity values, s, in mS/cm are converted to electrical resistivity values, rw, in Ohm.m by:

Using a GPS, the UTM coordinates of the sampling point must be taken for graphical representation. Subsequently, the values are corrected at a reference temperature of 20°C by the expression (Sorensen and Glass, 1987).

Where:
T = water temperature (°C)
α = temperature coefficient equal to 0.0177 1/°C (Beklemishev, 1963)
T0 = reference temperature equal 20°C
ρw = water resistivity measured in field (Ohm.m)
ρw20 = water resistivity corrected at 20°C (Ohm.m)
The temperature 20°C is selected for being the reference value in the process of petrophysical modeling.
Taking into account the linear function (logarithmic scale) of water resistivity versus salinity, for a reference temperature equal to 20°C, it is possible, for salinities below 10 gl-1, to estimate the water salinity from water electrical resistivity using the relation:

Where C is the salt content (NaCl equivalent) in gl-1.
The C value will be used in the process for determining petrophysical parameters.
Electrical Resistivity Tomography (ERT) method
The Vertical Electrical Sounding method, worldwide known since the beginning of the 1920's, was created by the Schlumberger brothers in France. They made a design using four electrodes (two for electric current injection and the other two for measuring potential difference). By increasing the distance between current electrodes, the study depth will increase as well (Keller and Frischknecht, 1966). Technically the method is very simple; it is currently used primarily for near surface studies. In 1990, a new stage in the development of this method began with the emergence of technology called Electrical Resistivity Tomography (ERT) or resistivity imaging. Such profile measurements allow two-dimensional interpretation, using software such as Res2DInv (Loke and Barker, 1996a, b). This two-dimensional interpretation has several good features making the interpretation results suitable for a good visualization. The resulting model has the same number of layers with same thicknesses along each profile (Figure 1), giving great advantage for processing and mapping of interpreted data.
The results obtained from ERT method are interpreted resistivity sections and maps (correlation of different profiles). Cross-sections have less interpolation between measuring points than maps. For map construction interpolation between profiles is needed. However, maps have less resistivity interval than sections (electrical properties vary more with depth than in horizontal direction). As a result we have higher resolution in maps (horizontal behavior of soil resistivity), leading us to locate weaker anomalies.
Soil Resistivity Measurements (SRM) at lab.
Ryjov and Sudoplatov (1990) presented a model that includes components of unconsolidated formations and electrochemical resistivity estimation of free water and water in the pores of the formation, resulting in the estimation of the rock resistivity. In this theoretical model solid grains of sand and clay make up an insulating skeleton where their capillaries are seen as hollow cylinders with different radii. The sand component contains a porous system of cylindrical channels (so-called wide pores) with radii rangind between 10–3 and 10–4 m, which are much larger than the thickness of the electrical double layer The micropores of the clay component are very narrow, and their average radii lie between 10–7 and 10–8m, which is close to the thickness of the electrical double layer. The thickness of the electrical double layer depends on the water salinity and increases with decreasing salt concentration. At near-surface conditions, when the salt concentration changes from 0.02 to 2 gl-1, the thickness of the electrical double layer varies in the range of 0.3 - 3 x 10⁻⁸m. The total volume of pores for sand and clay is taken into account separately by means of the value of its porosity, so the model of the mixture consists of two types of capillaries with different radii (Shevnin et al., 2007).
The capillaries of sand and clay can be connected in series, parallel or a combination of both connections. In nature, the combination of both parallel and series capillaries is generally observed, because some part of the clay is usually smeared on pore walls of the sand fraction, and some clay exists in the sand pores as plugs. The parallel and series connections of the conductive component were considered in the resistivity models developed by Wyllie and Southwick (1954) and Bussian (1983). To include the influence of the pore microstructure in the model, we have taken into account the tortuosity of the sand pores as a function of the content of solid sand grains in the mixture. Therefore considering this model it is possible to generate theoretical curves of electrical resistivity behavior from any soil consisting of sand and clay (in any proportion), according to the pore water salinity, based on the variation of the petrophysical parameters: clay content, porosity, and CEC.
Based on the need to obtain resistivity measurements versus pore water mineralization, a methodology was developed to calculate the petrophysical parameters; including a procedure for preparation of unconsolidated sediment sample and another procedure for experimental electrical measurements in the lab.
Once the in-field sample is collected, it is subjected to a drying and homogenization process, stirring well the soil sample. Afterwards, five resistivity boxes are filled with this homogenized sample, where salinized water is added (different for each resistivity box in the interval 0.1 to 80 gl-1) until the sample is fully saturated. These resistivity boxes are connected to any resistivity equipment (ERA, Saris, SYSCAL, etc.). Two potential measuring electrodes (M and N) are placed along one of the long sides for obtaining voltage measurements, which are recorded in the resistivity meter (Figure 2). A current electrode (A and B, Figure 2) is placed in each of the shorter side to inject current to soil sample.

Potential electrodes M and N are connected to the meter, and electrodes A and B are connected to the generator. The current (I) is injected to the resistivity box through electrodes A and B (Figure 2). The meter shows a value corresponding to the potential difference (AU) between electrodes M and N.
The electrical resistivity value is determined by:
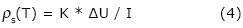
Where:
K = calibration coefficient of the resistivity box (m)
ΔU = potential difference value (mV)
I = electric current injected by generator (mA)
ρs(T) = resistivity (Ohm.m) of the soil sample at room temperature T.
To calculate the calibration coefficient (K), each resistivity box is filled with water of known salinity (and resistivity) and electrical resistivity measurements (ΔU and I values) at controlled temperature are performed. Using the equation (4), K value is determined.
The soil resistivity value obtained in this way depends on temperature, so it is necessary to measure the temperature of the sample in each resistivity box in order to determine its correction. To correct the measurements to a reference temperature of 20°C the expression (2) is used.
At the end of this procedure five values of soil electrical resistivity (ρs) are obtained for each resistivity box depending on the pore water salinity (C), creating a database which is used in an iterative inversion process, to estimate the petrophysical parameters. Iterative inversion is a process of minimizing the error among the electric resistivity values, obtained by using the theoretical model described above, and the experimental data measured in the lab. The reduction of the error is performed by using the software PetroWin developed by A. Ryjov (Ryjov and Sudoplatov, 1990; Ryjov and Shevnin, 2002). Using software PetroWin, the modification of different petrophysical parameters, such as the CEC of the clay, capillary radius of sand and clay, porosity of clay and sand, from the theoretical model is performed, resulting in the theoretical resistivity function. Software Petrowin works is several steps: first, calculation of water resistivity, taking into account types of ions in solution (cations and anions), their mobility and concentration, then, calculation of conductivity in electrical double layer (between water and solid phase) taking into account properties of solution and solid phase (CEC value is zero for sand and maximal for clay), after, calculation of rock resistivity taking into account rock porosity, pore size, humidity and clay content and, after that, software can calculate resistivity for different positions of clay in pores (as corks in capillary paths and as thin layers at capillary wall). Finally, calculation of clay content, porosity and CEC values for the soil sample (Shevnin et al., 2007).
Estimation of the petrophysical parameters from resistivity measurements obtained by ERT and WRM.
If we use the interpreted soil resistivity values obtained by ERT and groundwater salinity values calculated by WRM, instead of a curve of resistivity versus salinity for a soil sample from electrical measurements made in laboratory, it is then possible to determine, for each ERT profile, petrophysical parameter sections for clay content, porosity and CEC. This procedure uses the same petrophysical modeling algorithm and can convert resistivity maps (for any geoelectrical layer) into petrophysical maps (Delgado-Rodríguez et al., 2006). It is necessary to have an initial model based on the results of the SRM method obtained for some soil samples collected at the site.
Textural analysis of Bouyoucos
The knowledge of soil texture is important because it affects the soil fertility and determines the rate of consumption and storage of water in soil. The relative proportion of sand, silt and clay in a soil may be used to determine a textural type following the Bouyoucos procedure (Bouyoucos, 1936).
The determination is fast and approximate, separating aggregates, and analyzing particles. A measured time is chosen for the separation of larger particles and another one for small ones. As a general rule, after 40 s the sand particles (diameter greater than 0.005 mm) settle at the bottom of the hydrometer, while silt particles (diameter greater than 0.002 mm) need 2 h. In the case of the clay, it requires up to 24 h for a precise calculation of settled particles. Knowing the length of the hydrometer we can calculate the velocity of the particles and their diameters and, thus, determine the sand, silt and clay contents.
Results and discussion
Practical example
The site is located in the plain of the Atoyac River, on the outskirts of the Oaxaca City, Oax., sothern Mexico, showing a dry and sandy-loam soil.
Through in-field application of ERT and WRM methods, a section of the clay content, porosity and CEC is obtained for each profile. On this same transect, samples at different depths are taken to obtain in the lab the petrophysical parameters using the SRM method. The clay content estimation obtained through both ways is compared among them, and also checked against the values of the petrophysical parameters obtained in the laboratory for the same soil samples by using Bouyoucos technique.
Application of WRM
A groundwater sample was collected from a well located a few meters away from the site. Using a portable resistivimeter Hanna HI98130 and applying equation (1), a groundwater resistivity value of 3.2 Ohm.m was obtained, corresponding, according to the equation (3), to a salinity value of 1.9 gl-1. The depth of the water table was 10.3 m, which, along with the sandy texture of the soil (high permeability), explains its low moisture. The calculated salinity value was used in the petrophysical modeling process (software PetroWin) for determining the soil petrophysical parameters.
Application of ERT
ERT measurements were carried out along four profiles (P1 to P4), each 50 m long. At each ERT survey, five measurements were performed for spacings of the current electrodes AB/2 = 0.5, 1, 1.5, 2, 2.5 and 3 m, assuring a study depth of 1.5 m. The distance between the VES survey was 5 m. The distance between the profiles P2, P3 and P4 was 5 m, while between profiles P1 and P2 the separation started around 5 m at X = 0 m and reached a maximal separation of 7.5 m at X = 50 m. Each profile has 11 VES points, so the total number of measurement points was 44.
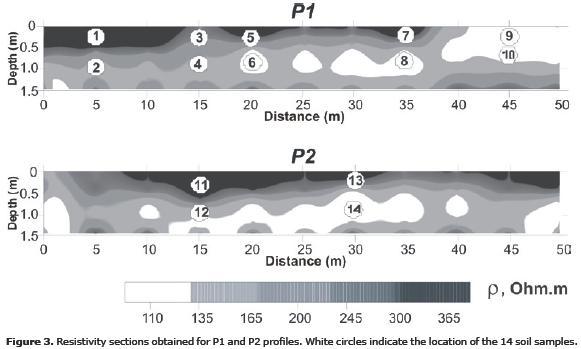
The ERT profiles were subjected to a two-dimensional inversion process using software Res2DInv (Loke and Barker, 1996a). Figure 3 shows the inverted sections for profiles P1 and P2. In general, there are high values of resistivity (ρ > 100 Ohm.m) in two sections (Figure 3) indicating not only the low soil moisture in situ, but also it a low clay content. Probably the clay content is higher in the relatively conductive layer observed in both sections between 0.7 m and 1.2 m of depth.
Application of SRM
Fourteen soil samples were collected at different depths (Table 1) along profiles P1 and P2 taking into account the geoelectric sections (Figure 3). Soil samples were analyzed in lab applying respectively Bouyoucos and SRM methods.
The content of sand, clay and silt was determined for each soil sample through the application of Bouyoucos method. The obtained results were placed in the textural triangle (Figure 4), noting the predominance of the sandy loam and loamy sand soils in the study area.
Table 1 shows the clay content determined by both methods, showing a strong similarity between them.
The graph in Figure 5 shows the good correspondence between clay content quantity estimated by both techniques (Bouyoucos and SRM) based on linear regression analysis. The linear equation is close to the identity function (Y = X), with a low dispersion (coefficient of determination, R2, equal to 0.93).
Determination of petrophysical sections
Geoelectrical sections were converted to petrophysical parameters sections using software PetroWin, taking into account the salinity of groundwater and estimating a soil moisture percent down to a depth of 1.5 m.
Figure 6 shows sections of clay content for profiles P1 and P2, with a notable increase of clay content in profile P2 in an intermediate layer between 0.5 m and 1.2 m. For the sake of comparison, the estimated values of clay content at the same soil sampling points are used, whose values are shown in Table 2.

Among the values determined by ERT & WRM and Bouyoucos techniques (Table 2), notable differences were observed in samples 1, 2 and 7. Regression analysis (Figure 7) shows that, although there is a line of best fit very close to the identity function Y = X, the dispersion of the values (R2= 0.7) is higher than in the case of the correlation between Bouyoucos and SRM techniques. This is due to ignoring the soil moisture at the time of measurements with ERT, leading to a source of error in clay content estimation. In the case of the SRM technique, the total saturation of the soil sample in the lab, as a requirement before making electrical measurements, eliminates this source of error.
Determination of petrophysical maps
Taking into account the resistivity behavior in sections of the Figure 3, two maps were drawn for depths 0.5 m and 1 m (Figure 8), showing that at depth 0.5 m (Figure 8A) there are values of resistivity higher than at 1 m of depth (Figure 8B).
This result confirms the likely increase in clay content with depth, which is reflected in the decreasing of resistivity values in the central part of the study site (Figure 8B).
Maps of clay content, porosity and CEC are shown in Figure 9 for depths 0.5 m and 1 m. For both depths, an increase of clay content (Figure 9 A and D) apparently yields a decrease in porosity (Figure 9 B and E). This is because when the clay fraction is less than the sand porosity, the clay particles (which have an average radius much smaller than that of the sand grains) will fit within the sand pores and will not change the sand structure. When the clay fraction exceeds the sand porosity, the sand grains become suspended in the clay host (Shevnin et al., 2007).
The behavior of the CEC (Figure 9 C and F) is also controlled by the behavior of clay content: higher clay content yields higher CEC, both reaching their highest values at a depth of 1 m (Figure 9F).
Conclusions
An estimation of clay content, porosity and CEC can be obtained by applying geoelectrical techniques and subsequent petrophysical modeling process, and their values are comparable to those determined by traditional techniques of texture analysis (Bouyoucos).
The results obtained in the sandy-loam site demonstrated that both ERT & WRM and SRM techniques are efficient for obtaining the petrophysical parameters, showing the SRM technique a higher accuracy.
The ERT & WRM technique has higher productivity than the SRM technique, allowing the estimation of clay content, porosity and CEC in large tracts of land, with low cost, in a short time. Given this goal, we recommend the use of ERT to ensure the detailed study of the range of 0 to 0.5 m deep, or use the faster electromagnetic profiling method for studying at a maximum depth of 0.75 m (e.g., Geonics EM38 equipment).
These results define a new application of geoelectrical methods for PF studies: The determination of clay content, porosity and CEC in an accurate, quick and inexpensive way.
Bibliography
Beklemishev A.V., 1963, Measures and units of physical values. Fizmatgiz, 296 pp. (In Russian). [ Links ]
Bouyoucos G.J., 1936, Directions for Making Mechanical Analysis of Soils by the Hydrometer Method. Soil Science, 42, 3, 225-228. [ Links ]
Bussian A.E., 1983, Electrical conductance in a porous medium. Geophysics, 48, 1258-1268. [ Links ]
Delgado-Rodríguez O., Shevnin V., Ochoa-Valdés J., Ryjov A., 2006, Geoelectrical characterization of a site with hydrocarbon contamination caused by pipeline leakage. Geofísica Internacional, 45, 1, 63-72. [ Links ]
Keller G., Frischknecht F., 1966, Electrical Methods in Geophysical Prospecting, Pergamon Press Inc., Oxford. [ Links ]
Loke M.H., Barker R.D., 1996a, Rapid least-squares inversion of apparent resistivity pseudosections by a quasi-Newton method. Geophysical Prospecting, 44, 131-152. [ Links ]
Loke M.H., Barker R.D., 1996b, Practical techniques for 3D resistivity surveys and data inversion. Geophysical Prospecting, 44, 499-523. [ Links ]
McKenzie R.C., Chomistek W., Clark N.F., 1989, Conversion of electromagnetic induction readings to saturated paste extract values in soils for different temperature, texture, and moisture conditions. Canadian Journal of Soil Science, 69, 25-32. [ Links ]
Pascual A, Delgado O, Fuentes N (1995) Determinación de la conductividad eléctrica equivalente de los suelos de la República de Cuba, Geofísica Internacional, 34, 2, 233-237. [ Links ]
Robert P.C., 2002, Precision agriculture: a challenge for crop nutrition management, Plant and Soil, 247, 143-149. [ Links ]
Ryjov A., Shevnin V., 2002, Theoretical calculation of rocks electrical resistivity and some examples of algorithm's application. SAGEEP proceedings, P2, 10 pp. [ Links ]
Ryjov A., Sudoplatov A.D., 1990, The calculation of specific electrical conductivity for sandy - clayed rocks and the usage of functional cross-plots for the decision of hydro-geological problems. // In "Scientific and technical achievements and advanced experience in the field of geology and mineral deposits research, Moscow, 27-41. (In Russian). [ Links ]
Sudduth K.A., Drummond S.T., Kitchen N.R., 2000, Measuring and interpreting soil electrical conductivity for precision agriculture. Second International Geospatial Information in Agriculture and Forestry Conference, Lake Buena Vista, Florida. [ Links ]
Shevnin V., Delgado-Rodríguez O., Mousatov A., Flores-Hernández D., Zegarra-Martínez H., Ryjov A., 2006, Estimation of soil petrophysical parameters from resistivity data: their application for oil contaminated sites characterization. Geofísica Internacional, 45, 3, 179-193. [ Links ]
Shevnin V., Mousatov A., Ryjov A., Delgado-Rodríguez O., 2007, Estimation of clay content in soil based on resistivity modeling and laboratory measurements. Geophysical Prospecting, 55, 265-275. [ Links ]
Sorensen J.A., Glass G.E., 1987, Ion and Temperature Dependence of Electrical Conductance for Natural Waters. Anal. Chem., 59, 1594-1597. [ Links ]
Williams B.G., Baker G.C., 1982, An electromagnetic induction technique for reconnaissance surveys of soil salinity hazards. Australian Journal of Soil Research, 20,107-118. [ Links ]
Wyllie M.R.J., Southwick P.F., 1954, An experimental investigation of the SP and resistivity phenomena in dirty sands. Journal of Petroleum Technology, 6, 44-57. [ Links ]
Nota
Abridged Title: Soil petrophysical parameters based on electrical resistivity

