


Serviços Personalizados
Journal
Artigo
 Inglês (pdf)
 Artigo em XML
 Referências do artigo
 Enviar este artigo por email
Indicadores
-
 Citado por SciELO
 -
 Acessos
Links relacionados
-
 Similares em
SciELO
Similares em
SciELO
Compartilhar

 Permalink
Geofísica internacional
versão On-line ISSN 2954-436Xversão impressa ISSN 0016-7169
Geofís. Intl vol.50 no.4 Ciudad de México Out./Dez. 2011
Original paper
The Thar, Rajputana desert unprecedented rainfall in 2006 and 2010: effect of climate change?
Vadlamudi Brahmananda Rao1*, Egidio Arai2, Sergio H. Franchito2, Yosio E. Shimabukuro2, S.S.V.S. Ramakrishna3 and C.V. Naidu3
1 Instituto Nacional de Pesquisas Espaciais, INPE São José dos Campos C.P. 515, 12.245–970 SP, Brazil, Telephone: 55–12–39456649, Department of Meteorology and Oceanography Andhra University Visakhapatnam, India. *Corresponding author: vadlamudi.rao@cptec.inpe
2 Instituto Nacional de Pesquisas Espaciais, INPE São José dos Campos S.P, Brazil.
3 Department of Meteorology and Oceanography Andhra University Visakhapatnam, India.
Received: April 28, 2010.
Accepted: June 6, 2011.
Published on line: September 30, 2011.
Resumen
En agosto de 2006 la región de Rajasthan registró lluvias excepcionalmente intensas que provocaron severas inundaciones. También, en la temporada del monzón de 2010 Rajasthan recibió fuertes lluvias, aunque no superiores a las de agosto de 2006. Pero los altos valores de precipitación en el año 2010 se produjeron durante toda la temporada del monzón. En el 2006 varias estaciones registraron lluvias intensas de alrededor de 125 mm en 24 horas. Un estudio reciente mostró que, en el futuro, eventos extremos similares tenderán a ocurrir en la India Central, que incluye una parte de Rajasthan. En este trabajo estos eventos son estudiados en el contexto de un probable cambio climatico sobre esta región usando datos de satélites. Para ello fueron usados los índices de vegetación NDVI (Normalized Difference Vegetation Index) y EVI (Enhanced Vegetation Index), derivados del MODIS (Moderate Resolution Imaging Spectroradiometer) y los datos de precipitación del satélite TRMM (Tropical Rainfall Measuring Mission) para 11 años (2000–2010). Ambos productos NDVI y EVI revelaron un crecimiento exuberante de la vegetación sobre el desierto de Rajputana en setiembre de 2006 y en agosto y setiembre de 2010. El análisis de los datos de precipitación y EVI confirmó el crecimiento de la vegetación en 2006 y 2010, mostrando la utilidad de los datos obtenidos por satélite en la captura de los cambios en esta región. En algunos estudios previos se ha señalado que la lluvia sobre la región Oeste de Rajasthan durante la temporada del monzón muestra una importante tendencia creciente. Así, en el futuro, el crecimiento de la vegetación en el desierto Rajputana parece ser muy posible.
Palabras clave: cambio climático, desierto de Rajputana, inundaciones en 2006, EVI, MODIS.
Abstract
Rajasthan, India/Pakistan, recorded heavy rainfall in August 2006. This unusual event led to severe floods. In the monsoon season of 2010 there was also high rainfall, but not as heavy as in August 2006. The high rainfall in 2010 occurred during the entire monsoon season, but in 2006 several stations registered very heavy downpour of about 125 mm in 24 hours. A recent study showed that in the future similar extreme events may tend to occur in central India, which includes a part of Rajasthan. These events are studied in the context of a probable climate change using satellite data. The MODIS (MODerate resolution Imaging Spectroradiometer) vegetation indices (NDVI, Normalized Difference Vegetation Index and EVI, Enhanced Vegetation Index) and precipitation data from TRMM (Tropical Rainfall Measuring Mission) satellite for 11 years (2000 through 2010) were used. Both NDVI and EVI MODIS (MOD13) revealed unusual growth of vegetation in September 2006 and August and September 2010 over the Rajputana desert. The analysis of rainfall and EVI data confirmed the growth of vegetation in 2006 and 2010, showing the utility of satellite data in capturing changes in this region. Some earlier studies found that the rainfall over West Rajasthan during the monsoon season showed a significant increasing tendency. Thus in the future, a rising tendency of vegetation growth in Rajputana desert seems to be highly plausible.
Key words: climate change, Rajputana desert, Floods in 2006, EVI, MODIS.
Introduction
One can argue whether the recent observed climate change is natural or anthropogenic. But the mounting observational evidence seems to convince skeptics that man is inadvertently changing the climate. In a recent study (Goswami et al., 2006), it has been shown that the number of extreme rainfall events (>110 mm/ day) over central India (74.5o –86.5o E and 16.5o – 26.0o N) have increased during the 1951–2000 period. This seems to be the result of a warming environment associated with higher atmospheric moisture content that triggers the convective instability systems and causes extreme rainfall events (Goswami et al., 2006).
In the 2006 monsoon season (June to September), the Rajasthan desert region experienced unprecedented heavy rainfall events which led to severe floods and intense human suffering. Unconfirmed sources mentioned that 138 people lost their lives and the property damage up to the end of August was about 366 million dollars.
The objective of this paper is to study this event using satellite data and examine how rainfall affected vegetation. For this, the MODIS (MODerate resolution Imaging Spectroradiometer) vegetation indices (NDVI, Normalized Difference Vegetation Index and EVI, Enhanced Vegetation Index) and precipitation data from TRMM (Tropical Rainfall Measuring Mission) satellite were used.
Material and Methods
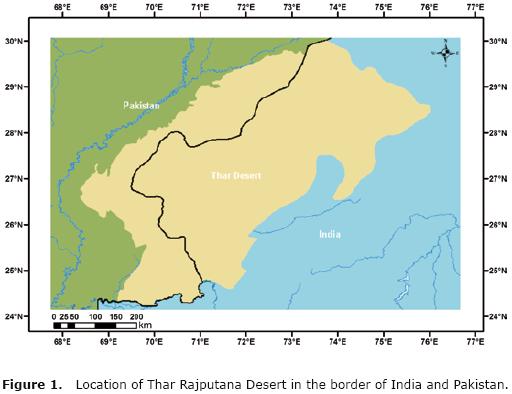
The study area selected for this study is the Great Indian Desert, also called Thar Desert. This desert is located in two countries: Republics of India and Pakistan. Most of the area of this inhospitable desert is in the Rajasthan state in western India and the other part is located in southeastern Pakistan (Figure 1).
This work utilized the land product MOD13 from MODIS sensor, obtained from National Aeronautic and Space Administration (NASA) at the site http://edcimswww.cr.usgs.gov/pub/imswelcome. This product was derived from data obtained by MODIS sensor on board the Earth Observing System (EOS) – Terra platform launched in December 1999.
MOD13A3 is a vegetation index product with 1 km spatial resolution and is a composite of monthly observations. The composition of the mosaics is done by taking the highest vegetation index value which minimizes the effect of several factors (cloud cover, geometry of data acquisition, etc.). The product MOD13 includes two vegetation indices: Normalized Difference Vegetation Index (NDVI) and Enhanced Vegetation Index (EVI) (Huete et al., 2002) and also the original bands that generated them.
Vegetation Indices (VI) are designed and produced routinely to study the global distribution of vegetation types and their spatial and temporal variations. The VI are successful as vegetation measures and are sufficiently stable to permit meaningful comparisons of seasonal and inter–annual changes in vegetation growth and activity. The EVI was found to perform well in a heavy aerosol conditions (Miura et al., 1998). Thus the EVI may be useful in a desert atmosphere. The VI images are produced globally over land at 1 km, 500 m and 250 m spatial resolutions and 16 day and monthly compositing periods.
The Enhanced Vegetation Index (EVI) was developed to optimize the vegetation signal with improved sensitivity and improved vegetation monitoring through a de–coupling of the canopy background signal and a reduction in atmosphere influences (Huete et al., 2002).
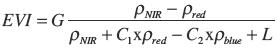
where G = 2.5, C1 = 6, C2 = 7.5 and L = 1. The meaning of the symbols is given in Huete et al. (2002).
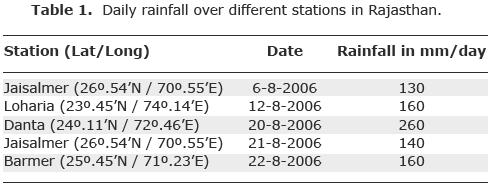
On 21st and 22nd August 2006, the Barmer station (25° 45' N, 71° 23' E) situated in the meteorological subdivision of West Rajasthan (Parthasarathy et al. , 1995) received rainfall of 120 and 160 mm respectively (Climate Diagnostics Bulletin of India, 2006). This rainfall is a record for the month of August since 1945. West Rajasthan received monthly a rainfall of more than twice, 202.9 mm of its normal for August (93.6 mm). East Rajasthan also received good amounts of rainfall, 319.5 mm. The departure from normal (232.9 mm) was 37% of normal. The weekly (17th to 23rd August) rainfall anomaly over West Rajasthan was 367% above normal. The observed rainfall in this week was 99 mm which is almost 5 times the normal of 21 mm.
Table 1 shows very heavy rainfall events according to India Meteorological Department (> 125 mm in 24 hrs over Rajasthan). These rainfall episodes fall into the category of extreme events (Goswami et al., 2006) noted for Central India that includes part of Rajasthan state and thus seem to be due to a warming environment. In August 2006 three monsoon depressions formed over Bay of Bengal and moved in a westerly and west–north–westerly direction. They had long tracks across Central India and moved up to West Rajasthan as remnants. Each of these depressions weakened to a low pressure system when reached east Rajasthan. One system even reached west Rajasthan. These seem to have triggered the convective instability and provoked the intense rainfall events mentioned earlier over Rajasthan leading to floods. In 2010 also Rajasthan received high rainfall.
Other source of precipitation is provided by TRMM (Tropical Rainfall Measuring Mission) satellite launched on November 27, 1997. TRMM is a joint U.S. and Japan satellite mission to monitor tropical and subtropical precipitation from 40o S to 40o N. The TRMM 3B43 product contains the "TRMM and Other Data" best–estimate precipitation rate (Liu et al., 2002). These gridded estimates are on calendar month with 0.25 x 0.25 degree of spatial resolution.
Results
Figure 2 shows the evergreen vegetation, bare soil, and fresh vegetation land covers samples selected for helping this analysis. Evergreen vegetation corresponds to dense vegetation, soil corresponds to bare soil areas, and fresh vegetation corresponds to the areas of regenerating vegetation occurred due to precipitation increases.
Figure 3 shows the spectral responses for August and September of 2000 to 2006 (except 2003), for the corresponding land cover samples as marked in Figure 2. In Figure 3, it can be seen that evergreen vegetation and bare soil classes presented consistent spectral responses for all years, while fresh vegetation class presented spectral response like soil in 2004 and 2005 years and spectral response like vegetation in 2006. It means that vegetation has been generated during 2006 due to the increase of precipitation in the study area.
Figure 4 shows the rainfall for 11 years. It can be seen that in the months of July and August of years 2001 and 2003 the precipitation was higher than in years 2000, 2002 and 2004. Also the high precipitation in the month of August of 2006 can be seen. The high rainfall in the entire monsoon season (June to September) is seen in 2010. Also the rainfall in 2006 is high compared to the monthly rainfall of the entire period. This data set used is from TRMM 3B43 product in the latitude 27.25o N and longitude 70.75o E, that correspond to the location of fresh vegetation land cover sample (Figure 2).
The intense rainfall events and the associated flash floods increase the soil moisture over a relatively larger region and this increase of soil moisture helps the growth of vegetation. The intense rainfall in August 2006 and in the monsoon season of 2010 might have generated a vegetation growth which can be observed by the MODIS sensor.
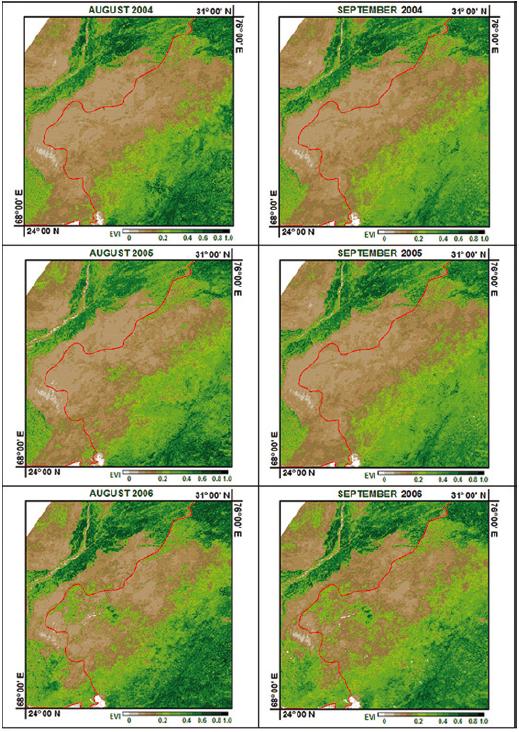
Figure 5 shows the EVI over the Thar Desert (both India and Pakistan side) for the month of August and September for the years 2000, 2001, 2002, 2004, 2005, 2006 and 2010. The VI monthly products (MOD13A3) are not available for the year 2003. In September 2006 which is the month after the heavy rainfall events of August, the EVI shows the exuberant vegetation coverage. The EVI like other vegetation indices is a measure of vegetation greenness. Thus, increased values of EVI indicate the vegetation cover density.
Figure 5 clearly shows the high EVI values for 2006 showing an exuberant vegetation coverage in the midst of the Rajputana Desert which is very unusual. In 2001 EVI image shows some vegetation coverage in the border of the Rajputana Desert and agrees with the precipitation graph (Figure 4) that shows greater precipitation in this year and 2003 (not available). In the 2002 and 2004 EVI image no vegetation was seen while in the 2000 and 2005 EVI image only traces of vegetation were seen in this study region. Whether a similar growth of vegetation occurs in the recent years is an interesting question. Indeed, in August and September 2010 exuberant vegetation can be seen in Figure 5 as indicated by high values of EVI. This is clearly due to the high precipitation in the monsoon season of 2010. In an earlier study (Pant and Hingane, 1988) an increasing trend of 141.3 mm of rainfall per 100 years was observed over Northwest India including West Rajasthan during the summer monsoon season. The trend over West Rajasthan is significant at 99% level by 't' test. A similar increasing trend of rainfall was also observed for Northwest India in another study (Rupa Kumar et al., 1992). This information put together with the recently found increase of heavy rainfall events (Goswami et al., 2006) suggests that in a continued warming environment the increase of vegetation over West Rajasthan is highly probable.
In the image of EVI of 2001 it shows some vegetation in the edge of the desert and agrees to the precipitation graph that shows greater precipitation in this year and 2003 (not available).
Conclusions
The TRMM satellite data shows the increase of precipitation for the month of August of 2006 compared to previous years in the Rajputana desert areas. Also in the recent year 2010 in the monsoon months of June, July, August and September the rainfall was high. The intense rainfall in August 2006 and June, July, August and September of 2010 generated a vegetation growth which was observed by the EVI images derived from MODIS sensor. A careful analysis of vegetation index from MODIS sensor and TRMM rainfall data for eleven years confirmed the vegetation growth and increase of rainfall both in 2006 and 2010. This shows the utility of satellite products in detecting the climate change in this region.
The recently found increase of heavy rainfall events by Goswami and others (2006) suggests that in a continued warming environment the increase of vegetation over West Rajasthan is highly probable.
Bibliography
Climate Diagnostics Bulletin of India, August 2006, Near Real – Time Analyses, National Climate Centre, India Meteorological Department, Government of India. [ Links ]
Goswami B.N., Venugopal V., Sengupta D., Madhusoodanan M.S., Xavier P.K., 2006, Increasing trend of extreme rain events over India in a warming environment. Science 314: 1,442–1,445. [ Links ]
Huete A., Didan K., Miura T., Rodríguez E., 2002, Overview of the radiometric and biophysical performance of the MODIS vegetation indices. Remote Sensing of Environment 83: 195–213. [ Links ]
Liu Z., Chiu L., Rui H., Teng W., Serifino G., 2002, Online analysis and visualization of TRMM and other precipitation data sets. The 18th International Conference on Interactive Information and Processing System (IIPS) for Meteorology, Oceanography, and Hydrology, Orlando, Florida, American Meteorology Society. [ Links ]
Miura T., Huete A.R., Van Leeuwen W.J.D., Didan K., 1998, Vegetation detection through smoke–filled AVIRIS images: an assessments using MODIS band passes. J. Geophys. Res. 103: 32,001–32,011. [ Links ]
Pant G.B., Hingane L.S., 1988, Climatic changes in and around the Rajasthan desert during the 20th century. J. Climatol. 8: 391–401. [ Links ]
Parthasarathy B., Munot A.A., Kothawale D.R., 1995, Monthly and seasonal rainfall series for all–India homogeneous regions and Meteorological sub–divisions: 1,871–1,994. Res. Rep. No. 65. [ Links ]
Rupa Kumar K., Pant G.B., Parthasarathy B., Sontakke N.A., 1992, Spatial and subseasonal patterns of the long–term trends of Indian summer monsoon rainfall. Int .J .Clim., 12: 257–268. [ Links ]

