


Servicios Personalizados
Revista

Articulo
 Inglés (pdf)
 Artículo en XML
 Referencias del artículo
 Enviar artículo por email
Indicadores
 Citado por SciELO
 Links relacionados
-
 Similares en
SciELO
Similares en
SciELO
Compartir

 Permalink
Geofísica internacional
versión On-line ISSN 2954-436Xversión impresa ISSN 0016-7169
Geofís. Intl vol.50 no.3 Ciudad de México jul./sep. 2011
Artículo original
Microtremor studies using the SPAC method: Experiences and applications to four sites in Mexico
Ricardo Vázquez Rosas1*, Jorge Aguirre2, Hortencia Flores Estrella3 and Horacio Mijares Arellano4
1 Instituto de Ingeniería, Universidad Nacional Autónoma de México, Ciudad Universitaria, Coyoacán, 04510. México D.F. *Correspondig author: rvazquezrunam@gmail.com
2 Instituto de Ingeniería, Universidad Nacional Autónoma de México, Ciudad Universitaria, Coyoacán, 04510, México D.F.
3 Institut für Geowissenschaften Friedrich Schiller Universitát Jena, Germany.
4 Instituto de Ingeniería, Universidad Nacional Autónoma de México, Ciudad Universitaria, Coyoacán, 04510, México D.F.
Received: August 10, 2010
accepted: February 1, 2011
published on line: June 30, 2011
Resumen
El registro y los análisis de microtremores es hoy en día una parte fundamental en la evaluación del riesgo sísmico. En este trabajo se discute la aplicabilidad y resultados con el método de Autocorrelación Espacial (SPAC), que permite obtener un modelo de velocidad sitio, así como la estimación del modelo propagación de ondas ID, complementarla estimación de la respuesta de sitio.
Hemos trabajado en cuatro ciudades de México con diferentes condiciones urbanas, geológicas de los sitios. También los objetivos y necesidades de cada estudio en particular son diferentes. Esto afecta a la distribución de los arreglos espaciales así como la resolución de profundidad para el método SPAC. Aquí analizamos estos estudios y sus resultados correspondientes. Con base en estos resultados podemos concluir que es posible caracterizar los efectos de sitio y la respuesta de sitio usando incluso arreglos lineales y, dependiendo de las condiciones geológicas, también es posible explorar las capas profundas.
Palabras clave: microtemores, elipticidad, SPAC, ondas superficiales, fase de velocidad.
Abstract
Recording and analysis of microtremors is used in seismic risk evaluation. We discuss the applicability and results for the Spatial Autocorrelation Method (SPAC), which estimates a site velocity model for ID propagation wave modeling and more complete site response estimation.
We present results for four Mexican cities with different spatial, urban and geological conditions. The purpose and requirements are different for each particular study. This affects the spatial array settings and the depth resolution for the SPAC method. We discuss these studies and their corresponding results. We conclude that it is possible to characterize site effects and site response using small linear arrays. Depending on the geological conditions, it is possible to reach deep layers.
Key words: microtremors, ellipticity, SPAC, surface waves, velocity phase.
Introduction
Microtremors, also known as microseisms, seismic background noise, or micro-trepidations, may be defined as a superposition of surface wave modes on a stationary and homogeneous field surface. Aguirre-González et al. (2001) describe microtremors as noise generated by natural or cultural sources, including traffic or human activity, that may provide information about the subsoil velocity model.
The recording and analysis of microtremors has become a key part of seismic risk evaluation studies. A common approach is to obtain the site fundamental period by means of the H/V spectral ratio technique (Nakamura, 1989). However, the theoretical basis of this technique is still controversial. Another way to estimate the site response is by modeling the wave propagation with a velocity model, which can be obtained from the analysis of microtremor recordings with the Spatial Autocorrelation Method SPAC (Aki, 1957).
Bard (1998) mentions some of the advantages of using microtremor recordings: (a) they can be measured anywhere and anytime, (b) the instruments needed to record them are simple, and (c) their measurement does not involve any environmental problems.
Regarding the sources that produce microtremors, Bard (1998) mentions that long period frequencies (less than 0.3 to 0.5 Hz) are caused by oceanic waves at long distances. At intermediate periods (frequencies between 0.3-0.5Hz and 1Hz) microtremor sources are linked to sea waves near coasts, though their stability is significantly lower. For shorter periods (frequencies higher than 1Hz) the microtremor sources are related to human activity.
Some studies have reported that site effects estimations obtained from microtremor records are similar to those obtained from strong motion records (Gutiérrez and Singh 1992; Lermo etal., 1998). Bard (1998) concluded that H/V ratios are useful to predict the dominant frequency but often underestimate the amplification factor.
On the other hand, other methods of analysis focus on the velocity model estimation. The SPAC method (Aki, 1957) is one of such methods which proves to be quite successful, compared to traditional methods (e.g. refraction, reflection, borehole logging), in determining the velocity structure. It yields data on the dynamic characteristics (shear wave velocity Vs) of relatively superficial layers and can be used for seismic risk studies. The SPAC method is also appropriate in urban areas. Spatial array setting requirements have been a major limitation of SPAC due to the geometry of urban zones (Vázquez Rosas et al., 2005), but we will see how a linear array can solve this geometry issue.
In this study we present some field experience and results using ambient vibration measurements in different states, including Colima, Michoacán, two sites in the Valley of Mexico and Monterrey City. Michoacán and Colima are located in seismogenic zones with the highest activity in the country. The valley of Mexico is far from the subduction zone, but local site conditions increase the seismic hazard. At Monterrey City, the hazard is associated with a passive seismic potential and with the geodynamic context of the Sierra Madre. In the next sections, after a brief explanation of the SPAC method, we discuss the microtremor studies at these four locations.
The Spac Method
Aki (1957, 1965) examined the possibility of a multiple dispersive wave field, that is, wave propagation in all directions. He proposed the Spatial Autocorrelatios Method (SPAC). The essence of SPAC is that, when microtremors are recorded by an array of equidistant stations forming pairs at varying azimuth, it is possible to estimate the phase velocity from surface wave observations without considering their direction of propagation. This is possible because we assume that the dispersive wave field propagates along a free surface and that it is stationary and stochastic in time and space. It is important to verify that these conditions are fulfilled. The method requires at least three stations.
Following the process described below, the dispersion curve for Rayleigh waves can be obtained and then used to determine the velocity structure. Under the assumption of a stationary and stochastic wavefield it is possible to work with data from linear arrays, obtaining good results.
Following Aki (1957) we consider a stochastic wavefield formed by the superposition of many non-polarized plane waves propagating in many directions in the horizontal plane, all of them propagating with the same constant phase velocity . The ground motion at two locations on the surface (x,y) and (x+ξ,y+η) may be written as u(x, y, t) and u(x+ξ,y+η), t). The spatial autocorrelation function Φ(ξ,η, t) for the 2D case (see Aki, 1957) is defined as
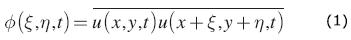
where  stands for the mean value of u(t) over the time domain. Assuming that the wavefield is composed by stationary stochastic waves, and replacing (ξ, η) by the polar coordinate , Aki (1957) showed that the azimuthal average of the spatial autocorrelation function (Aki, 1957) can be written as

where r and Ψ are the polar coordinates defined by ξ=r cos Ψ and η=r sin Ψ.
Aki (1957) showed that the azimuthal average of the spatial autocorrelation function  and the power spectral density Φ((ω) of the wavefield u, where (ω) is angular frequency, are related as follows (Aki, 1957):

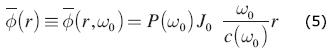
where J0 is the zero-order Bessel function. Equation (3) also applies to the case of dispersive waves as shown in Aki (1957). We only need to substitute c((ω) by c. Consider now that we apply a bandpass filter to the signals. The spectral density becomes:

where P(ω0)is the power spectral density at the frequency (ω0 and δ(ω) is the Dirac function. In this case, the azimuthal average of the spatial correlation function (Aki, 1957) can be written as
According to Aki (1957) the autocorrelation coefficient can be defined as

As P(ω0) does not depend on position, we may write the azimuthal average of the spatial correlation coefficient as

The detailed derivation may be found in Aki (1957) or in Chavez-Garcia et al.(2005). The SPAC coefficient p(r,ω), may be obtained in the frequency domain using the Fourier transform of the observed microtremors:
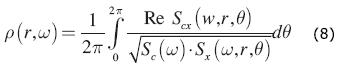
where Re[arg] is the real part of the complex argument, Sc(ω) and Sx(ω,r,θ) are the power spectral densities of microtremors at sites C and X respectively, and Scx(ω,r,θ) is the cross spectrum between ground motions at the two sites.
In conclusion, the SPAC coefficients may be obtained by averaging the normalized coherence function defined as the co-spectrum between points C and X in the direction θ.
From the SPAC coefficient p(r,ω), the phase velocity is obtained for each frequency for the Bessel function argument of equation (7), where c(f) phase velocity at frequency f. We obtain the optimum value for c(f) using a grid search. The preceding formulation was presented in great detail in Morikawa et at. (1998 and 2004) and also in Flores-Estrella (2004). Further valuable information on this problem may be found in Malischewsky (1987).
Study sites
We have used the SPAC method at four different urban sites in Mexico. The objective at each site was different and so were the spatial and geological conditions. We have used the same instruments in all sites: broadband CGMT40 sensors, sometimes plugged into REFTEK digitizers and sometimes using a K2 as digitizer. At some sites we used traditional seismic refraction equipment with 4.5 Hz sensors in a linear array to compare results and resolution between triangular and linear arrays, as Chávez-García etal. (2005) had suggested that the SPAC method could be used without restrictions on the array geometry. This can be important when working in highly urbanized areas.
In most cases the broadband sensors recorded 30 min of continuous noise. Then we used 81.92 s windows, previously tapered using a Hanning window, to compute cross correlations. We kept only those results with the best correlation coefficients. From these curves we obtained the phase velocities for each array. We refer to this analysis as "standard" SPAC analysis, as it uses triangular array data to obtain the phase velocity. For experiments with 4.5 Hz sensors we used the same methodology with 25 s width windows.
On Figure 1 we show the location of the sites discussed in this paper. The corresponding table provides the information for each location. In every case we proposed an initial velocity model based on the geological conditions and the final velocity model was obtained by trial and error by fitting the theoretical dispersion curve to the observed one.

Case 1: Colima
Colima state is located on the Mexican Pacific coast. It has suffered several important earthquakes (Manzanillo, 1995, Ms 7.3; Tecomán, 2003, Mw 7.6) as it is located in one of the most important seismogenic zones. Seismic risk studies are important and microtremor studies are well suited for this purpose.
We used the SPAC method in 5 cities of Colima state using broadband seismometers distributed in triangular arrays. We recorded microtremors using 12 sensors (4.5 Hz), with 5 m spacing between them, along a linear array. Here we show only the result for the Santa Barbara site (Figure 2).

For the broadband data we used 21 windows with a width of 81.92 s. For each window we computed the cross-correlation coefficients between pairs of stations, and we selected the windows yielding the best correlation results (i.e., near unity, Figure 3 A). The SPAC coefficient was obtained by averaging the three different directions according to equation (8) (Figure 3 B). We obtained the dispersion curve for Rayleigh waves using the contributions of different bandwidths constructed for each array, depending on the distance between stations. In this case the array apertures are 5, 15, 30 and 60 m (Figure 3 C).
Figure 3 D compares the results obtained from standard SPAC analysis with a linear array. The heavy line refers to the phase velocity from SPAC method, and symbols or standard deviation bars correspond to results obtained for linear arrays. The results are consistent in both cases for a range frequencies of 5 up to 15 Hz (Figure 3 D).
Table 1 shows the shear wave (Vs) velocity model obtained for the triangular arrays. Shear wave velocities of superficial layers vary between 230 and 500 m/s and are in good agreement with the borehole logging data available at Santa Barbara (CENAPRED, 2003).

Case 2: Michoacán
In the state of Michoacán we studied site effects in four cities: Uruapan, Zamora, Maravatio and Pátzcuaro. These four cities are located in high seismic hazard zones due to the short distance to the Pacific trench. We conducted microtremor array measurements to obtain a microzonation map for each city (Vázquez Rosas et al. 2005). Depending on the size of the city we used equilateral triangle arrays with 1 km distance between stations in such a way as to cover the total urban area. After obtaining isoperiod maps, the data sets allowed us to use the SPAC method.
Here we show results of the SPAC analysis for the cities of Uruapan and Zamora. We measured microtremors in 18 arrays in Uruapan and 10 arrays in Zamora using continuous recording during 30 minutes. In each case we used as many arrays as needed to cover the whole city.
Figure 4 shows the isoperiod map for Uruapan and the distribution of the instrumental arrays. The dispersion curve was obtained with data from 8 arrays (number 1, 2, 4, 5, 8, 9, 7, and 14). In Figure 5 we show the dispersion curves and the inverted models for arrays 2, 5 and 14 using single layer models over a halfspace. For arrays 3, 10, 15, 17 we assumed a similar model to those of nearby arrays because of missing data. We estimated the velocity structure of these sites on the assumption that the lateral layer variations were small as compared to the thicknesses we were dealing with. Thickness, density and shear wave velocity as obtained from inversion for each array are shown in table 2.

In Zamora city we used triangular arrays of 1 km with 900 m spacing between stations (Figure 6). As in Uruapan, we used a model of a single layer over a halfspace. The shear velocities for the eight arrays vary between 780 m/s and 2400 m/s for the surface layer and the thicknesses vary between 295 m and 800 m (Figure 7). With these results we may estimate the thickness of the equivalent layer as between 295 m and 800 m as shown in Table 3.
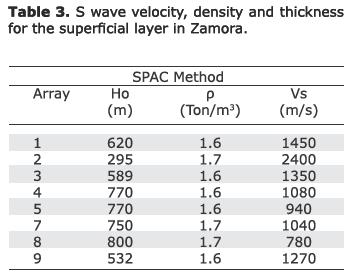
Based on the results of Table 3, the shear wave velocities in arrays 1, 2 and 3 were higher, while the other arrays featured velocities between 780 -1,080 m/s.
Case 3: Mexico Basin
Mexico City is located in a unique geological and structural setting on a volcanic high plateau at about 2,240 m above sea level bounded by volcanic sierras, alluvial fans and plains. The region is subject to natural hazards including floods, volcanic eruptions, and earthquakes. Mexico Basin is the most intensely urbanized area in Mexico and it has been seriously damaged by distant earthquakes where site effects play an important role in the amplification of ground motions.
We studied two sites with similar site conditions, both on Lake sediments. But the studies had different objectives. The first site is Aragón, where the objective was to determine whether the SPAC method could discern small velocity differences from changes in rigidity. The second site is Texcoco Lake where the objective was to determine the velocity structure by means of microtremor array measurements.
Aragón
In order to determine the shear wave velocity structure, we measured microtremors on two sets of arrays at two sites. These sites present similar geological conditions: there is no evidence of strong lateral variation from geotechnical explorations. They were spaced a distance of 170 m (Figure 8). Inclusions had been detected at one of the two sites (site II in Figure 9). Our assumption is that the inclusions may modify the physical characteristics of the layers and the velocity structure detected by the SPAC method may be affected.
At both sites we deployed seven equidistant triangular arrays with 5, 10, 20, 40, 50, 60, and 70 m spacing between stations. We recorded microtremors simultaneously during 30 minutes at each triangle, with a sampling frequency of 100 samples per second. We used 5-second period vertical seismometers. These velocity sensors were connected to the external channels of a K2 that was used to digitalize and record the waveforms at 24 bits. The sensors were placed in small rectangular holes of about 30 cm depth to avoid perturbations caused by wind.
Applying the SPAC method we obtained the dispersion curve and we inverted it by trial and error thus obtaining a shear wave velocity model (Table 4). Figure 10 shows the results, where circles and squares stand for observed dispersion velocities, and continuous lines for computed dispersion curves at sites I and II, respectively.
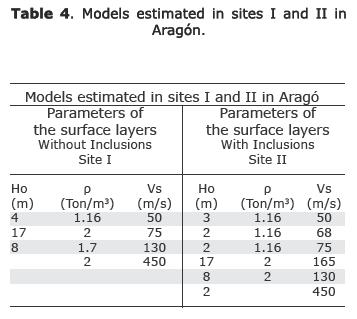
Site I may be modeled by three layers over a half space. The velocity for the first two layers varies between 50 m/s and 75 m/s, a low velocity typical for Mexico Basin clay. The velocity increases to 130 m/sec at 29 m depth. In the half space the velocity increases to 450 m/s. At site II the velocity structure is clearly different. The upper layers is featured by a low velocity between 50 and 75 m/sec but the velocity in the third layer increases to 165 m/s, nearly twice the value found for the site without inclusions.
We assume that the depth where inclusions had been located may be treated as a different layer. This hypothesis was confirmed at site II where the velocity model obtained contains a layer with a thickness of 17 m which agrees with an estimated 19 m thickness of the inclusions. The velocity in this layer was found to be Vs=165 m/s. It is reasonable to assume that the higher rigidity of the inclusions would increase the rigidity of the site, hence the increase in S wave velocity.
On the other hand, the available information suggests that there are no major changes in stratigraphy between sites I and II except for the inclusions. Thus the differences between the two curves in Figure 10 should be due exclusively to the effect of the inclusions. This example demonstrates that the SPAC method is sensitive to a change in contrast caused by the presence or absence of inclusions.
Texcoco Lake
Former Texcoco Lake is located northeast of Mexico City. It was a part of the Mexico Valley lake system. The terrain consists of a thick layer of lacustrine clay, a highly cohesive material with a high water content and Poisson's ratio close to 0.5. This is the same clay found in the Lake Zone of Mexico City (Stephenson and Lomnitz, 2005).
However, the clays in this area are unaltered by urbanization. We performed microtremor measurements with stations spaced between 5 m and 1,000 m as seen in Figure 11 (Flores-Estrella, 2004).

Here analysis with the SPAC method was more complicated, because of the high attenuation of the lacustrine clays which caused the correlation between the records to be lost when the spacing exceeded 100 m. Also, it was known that there is a hard layer near 30 m depth. It appears that this layer may reflect most of the microtremor energy. This makes it very hard to find out about the parameters of the deeper layers.
Figure 12 shows the dispersion curve as obtained from the SPAC method. The dispersion curve shows a strong velocity contrast between the surface and the deepest layers we were able to reach (40 m). Stephenson and Lomnitz (2005) proposed a velocity model for the study area, and our observed dispersion curve is in good agreement.

Case 4: Monterrey
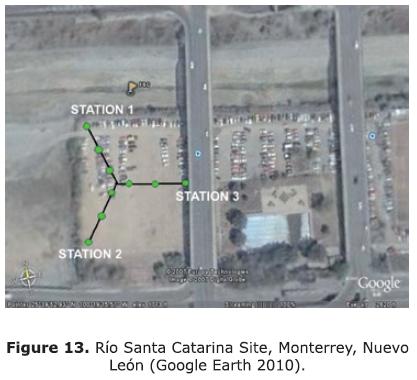
In this case we made measurements at four sites in the city, with a total of 12 equilateral triangular arrays with varying apertures ranging from 7.5 to 280 m. The apertures at each site were 7.5 m and 15 m at site RSC (Rio Santa Catarina), 7 , 15 m and 150 m at site EST (Football Stadium), 27 , 50 , and 150 m at site RM (Colonia Roma), and 15 , 50 , 150 m and 280 m at site PL4V.
Here we present results for Rio Santa Catarina (RSC). In Figure 13 we show the instrumental array. Using the data recorded on this array, the phase velocity dispersion curve was inverted and the velocity structure was estimated. The dispersion curve and the inverted velocity model for RSC are shown in Figure 14. The shear velocities of the surface layers inverted for the four sites in Monterrey city vary between 400 and 725 m/s.
Spectral ratios H/V and ellipticity curves.
The idea of looking at a single station spectral ratio between the horizontal and vertical components was first introduced by Nogoshi and Igarashi (1971). They showed that it was related to the ellipticity curve of Rayleigh waves, and they took advantage of the coincidence between the first frequency maximum of the H/V curve with the fundamental resonance frequency to use it as an indicator of subsurface structure. Nakamura (1989) used this H/V ratio and claimed that it could be used to reliably estimate the site transfer function for S waves (he used the term "Quasi-Transfer Spectrum"). This led to several studies that claimed to obtain the dynamic soil properties.
Bard (1998) suggested that this interpretation was based on the assumption that microtremors consist predominantly of surface waves: therefore the H/V ratio was related to the ellipticity of Rayleigh waves as Rayleigh waves dominate the vertical component. This ellipticity is frequency dependent; it exhibits a sharp peak around the fundamental frequency for sites displaying a sufficiently high impedance contrast between surface and deep materials.
A popular approach consists in obtaining the dominant period of the site from H/V microtremor spectral ratios (Nakamura method). However, some significant portions of body waves and surface waves remain poorly known. It has been believed that the H/V spectral ratio might be mainly influenced by SH resonance in the surface layers. With Bard (1998) we agree that the microtremors are mainly surface waves so that the H/V spectral ratio should be represented by the ellipticity ratio of theoretical Rayleigh waves.
But the absolute magnitude of the H/V spectral ratio should not be directly compared with the theoretical transfer function.
As the H/V spectral ratio technique remains controversial, this technique has become the tool of choice in many ambient seismic noise studies (see e. g. Muciarelli etal., 2009). Recently there has also been an increasing interest in the relation between H/V and the theoretical ellipticity ratio of Rayleigh waves.
In this paper we calculate the curves of Rayleigh wave ellipticity and ID transfer functions for Monterrey (RSC site) and for Mexico City (Texcoco site). These curves are calculated from velocity models estimated by the SPAC method. At both sites the spectral ratios H/V obtained by the Nakamura method were calculated and compared with the ID transfer function. The curve of ellipticity of Rayleigh waves was estimated from the models obtained by SPAC. shows a slightly better agreement of the curve of ellipticity with the H/V spectral ratio in contrast to the ID transfer function. Moreover, the fundamental frequency of the ellipticity curve is closer to the fundamental frequency of the H/V spectral ratio, while the fundamental frequency of the ID transfer function appears slightly shifted to the lower frequencies in both cases. This means that we have a better contribution to the ellipticity curves used to represent the fundamental frequency than the ID transfer function model does.
Discussion
In this investigation the application of the SPAC method in Mexico turned out to be a very useful tool for engineering. We show some examples of the application of this method and we discuss what we could learn from each case, taking into account that the surveys were made for different purposes and in different geological conditions.
In Colima state there were two instrumental arrangements and the results between triangular arrays and linear arrays showed agreement of dispersion curves for frequencies above 4.5 Hz. This was the bottom frequency the sensors of the refraction equipment could see. Thus the linear arrays of refraction equipment were reliable for the implementation of the SPAC method in urban areas as compared to triangular arrays in this range of frequency.
In Michoacán, we used 1 km arrays in order to cover the entire urban area of both cities. This strategy allowed us to simultaneously obtain ¡soperiod maps and rough velocity structures both in Uruapan and in Zamora. However, the strategy of using a single large-size array (1 km) constrained the scope of the explorations to a rather rough velocity structure model.
Application of the SPAC method in the valley of Mexico provided two different experiences. At the Aragón site the SPAC method allowed us to observe an increase of stiffness in a layer with inclusions in contrast to the same layer without inclusions. We may state that the SPAC analysis was able to detect the shear wave velocity variations due to this soil improvement technique. This is a clear example that the SPAC methodology may be successfully extended to other types of surveys including foundations, in addition to its more common use in ground exploration. At the Texcoco Lake site, the properties of the clay made it difficult to explore the deeper layers. In order to improve the resolution of the velocity structure, six different triangular arrays with apertures ranging from 5 m to 1000 m were used; yet we only succeeded to go down to 40 m depth.
In Monterrey, SPAC was applied in an urban area to determine the velocity structure at four sites and the profiles were successfully obtained.
It is well known that the H/V ratio usually exhibits a peak, which often matches the fundamental frequency of the site. However, the ambient wave field contains unknown proportions of body waves and surface waves (Wathelet, 1995). When body waves dominate the wave field the spectral ratio is mainly influenced by SH resonance of the surficial layers; but if the surface waves dominate, the theoretical ellipticity of Rayleigh wave should be present in the observed curves (Nagoshi and Igarashi, 1971). In our case we are assuming a dominance of surface waves in the ambient wave field, that is in microtremors.
The H/V spectrum does contain valuable information about the underlying structures, especially the relationship between Vs of the sediments and their thickness (Boore and Toksoz 1969). However, because of the influence of the surface wave field in the observed records, the spectral ratio H /V may be represented better by the Rayleigh wave ellipticity curve than by the SH ID transfer function.
We computed the ellipticity curve of Rayleigh waves and the Transfer Function from ID velocity model (obtained from SPAC analysis) for the TXCL and RSC sites. These curves were compared to spectral ratios H/V calculated for this site, hoping to represent the fundamental frequency for this site. This comparison showed that the ellipticity curve had a better representation of the fundamental frequency, and the transfer function showed a small shift to lower frequencies from the fundamental frequency.
Conclusions
In Mexico microtremor studies are mostly used in microzonation studies and usually these recordings are analyzed with the H/V spectral ratios technique. In most cases it was assumed that for more complete analysis methods, such as SPAC, it is necessary to have several stations. However, we show that even with a linear array of two stations, it is possible to obtain the phase velocity dispersion curve. Good results may depend on soil conditions at the study site, as was found at the Texcoco Lake site where low velocities and the highly dispersive material caused a very low correlation coefficient which did not allow us to reach the deep layers.
We showed that the SPAC method is sensitive to small variations of stiffness in soft soils. This shows the excellent range of applicability of this method to engineering problems.
The study of microtremors using the SPAC method, based on our results, allowed us to characterize site effects by comparing the spectral ratios H/V, ID transfer function and the ellipticity curve for the fundamental mode of Rayleigh waves. The ellipticity curve provided a better match of the fundamental frequency with the H/V spectral ratios. However, amplitude estimations do require a more refined model. To better understand these potential of application, more studies are required.
Acknowledgments
Some pictures were taken and edited in Google-Earth and ellipticity curves were calculated with the utilities program GEOPSY.
We appreciate the valuable comments of Cinna Lomnitz, Franciso Sánchez S., Rafael Ibarra and the anonymous reviewers, wich helpend to improvide the manuscrip.
Bibliography
Aguirre González J., 2001, Aplicación de observación de arreglos de microtremores a estudios geotécnicos mediante el método SPAC. Reporte Instituto de Ingeniería, UNAM Julio, 2001. [ Links ]
Aki K., 1957, Space and time spectra of stationary stochastic waves with special reference to microtremors. Bull. Erthq. Res. Inst, 35,415-456. [ Links ]
Aki K., 1965, A note on the use of microseisms in determining the shallow structure of the earth's crust, Geophysics, 30, 665-666. [ Links ]
Bard P.Y., 1998, Microtremor Measurements: A tool for site effect estimation?. The effects of Surface Geology on Seismic Motion, Irikura, Kudo, Okada and Sasatani (eds), 1251-1279. [ Links ]
Boore D.M., Toksoz, M.N., 1969, Rayleigh wave particle motion and crustal structure, Bull. Seism. Soc. Am., 59, 331-346. [ Links ]
CENAPRED, 2003. El sismo de Tecoman, Colima del 21 de enero de 2003 (Me 7.6), Dirección de Investigación, Centro Nacional de Prevención de Desastres, México (in Spanish). [ Links ]
Chávez-García, F.J., Rodríguez M., Stephenson W.R., 2005, An Alternative approach to the SPAC analysis of microtremors; Exploting stationary of noise, Bull. Seismol. Soc. Am., 95, 277-293. [ Links ]
Flores-Estrella H., 2004, Método SPAC: Una alternatva para la estimación de Modelos de Velocidades en el Valle de México, Master thesis, Posgrado en Ciencias de la Tierra, Universidad Nacional Autónoma de México (in Spanish) 111pp. [ Links ]
Google Earth, 2007, http://earth.google.com, version. 4.1.7087.5048 (beta). [ Links ]
Gutierrez C, Singh S.K., 1992, "A site effect study in Acapulco Guerrero, Mexico: A comparison of results from strong motion and microtremor data". Bull. Seism. Soc. Am. 82, pp. 642-659. [ Links ]
Lacoss R.T., Kelly E.J., Toksoz M.N., 1969, Estimation of seismic noise structure using arrays. Geophysics, 34. 21-38. [ Links ]
Lermo J., Rodriguez M., Singh S.K., 1998, Natural Period of sites in the Valley of Mexico from Micro tremor Measurements and Strong Motion Data. Earthquake Spectra, 4, 805-814. [ Links ]
Malischewsky, P., 1987. Surface Waves and Discontinuities. Elsevier, Amsterdam, 222 pp. [ Links ]
Morikawa H., Sawada S., Akamatsu J., 2004, A method to estimate phase velocities of Rayleigh waves using microseisms simultaneously observed at two sites, Bull. Seismol. Soc. Am. 94, 961-976. [ Links ]
Morikawa H., Toki K., Sawada S., Akamtsu J., Miyacoshi K., Ejiri J., Nakayima D., 1998, Detection of dispersión curves from microseisms obserbed at two sities. The effects of Surface Geology on Seismic Motion, Irikura, Kudo, Okada and Sasatani (eds.), Balkema, Rotterdam, The Netherlans, pp 719-724. [ Links ]
Muciarelli M., Herak M., J. Cassidi (Ed.), 2009, Increasing Seismic Safety by Combining Engineering Technologies and Seismological Data, Springer, Dordrecht. [ Links ]
Nakamura Y., 1989, A Method for Dynamic characteristics Estimation of Subsurface using Microtremors on the Ground Surface, Quarterly Report of Railway Technical Research Institute (RTRI), Vol. 30, No.1. [ Links ]
Nogoshi M., Igarashi T, 1971, On the Amplitude Characteristics of Microtremor (Part 2) (in Japanese with English abstract), Jour. Seism. Soc. Japan, 24, 26-40. [ Links ]
Stephenson W., Lomnitz C, 2005, Wave velocity profile at the Texcoco strong motion array site, Valley of Mexico. Geofísica Internacional, 44, 1, 3-10. [ Links ]
Toksoz M.N., 1964, Microseisms and an attempted application to exploration. Geophysics, 24, 154-177. [ Links ]
Vázquez-Rosas R., 2002, Estudio de microzonificación sísmica para la ciudad de Uruapan Michoacán aplicando el método SPAC. Bachelor Thesis (in Spanish), Universidad Michoacana de San Nicolás de Hidalgo, Facultad de Ingeniería Civil. [ Links ]
Vázquez-Rosas R., Aguirre-González J., Garduño V. H., Mijares H., 2005, Estudio de microtremores para la ciudad de Uruapan Michoacán aplicando el método SPAC. Memorias del XV Congreso Nacional de Ingeniería Sísmica, México, D. F. (in Spanish). [ Links ]
Vázquez-Rosas R., Aguirre-González J., Garduño V.H., M., H. Mijares A., 2005, Propuesta de microzonificación sísmica de la ciudad de Zamora Michoacán, Memorias del XV Congreso Nacional De Ingeniería Sísmica, México, D. F. septiembre (in Spanish). [ Links ]
Vázquez-Rosas R., 2007, Estudios de Microtremores aplicando el método SPAC en las ciudades de Uruapan Michoacán y Monterrey N.L. Master thesis, Posgrado en Ciencias de la Tierra, Instituto de Geofísica Uiversidad Nacional Atónoma de México, México D. F. Noviembre 2007 (in Spanish). [ Links ]
Wathelet, 2005, Array recording of ambient vibrations: surface-wave inversion., PhD thesis, Liegé Faculty, Université de Liége, 155 pp. [ Links ]

