


Servicios Personalizados
Revista
Articulo
 Inglés (pdf)
 Artículo en XML
 Referencias del artículo
 Enviar artículo por email
Indicadores
-
 Citado por SciELO
 -
 Accesos
Links relacionados
-
 Similares en
SciELO
Similares en
SciELO
Compartir

 Permalink
Geofísica internacional
versión On-line ISSN 2954-436Xversión impresa ISSN 0016-7169
Geofís. Intl vol.50 no.3 Ciudad de México jul./sep. 2011
Artículo original
Empirically adjusted ray amplitudes in the vicinity of the critical region
Gerardo Quiroga-Goode1* and E. S. Krebes2
1 Instituto de Investigación en Ingeniería, Facultad de Ingeniería, Universidad Autónoma de Tamaulipas, Campus Universitario Tampico-Madero, Tamaulipas, 89337, México y Geophysikalisches Institut, Universitát Karlsruhe, Hertzstrasse 16, D-76187, Karlsruhe, Germany *Corresponding author: gquirogagoode@netscape.net
2 Department of Geology and Geophysics, University of Calgary, 2500 University Dr. NW, Calgary, Alberta, Canada T2N 1N4
Received: March 11, 2010
accepted: March 29, 2011
published on line: June 30, 2011
Resumen
Se desarrolla un método para corregir empíricamente las amplitudes de las ondas P producidas a partir de la teoría geométrica de rayos en la vecindad de la distancia critica xc, donde es bien sabido que la teoría produce amplitudes erróneas. Se encuentra que simplemente mediante un suavizamiento de las amplitudes dentro de una zona definida como "zona critica" con un polinomio de tercer grado, las curvas de AVO generadas mediante la teoría de rayos se ajustan muy bien a los resultados exactos. El método toma en consideración implícitamente las variaciones de amplitud vs. offset, frecuencia, altura de la fuente y receptor por encima de las interfaces y de los parámetros físicos del modelo geológico.
Abstract
An empirical approach for correcting geometrical ray theory P-wave amplitudes in the vicinity of the critical distance xc, is presented. Ray theory is well known to produce inaccurate amplitudes. It is found that simply smoothing the amplitudes within the previously defined "critical zone" with a third-degree polynomial provides an excellent match of the AVO curves generated by the ray theory with the exact results. The method implicitly takes into account the amplitude variation vs. offset, frequency, source-receiver height above the interface and physical parameters of the geological model.
Introduction
Forward seismic modeling is used in multiple applications to predict the amplitude behavior of physical models, for oil exploration, earthquake seismology and other applications. It is typically based on grid methods that discretize the wave equation and the physical model; another approach is deriving high-frequency approximations of the wavefield based on geometrical optics as provided by ray tracing methods. The latter method delivers quick acceptable results for a variety of geometrically complex geological models; the band-limited wavefield is simulated by seismic rays. The grid numerical solutions are often computationally demanding as the equations must be solved in each of the numerical cells.
The Ray tracing methods, provide a good approximation for models in which the size of the heterogeneities is larger than the dominant wavelength: it is a high frequency solution. The solution, in terms of amplitudes and phases, is remarkably good for offsets smaller than the critical distance (pre-critical offsets) and moderately so in the post-critical zone. The amplitudes however completely diverge around the critical distance xc due to singularities at caustics and foci (Cerveny, 1966a, 1966b). This window of divergent amplitudes can be called "critical region". Several methods have been developed to correct ray amplitudes in this region. In fat-layered media the standard approach is to use Weber-Hermite functions (Cerveny and Ravindra, 1971). Another approach is to use Gaussian-beam summation method (Norris, 1986).
The objective of this work is to develop a fully empirical approach, which is completely independent of any seismic theory describing the propagation of waves. To achieve this, it is shown in the following section that simply by defining a 'critical region' and smoothing the AVO curves within it, the amplitude is properly corrected. Here the problem is restricted to two elastic isotropic half-spaces in welded contact for incident and reflected P waves, but it can easily be generalized to n-layers. The results are compared to the exact solution based on the generalized ray theory (Kanasewich et al., 1983).
Method
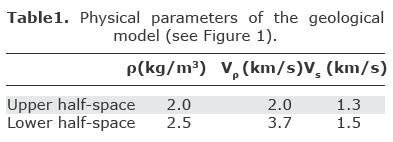
To quantify the behavior of amplitude errors within the critical region, comparisons are made in this work between the results obtained with an exact analytical method, i.e., Generalized Ray Theory (GRT), (Kanasewich et al., 1983) and Geometrical Ray Theory (RT) for realistic physical parameters in each of the two half-spaces. Of all trials, we include only the most representative cases: Poisson's ratio in each of the two half-spaces varyng, from 0.1 to 0.4, varying Poisson's ratio contrast between both half-spaces, from 0.36 to 3.0, increasing velocity contrast Vp1/Vp2 from 0.5 to 0.967, varying source-receiver height above the interface, from 0.5 to 5 km, and varying frequency, from 5 to 25 Hz. The GRT method makes use of a Cagniard-Pekeris method by decomposing the wavefield into generalized rays.
From the seismograms in Fig. 1, it is consistently observed that the main difference between the two results is in terms of the amplitudes in the AVO curves within the critical zone. The phase differences are negligible for this elastic isotropic case. It is expected however that anelasticity could yield significant phase differences as well.
Our approach comprises two steps. The first step consists of defining the critical zone xz where the amplitudes are to be interpolated. This is done by finding the lower and higher bound xL and xH; they correspond to the smallest and largest offsets about xc where the RT amplitudes start to diverge from the exact results (GRT). Figure 1 shows that these boundaries vary exponentially with (1) the physical parameters of the model, (2) the frequency and (3) the source-receiver height above the interface.
It should be noted that the differences in amplitudes between RT and GRT within xz diminish with increasing frequency and with increasing source-receiver height above the interface.
The most accurate way to determine these bound is to compare the exact (GRT) and the RT AVO curves only at the lowest and highest frequencies of the wavefield to get two sets of values of xL (f0,∞) and two of xH (f0,∞) and then fit an exponential function to get the remaining xL(f)'s and xH (f)'s across the entire frequency range. This is only done once for each geological model; f0,∞ stands for zero and infinite frequencies. Since the exponential function of frequency of xL and xH corresponds to a linear function of frequency in the log scale, the only difference among geological models is the slope and intercept of xL(f)'s and xH (f)'s.
To first order it turns out that xL is smaller than the critical distance xc whose first order derivative of the AVO curve undergoes the first polarity reversal. As these first-order derivatives need not be accurate, they are computed numerically with a first-order accurate central difference algorithm y'(x) =[y(x+h) – y(x–h)] / h. Here y represents the wave amplitude at offset x (receiver location), y' to its corresponding first order derivative and h to the receiver interval. These derivatives are computed only for offsets smaller than the critical distance.
As for the upper bound of the critical zone xH, it is observed, again to first order, that xc < xH' < 2 xc where xH = xH' xc. In practice,
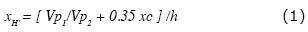
independently of the source-receiver height above the interface.
The second step of the empirical approach to correct RT AVO within xz is to determine the type of interpolation to be used. It is found that a cubic polynomial is best suited for this purpose as the rate of change of amplitudes varies rapidly near xL and xH, especially the latter. Cubic splines
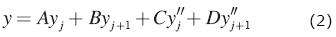
have a smooth first derivative and a continuous second derivative both within the interval and at its boundaries, which makes them amenable to smooth the ray theory amplitudes. The y"s correspond to the second derivatives of the interpolation polynomial y, and the coefficients are given by
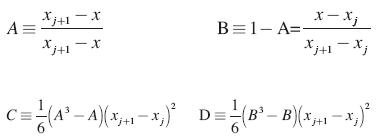
Using Eq (2) it can be shown that the system of equations in the interval j = 2,...,N-1 (xz) is just
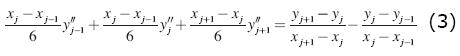
This system leads to N-2 linear equations in N unknowns, y"i=1,...,N which is thus completed with boundary conditions at x1 and xN for a unique solution. This is accomplished by setting the derivatives at the outer bounds to y"i= y"N= 0, yielding the so-called natural cubic splines. The spatial locations x1 and xN correspond to xL -h and xH + h. Thus, the algorithm first computes the second derivatives of the RT AVO curve and solves the tridiagonal system to obtain the cubic-spline interpolated amplitudes within the critical zone.
Numerical results
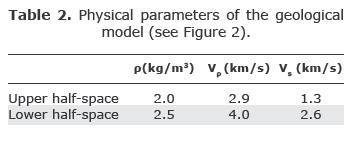
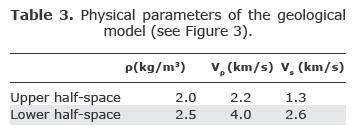
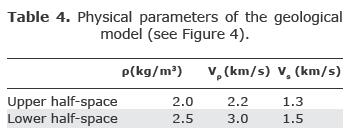
Figures 2 through 4 (3) show the corrections in RT amplitudes within the critical zone using the empirical approach proposed here. The physical parameters from which the AVO curves are computed can be found in Tables 2-4 (3). As can be observed in these figures, the fit to the exact analytical amplitudes is very good. The most critical part of the procedure is to determine accurately the window size of the critical zone.
Conclusions
We present a fully empirical approach to correct the ray theory P-wave amplitudes within the critical zone. After comparing the AVO curves produced with the exact analytical formulation with ray theory using two half-spaces in contact using numerous geological models, it was observed that smoothing the ray theory amplitudes within the critical zone suffices to match the exact amplitudes very well, independently of the physics of the problem. The fit was obtained by using cubic splines about the critical zone. It was observed that the width of this window decreases exponentially with frequency and with the source-receiver height above the interface. Thus we developed a procedure to determine the window size.
Acknowledgments
The authors wish to thank the support provided by NSERC, Canada.
Bibliography
Cerveny V., 1966a, The dynamic properties of reflected and head waves around the critical point. Tras. Inst. Geophys. Acad. Tchecosl. Sci. No. 221, Geofyzikalnisbornik 1, 135-245. Academia, Praha. [ Links ]
Cerveny V., 1966b, On dynamic properties of reflected and head waves in the n-layered Earth's crust. Geophys. J. R. Astr. Soc., 11, 139-147. [ Links ]
Cerveny V., 1967, The amplitude-distance curves of waves reflected on a plane interface for different frequency ranges. Geophys. J. R. Astr. Soc., 13, 187-196. [ Links ]
Cerveny V., Ravindra R., 1971, "Theory of seismic head waves", 312 pp., Univ. Toronto Press. [ Links ]
Kanasewich E. R., Kelamis P. G., Abramovici F., 1983, Exact seismograms for a point force using generalized ray theory, Geophysics, 48, 1421. [ Links ]
Norris A. N., 1986, Complex point-source representation of real point sources and the Gaussian beam summation method, J. Opt. Soc. Am. A, 3, 12. [ Links ]
Press W. H., Teukolsky S. A., Vetterling W. T., Flannery B. P., 2007, "Numerical Recipes", 1256 pp., Cambridge University Press. [ Links ]

