


Serviços Personalizados
Journal
Artigo
 Inglês (pdf)
 Artigo em XML
 Referências do artigo
 Enviar este artigo por email
Indicadores
-
 Citado por SciELO
 -
 Acessos
Links relacionados
-
 Similares em
SciELO
Similares em
SciELO
Compartilhar

 Permalink
Geofísica internacional
versão On-line ISSN 2954-436Xversão impressa ISSN 0016-7169
Geofís. Intl vol.50 no.2 Ciudad de México Jun. 2011
Original paper
Prediction of the next earthquake in the Mexican subduction zone and NAFZ using the predictive distribution
Alex S. Papadopoulos
Department of Mathematics, Yeditepe University, Istanbul, Turkey. * Corresponding author: apapadopoulos@yeditepe.edu.tr
Received: July 22, 2009
Accepted: January 10, 2011
Published on line: March 29, 2011
Resumen
La estimación del tiempo de espera para el siguiente terremoto, en una región sísmica específica, es una de las tareas más útiles y difíciles para los científicos dedicados a estudiar sismos. En este artículo estudiamos los tiempos de espera entre terremotos occurridos en dos distintas regiones sísmicas: Michoacán en México y Notre en Anatolia cerca de Izmit, Turquía. La prueba de Kolmogorov–Smirnov muestra que los tiempos de espera entre terremotos obedecen a una distribución exponencial. Con base en este resultado se utiliza una distribución probabilística para predecir el tiempo de espera del próximo terremoto. Se utiliza la media y la mediana de la distribución para estimar el tiempo de espera para el siguiente sismo; más aún, se puede predecir intervalos de tiempo para el siguiente terremoto. Se concluye que la mediana es mejor estimador que la media.
Palabras clave: distribución de predicción probabilística, media, mediana, intervalo de predicción, prueba de Kolmogorov–Smirnov, modelo exponencial.
Abstract
The estimation of the time of the next earthquake, in a given seismic region, is one of the most useful and difficult tasks for scientists who study and predict earthquakes. In this study, we examine the previous times between earthquakes in two seismic regions, Michoacán in Mexico and the North Anatolian seismic region near Izmit, Turkey. The Kolmogorov–Smirnov test shows that the recurrence times follow the exponential distribution. Based on this finding the predictive probability distribution of the time for the upcoming earthquake is derived. The mean and median of the predictive distribution are used to estimate the time for the next earthquake; furthermore prediction intervals for the time of the upcoming earthquake are derived. It is found that the median estimator is a better estimator than the mean.
Key words: predictive probability distribution, mean, median, prediction interval, Kolmogorov–Smirnov test, exponential model.
Introduction
The study of earthquake prediction has become the focus of many scientific communities and governmental agencies all over the world, and many prediction models have been proposed. The earthquake of September 19, 1985 in Michoacán, Mexico was a great natural disaster that caused over 10,000 deaths and left a large number of inhabitants homeless. Similarly, the earthquake that took place near Izmit, Turkey on August 19, 1999 caused the death of 17,255 people; many more were injured, and countless buildings were destroyed or heavily damaged. It is well documented that earthquakes are one of the most lethal natural disasters and have affected the history of mankind. Thus the prediction of the next earthquake, on a given seismic fault, is of great importance. One of the models used for prediction is the stochastic model. Stochastic models take in consideration previous seismic activities for forecasting the next earthquake on a specific fault. The usual method of stochastic forecasting is to fit a probability distribution function to the known times between earthquakes and then use this distribution to predict the time of the next earthquake. Utsu (1972) used the double exponential distribution, while the Weibull was used by Hagiwara (1974) and Ritikake (1974). The lognormal was utilized by Nishenko and Bulland (1987) and the gamma by Utsu (1984).
The seismic activity of large earthquakes (M ≥7) in and around the Michoacán (Mexico) fault segment was analyzed by Mikumo et al. (1998) and by Sergio G. Ferraes (2003). Specifically, Ferráes used the Weibull, Raleigh and Pareto distributions to predict the next large earthquake in the Michoacán fault–segment and concluded that the Pareto model predicts best. The earthquakes of size 5 or greater at the North Anatolian Fault Zone (NAFZ) in Turkey have been statistically analyzed by Yilmaz, Erisoglu and Celik (2004). In particular, they used the Weibull, Log–normal, Log–logistic, Exponential and Gamma distributions to fit the seismic data. Based on the Kolmogorov–Smirnov test statistic, they concluded that the Weibull distribution is the most appropriate to describe the earthquake occurrence probability.
Several authors have used Bayes theorem to model earthquakes. For example, Ferráes (1985) used a Bayesian model to predict strong earthquakes in the Hellenic arc and Ferráes (1985, 1986) also used Bayes'theorem to predict the interarrival times of strong earthquakes felt in Mexico City. Furthermore, Tsapanos et al. (2003) used Bayesian statistics in seismic hazard modeling.
The purpose of this study is to analyze data in and around the Michoacán fault–segment and also the NAFZ seismic data. To be more specific, the previous times between earthquakes will be used to predict the time of the next earthquake. The predictive distribution for the time of the next earthquake will be derived and will be used to forecast the next seismic activity in terms of point estimators and in terms of a prediction interval. The prediction interval gives the probability that the next earthquake will be contained in a specific time interval for a given probability. The point estimators will be the mean and median of the predictive distribution. These estimators will be compared using the mean absolute deviation to decide which one estimates better the time of the next earthquake.
In this presentation, it will be shown that the time between earthquakes of magnitude M ≥7 in and around the Michoacán fault between 1911 and 1986 follow the exponential distribution and will be analyzed using the above two approaches. Furthermore, the recurrence times for the earthquakes in NAFZ of magnitude M >6 from 1901 to 2003, can adequately be described by an exponential model and will be analyzed similarly.
Predictive distribution for the exponential model
Let the random variable X be defined as the time elapsed between two earthquakes. It will be assumed that X follows the exponential pdf with parameter θ, i.e.

Let  = (x1, x2, ...,xn) be n observed independent observations from the exponential distribution and Xn+1 be an additional observation to be taken independently of . The predictive distribution of Xn+1, denoted as
  , is the probability distribution of Xn+l given that we have observed the past n times, = (x1, x2, ...,xn), it is a conditional probability distribution. Our aim is to use the predictive distribution to estimate the next future observation. Lawless (1972) has shown that the distribution of
  , is the F distribution with 2 and 2n degrees of freedom,

where  is the sample mean of the n observations. Because the degrees of freedom of the F–distribution are 2 and 2n, the predictive probability density of Xn+l simplifies to

This function is a decaying function and as n approaches infinity  , approaches the exponential function. The"predictive distribution takes into consideration that if we have observed n independent observations from the exponential that the next observation is not necessarily also exponential.
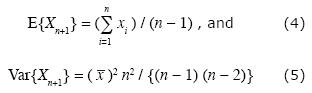
The expected value and variance of Xn+l are given as
Thus one can use the mean of the predictive distribution to estimate the next recurrence, let

denote the estimated time of the upcoming earthquake using the expected value of the predictive distribution.
Another approach to estimate the time of the next earthquake is to use the median of the predictive distribution. The median of  is derived as follows,

And after some calculations the value of xm is given as

In addition to obtaining point estimates for the time of the next future earthquake, one can derive an interval estimate which is based on the prediction distribution known as a prediction interval. Since  ~ F(2,2n) the a 100(l–α)% prediction interval for is obtained from the probabilistic statement,

And the lower and upper prediction limits for Xn+1 are given as

Because the F–distribution has 2 and 2n degrees of freedom, the values of c1 and cu can also be expressed as follows,

It should be noted that the predictions limits computed with equations (13) and (14) do not the need the F tables.
Analysis of the Michoacan and NAFZ seismic data
In this section we will use the findings of the previous section to estimate the time of the next large earthquake in the Michoacan fault–segment and in the North Anatolian Fault Zone. The Kolmogorov–Smirnov test shows that the seismic data in both seismic regions follow the Poisson process. It is well known that times between Poisson occurrences follow the exponential distribution. But, since we are using times between earthquakes to derive the predictive distribution, details are given about.
In analyzing large earthquakes (M≥7) in the Michoacan fault–segment the seven large earthquakes studied by Ferráes (2003) are used. These earthquakes are the large earthquakes in the northern segments of the Mexican subduction zone between the Rivera and Orozeo zones and the earthquake that occurred in the Petalián region on March 4, 1979. The table below, Table 1, is reproduced from the Ferráes (2003) study.
Using n recurrence times, (x1, x2, ...,xn) where n = 4,5,6 the parameter 0of the exponential distribution is estimated. Let  denote the maximum likelihood estimate of θ. The Kolmogorov–Smirnov test was performed on the first n (n = 4,5,6) recurrence times, and in all cases at the α = 0.05 level of significance the null hypothesis that the data follow the exponential distribution can not be rejected. Table 2, gives estimates for the parameter θ, the Kolmogorov–Smirnov test statistic, and the critical value for α = 0.05 in order to show that the data are adequately described by an exponential distribution.

Next we will apply the predictive equations (6) and (9) to predict the time of the next earthquake and equations (13,14) to obtain 90% prediction limits for the last three earthquakes, namely for the years 1981, 1985 and 1986. Table 3a summarizes the findings. For each year, the observed value of the recurrence time, the estimated recurrence time using the mean and the median approaches, and prediction limits are given. Table 3b, gives prediction times and limits for the next upcoming earthquake.
In order to compare the point estimators xe andxm, the approach recommended by Sterling and Pollock (1986, p. 338) will be used. Namely, we will compute the mean absolute deviation between the observed and the predicted value. Since we have two estimators, we will compute two mean absolute deviations; the one with the smaller value is better. To be specific, let

be mean absolute deviation for the mean estimator, and let

denote the mean absolute deviation for the median estimator. From the results of Table 3a, we have that de = 14.980 and dm = 9.172.
The same analysis is performed for the North Anatolian Fault Zone seismic data. Table 4 is similar to Table 1 and gives the event, year, date in years, Latitude and Longitude, recurrence time and magnitude of the earthquake.
Using the same approach as we did for the Michoacán data, the twenty recurrence times in the NAFZ are analyzed. The Kolmogorov–Smirnov test was performed on the first n, (n=10, 11,...,20) recurrence, times and in all cases the null hypothesis that the data follow the exponential distribution can not be rejected. Table 5 gives estimates for the parameter θ, the Kolmogorov–Smirnov test statistic, and the critical value for α=0.05 in order to show that the data are adequately described by an exponential distribution.

Using the same approach as for the Michoacán data, the time of the next earthquake was predicted using the mean and median point estimators. Furthermore, prediction limits were obtained for the last eleven earthquakes, namely from 2/02/1944 to 27/01/2003. Table 6a summarizes the findings. For each year, the observed value of the recurrence time, the estimated recurrence times and prediction limits are given. Table 6b gives prediction times and prediction limits for the next upcoming earthquake.
As it was done for the Michoacán data we will compute the mean absolute deviations for the two point estimators from the results showing in Table 6a. We conclude that de = 2.606 and dm = 0.867.
Finally, it should be mentioned that the Kolmogorov–Smirnov test showed that the seismic data in both regions follow the Poisson process. The details of these tests are not presented, because for the derivation of the predictive distribution we need to show that the times between earthquakes follow the exponential distribution.
Conclusions
From Table 3a and from the values of the mean absolute deviations de = 14.980 and dm = 9.172, we conclude that the median estimator for the next occurrence of an earthquake in the Michoacán segment is better than the one obtained using the mean estimator. By saying "better", it is meant that on the average is closer to the actual value. In all three situations the predictive interval contains the observed recurrence time. The length of a confidence interval depends on the variance of the distribution and for 1981, 1985 and 1986 the variances, computed from equation (5), are 2297.1, 852.8 and 459.9 respectively and thus we have long intervals. Furthermore, the computed prediction interval of 0.64 to 48.5 years is very long. This information is not of practical use and shows that statistical methods are not enough to predict the next earthquake with some kind of reasonable accuracy.
In analyzing the North Anatolian Fault Zone seismic data, we have similar findings. From Table 6a, along with the values of the mean absolute deviations de = 4.891 and dm = 3.040, we conclude again that the median estimator is better than the mean estimator. The prediction intervals contain the observed recurrence times ten times, and one time the recurrence time is outside the interval. This is consistent with a 90% prediction interval, namely the interval to contain 90% of the time, the observed value. The length of the intervals for the NAFZ data is shorter than the ones in the Michoacán segment, this is happening because the variance of the data is smaller.
The major drawback of using the exponential distribution to analyze times between earthquakes is its memoryless property, namely, the fact that the time elapsed since the last earthquake does not affect our estimations of the time to the next earthquake. This contradicts the seismic gap theory that on a certain fault the earthquake hazard is small after a large earthquake and increases with time. The predictive density used in this study, does not have the lack of memory property and it is more appealing in estimating the time of the next earthquake using either a point or an interval estimate. In using a probability density function to estimate the time of the next earthquake is a tool that the practitioner can use along with other techniques to try to estimate with some kind of accuracy the time of the next earthquake.
Acknowledgments
The author is grateful to the reviewers for their constructive comments and suggestions.
Bibliography
Ferraes S.G., 1985, The Bayesian Probabilistic Prediction of Strong Earthquakes in Hellenic Arc. Tectophys., II, 3–5, 339–354. [ Links ]
Ferraes S.G., 1986, Bayes Theorem and the Probabilistic Prediction of Interarrival Times From Strong Earthquakes Felt in Mexico City. J. Phys. Earth, 34, 71–83. [ Links ]
Ferraes S.G., 1988, The Optimum Bayesian Probability Procedure and the Prediction of Strong Earthquakes Felt in Mexico City. Pure Appl. Geophys., 127 (4), 561–571. [ Links ]
Ferraes S.G., 2003, Probabilistic Prediction of the Next Large Earthquake in the Michoacán Fault–Segment of the Mexican Subduction Zone. Geofísica Internacional, 42, 1, 69–81. [ Links ]
Hagiwara Y., 1974, Probability of Earthquake Occurrence as Obtained from a Weibull Distribution Analysis of Crucial Strain, Tectonophysics, 23, 318–323. [ Links ]
Lawless J.F., 1972. On Prediction Intervals for Samples from the Exponential Distribution and Prediction Limits for System Survival. Sankya, Ser B, 34, 1–14. [ Links ]
Mikumo T., Miyatake T. Santoyo MA., 1998, Dynamic Rupture of Asperities and Stress Change during a Sequence of Large Interplate Eartquakes in the Mexican Subduction Zone. Bull. Seismol. Sec. Am. 88, 3, 668–702. [ Links ]
Ninshenko SP., Bulland RA., 1987, Generic Recurrence Interval Distribution for Earthquake Forecasting. Bull. Seismol. Sec. Am., 77,1382–1399. [ Links ]
Ritikake T., 1974, Probability of an Earthquake Occurrence as Estimated from Crustal Strain. Tectonophysics, 23, 299–312. [ Links ]
Sterking T.D., Pollack S.V., 1976, Introduction to Statistical Data Processing, Prentice Hall, Inc., Englewood Cliffs, NJ. [ Links ]
Tsapanos T.M., Papadopoulos G.A, Galanis O.C., 2003, Time Independent Seismic Hazard Analysis of Greece Deducted from Bayesian Statistics. Nat. Haz. Earth Sys. Sci., 3, 129–134. [ Links ]
Upadhyay S.K., Pandey M., Dec 1989, Prediction Limits for an Exponential Distribution: A Bayes Predictive Distribution Approach. IEEE Transac. Reliab., 38, 5, 599–602. [ Links ]
Utsu T., 1972, Aftershocks and earthquake statistics (IV). Journal of the Faculty of Science, Hokkaido University Series VII Geophysic, 4, 1–42. [ Links ]
Utsu T., 1984, Estimation of parameters for recurrence models of earthquakes. Bulletin of the Earthquake Research Institute, University of Tokyo, 59, 53–66. [ Links ]
Yilmaz V., Erisoglu M., Celik HM.,2004. Probabilistic Prediction of the Next Earthquake in the NAZF (North Anatolian Fault Zone), Turkey. Dogus Uni. Dergisi, 5, 2, 243–250. [ Links ]

