


Servicios Personalizados
Revista
Articulo
 Inglés (pdf)
 Artículo en XML
 Referencias del artículo
 Enviar artículo por email
Indicadores
-
 Citado por SciELO
 -
 Accesos
Links relacionados
-
 Similares en
SciELO
Similares en
SciELO
Compartir

 Permalink
Geofísica internacional
versión On-line ISSN 2954-436Xversión impresa ISSN 0016-7169
Geofís. Intl vol.50 no.2 Ciudad de México jun. 2011
Original paper
Evidence for Precambrian faulting in the Tibati–Adamawa region of Cameroon using the audiomagnetotelluric method
Akoumou Manga Ngando1*, Robert Nouayou2, Tabod Charles Tabod2 and Eliezer Manguelle–Dicoum2
1 Tokyo International Center 2–49–5 Nishihara, Shibuya–ku, Tokyo 151– 0066 Japan, and National Institute of Cartography, P.O.Box: 157, Yaounde–Cameroon. * Corresponding author: nakoumou@yahoo.fr
2 Faculty of Science, University Of Yaounde I., P.O. Box: 812, Yaounde–Cameroon
Received: December 19, 2007
Accepted: March 2, 2010
Published on line: March 29, 2011
Resumen
La falla de Adamawa es una estructura tectónica relacionada con la línea volcánica de Camerún. Se han obtenido datos ATM a lo largo de una superficie de casi 1,600 km2 alrededor de la ciudad de Tibati. El conocimiento geológico del área es escaso; los últimos datos se recopilaron hace 50 años. Este artículo describe las etapas principales, seguidas de la determinación de la firma electromagnética de la falla. Los resultados muestran numerosas zonas anómalas atribuidas a la zona de Cizalla. Todo ello nos permiten inferir la estructura de la resistencia eléctrica y hacen posible tener conocimiento acerca de la falla de Tibali. Estos resultados son preliminares a un estudio de la estructura de esta falla precámbrica. En este estudio se produjeron valores y variaciones importantes de la aparente resistencia. La falla de Tibati se caracteriza por su gran complejidad y estrechez.
Palabras clave:Adamawa, falla, AMT, zonas anómalas, resistividad aparente.
Abstract
The Adamawa Fault is a tectonic structure related to the Cameroon Volcanic Line. Accurate AMT measurements were made on an approximately 1,600 km2 field around the Tibati locality. This area is not well known geologically and the latest data available were compiled 50 years ago. This paper describes main stages followed for the electromagnetic determination of the fault signature. The results show several anomalous zones, attributed to the Shear Zone. They give an idea about the real electrical resistivity structure and make it possible to have a representation of the Tibati Shear Zone. These results are the preliminary of a study of Precambrian faulted structure. Important values and variations of the apparent resistivity in the study zone are provided. This feature is characterized by narrowness and great complexity.
Key words: Adamawa, fault, AMT, anomalous zones, shear zone, apparent resistivity.
Introduction
The sheared zone of Tibati is located in the Southern Adamawa dome, a volcanic axis on the Cameroon Volcanic Line (CVL). This area is geologically poorly known. The only geological information available was compiled by Guiraudie in 1955. Recent studies show that the Adamawa dome forms the central domain of the northern equatorial fold belt outcrops (Nzenti, 1998; Nzenti et al., 1999), a complex domain that consists of an assembly of fragments of a Paleoproterozoic continental crust, recrystallized under high–grade granulite–facies conditions (Figure 1). These fragments occur next to Neoprotorozoic metasediments that display metamorphic assemblages formed during the Pan–African orogeny (Toteu et al., 2004; Nzenti et al., 2006). Geochronological studies carried out on some volcanic complexes of the chain reported ages close to 600 Myr (Kamga et al., 1999). The first stage of deformation of the rocks of this unit (orthogneiss) has the age of the post–tectonic massifs of the Pan–African chain in Cameroon (Nzenti et al., 2006). Previous geophysical studies have been carried out on this volcanic axis but not in detail. Seismological studies by Dorbath et al. (1984) reveal an asymmetrical internal structure with a thin crust to the north (23 km depth) and a normal crust to the south (33 km) which, according to the authors could not be explained by the recent thermal doming alone. In addition, low–Q materials at different depths in the crust and upper mantle have been suggested (Plomerova et al., 1993, Dorbath et al., 1986, Tabod et al., 1992). These results are supported by gravity studies and the dome being characterized by a long negative Bouguer anomaly of about –120 mgal and 200 km wide similar in shape to the East African and Ethiopian domes (Collignon, 1968; Poudjom et al., 1992, 1995, 1997). On top of the large negative anomaly, is superimposed a local positive Bouguer anomaly (Poudjom et al., 1997). The large negative anomaly was attributed to low density material in the upper mantle (Browne and Fairhead, 1983). Poudjom et al. (1992) interpret the broad negative anomaly as a consequence of lithospheric thinning (40 km) and the localised positive anomaly as due to thinning of the crust (10 km). The Adamawa dome is seismically active and its seismicity is related to movements of the faults of the Central Cameroon Shear Zone (CCSZ) (Nnange et al., 1985; Nnange, 1991; Tabod et al., 1992) (Figure 1).
The study presented here is centred close to the locality of Tibati. AMT data were recorded on an approximately 1,600 km2 zone crossed by the CCSZ (Ngako et al., 1991). This structure may form part of a mega–structure prolonged to Sudan and which appears as the prolongation of the major Brazilian shear zones of the Borborema province of NE Brazil (Cornachia and Dars, 1983; Nzenti et al., 2006). In this paper, we are presenting the first results of a highly accurate geophysical investigation in the Tibati Shear Zone. We focus on a qualitative analysis of Audiomagnetotelluric (AMT) profiles, because profiling is one of the best tools, generally used to compare apparent resistivity variations. The variations of the apparent electrical resistivities range are also considered in order to better understand this Precambrian zone. The study produces new results revealing major elements in the geostructural knowledge of some risk areas like Tibati, crisscrossed by crustal scale mega–features which are discontinuities that can be interpreted as faults or mylonitic zones.
Geological setting
The Adamawa dome consists of a substratum of plutonic and metamorphic rocks on which lie sedimentary and volcanic formations. The detailed geological formations situated on the Ngaoundéré West uplift are given in explanatory notes by Guiraudie (1955). Our study area situated between longitudes 12° and 13°E and latitudes 6° and 7° N, has an approximate surface of 1,600 km2 and consists of an old basement (Guiraudie, 1955) belonging to the African shield, made up of metamorphic and eruptive rocks. This substratum (Figure 2) (Lassere, 1961) includes series with major metamorphism composed of gneisses and calcalkaline and heterogeneous concordant granites. This whole area, in addition to being covered by surface, residual and sedimentary formations like latentes and conglomerates, is characterized by the existence of mylonitic zones marked by crushing rocks. The metamorphic formations present foliation planes (Eno, 1972). They are granitogneiss characterized by: Ferro–magnesian black beds and simple christa–llophillian beds.
The mechanical orientation of these beds is due either from the emplacement of the batholiths, or subsequent of the mechanical stress. The old concordant granite south of Tibati appears as a batholith, often foliated and with pseudoporphyritic facies. It is pretectonic, often broken, crushed, pressed and twisted. The orogenic movements which are posterior to its installation were characterized by a breakable tectonic in a rigid material (Guiraudie, 1955). Mylonitic bands present in the area, are divided into several bands of unequal importance. The principal one forms the Sarangambang mountains, small but quite clear hills, very close to Tibati. It reappears north of Ngaoundourou and clearly towards Djerem river, in the zone where the Vina and Djerem rivers meet. It may be prolonged even further and may reach the Mbéré basin. Another band starts from Tibati and stretches through Mbéwé underneath the basalts. These mylonites would be the result of great tangential substratum mass movements and dynamicity of deep large compartments, thus creating "great crushed linear zones" (Guiraudie, 1955). The mylonitisation would have affected the totality of metamorphic Dahomeyan (lower Precambrian) and also a part of the granitic Plutonic Birrimian (middle–Precambrian). Since this phenomenon does not seem to affect the recent granites, its age could be situated towards the end of the Birrimian. This huge mylonitic network of great extension crossing the Adamawa uplift constitutes the Foumban/Adamawa Shear Zone (FSZ or ASZ) or the Central Cameroon Shear Zone (CCSZ), forming part of the Central African Shear Zone (CASZ). Recent studies (Ngako et al., 2003; Nzenti et al., 2006) show that the study area experienced transpressive tectonics during the Pan–African orogeny resulting in a complex system along the N70°E shear zone of Adamawa plateau.
AMT data
The AMT measurements were made with an AMT scalar resistivity meter ECA540 manufactured at the Garchy Geophysical Research Center, France. The stations were located in a region free of industrial noise close to Tibati town, in the granito–metamorphic substratum. Using the ECA resistivity meter whose frequency range extends from 4.1 to 2,300 Hz, one magnetic component and the perpendicular electric field component could be measured along a telluric line. The instrument does not provide impedance phase but only amplitude i.e. apparent resistivity. The principal telluric directions were assumed as N70°E and N160°E considering the general structural direction of the Adamawa zone as established in geological and geophysical studies (Nnange et al., 1985; Nnange, 1991; Tabod, 1992; Ngako et al., 2003). The data quality was improved by the removal of coherent noise, by averaging five or more AMT readings, at each station and for each frequency. In this way, a good proportion of the errors is eliminated. We have established four profiles along which stations were evenly spaced. These profiles were named according to the direction of the most significant town located on their prolongation.
Method
In order to better understand the results obtained throughout this study, it is necessary to make a brief presentation of the method used.
The audiomagnetotelluric or AMT sounding method
The electrical apparent resistivity (ρa) is obtained by the simultaneous measurements of the perpendicular electric and magnetic horizontal components (respectively Ex (mV/km) and Hy (nT) at several periods, T, according to the following equation (Cagniard, 1953):
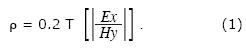
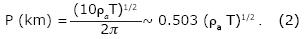
It shows the possibility of obtaining the electrical resistivity of the ground by the measurement of perpendicular telluric and magnetic components at period T (Vozoff, 1972). According to the skin effect, the greater the period, the greater the depth of penetration (p) of the electromagnetic field,
The interpretation of the curve ρa = f (T) provides a determination of the thickness and the true resistivities of the subsurface horizontal layers traversed by electromagnetic waves. The frequency range of the electromagnetic field used in this work extends from 4.1 to 2,300 Hz covering several decades. The observed variation of apparent conductivity, as a function of frequency can then be interpreted in terms of variation of electric conductivity with depth; this is the principle of magnetotelluric soundings.
The structural directions are the directions which diagonalise Cagniard's tensor, characterized by two resistivities: the transverse and the longitudinal resistivities. These directions are obtained by various data–processing techniques of tensor analysis (Vozoff, 1972), by the rotation method for MT scalar resistivity data (Manguelle–Dicoum et al., 2000, 1992) or estimated based in geological information on the study zone. The MT method using electromagnetic signals has been widely applied to many fields of geophysical exploration, such as mineral exploration, geothermal exploration etc., this technique has been used for volcanological research (i.e., Utada et al., 1984) or research on fault structure. This paper, is the first of a series of papers focused on a segment of one of the major lineaments closely related to the CVL. Here, this geophysical technique is used to contribute with structural information about the Foumban–Adamawa shear zone, that passes very close to Tibati.
Results
During the first campaign, 15 stations were installed in the vicinity of Tibati (Figure 3). These stations were situated along four profiles, namely: Tibati–Djombi (A), Tibati–Tignere (B), Tibati–Banyo (C) and Tibati–Yoko (D). Tibati town is located on the junction of many national roads leading to Yoko, Djombi, Banyo and Tignere towns. The AMT measurements were taken in two perpendicular directions, which were chosen according to the geological strike of the Adamawa fault given by geologist and geophysicists: the N70°E direction. The N160°E direction thus, represents the axis which is perpendicular to the structural direction. We considered the N160°E direction as the TM mode and the N70°E as the TE mode. Analysis of recorded measurements enabled us to plot the mean resistivity at each station, for each of the frequencies, for each direction, for each of the soundings to enable a qualitative interpretation. We based our qualitative analysis on the derived profiling curves and pseudo–sections (not presented) because these two display forms of the information easily make it possible to highlight electrical discontinuities (Pham et al., 1978). These profiles were chosen for the precise location of the faulting system. Unfortunately, the apparent resistivity profiling based on 15 stations in the vicinity of Tibati did not show any really interesting anomalous zones which might allow us to conclude on the presence of the faulting zone. Therefore, we decided to use the station density method developed by Ingham (2005), which can be applied to very narrow weakness fault zones. Supposing that the weak zone of our fault is very narrow, with a width less than 1 km, the inter–station distance could be a handicap in connection with the localization of the structure and must be reduced in order to locate the feature. Using this logical approach, according to the behavior of the apparent resistivity in some stations and by analyzing the geology of the area, the emplacement of subsequent stations was determined. Twenty more stations were thus added, in the study area (Figure 2).
The final profiles are therefore:
– Tibati–Banyo profile comprising 12 stations: (CO7, CO6, CO5, C04, C03–C, C03–b, C03–a, C03, C02–b, C02–a, C02 and B01, whose altitudes range between 884 and 889 m). Since the purpose of this 20 km long profile was to locate the fault or the faulting system, crossing through it, and since the geophysical localization was focused on the qualitative analysis of resistivity pattern associated with the faults or the faulting system, this profile was then of the greatest importance considering the previous geological study by Guiraudie (1955).
– Tibati–Tignére and Tibati–Djombi profiles 7 and 8 respectively. These two profiles, comprising stations B05, B04, B03, B02–a, B02, B01 and BOO (with heights ranging between 884 and 900 m), and B00, B01, A01, AOl–a, A02, A02–a, A03, A04 (whose heights range between 885 and 888 m, are almost parallel, and were also used here for the detection of various electric discontinuities which would possibly indicate the passage of the Foumban Fault towards the east.
– Tibati–Yoko profile comprising 8 stations: (D05, D04–a, D04, D03, D02–a, D02, D01 and B01, with heights ranging between 880 and 888 m). The purpose of this profile of approximately fifteen kilometers, was to locate the faults proposed by Guiraudie (1955), which cross the area in a direction close to N70°E.
Many studies related to AMT data processing can be found, which show how to monitor such data if they are available (Pham et al., 1978; Dupis, 1989; Manguelle–Dicoum et al., 1992; Nouayou, 2005).
The qualitative analysis of apparent electrical resistivity profiles reveals two major discontinuities in the two measurement directions (at all frequencies), in the Tibati–Banyo profile (Figure 4a to b). These discontinuities were not identified in the preliminary campaign as we can see in Figure 4(c–d) (Station C07 on the first profile has been taken as a reference). Additional AMT stations helped to locate them between the km 4 and 14. They appear as two different resistivity lows:
– The first resistivity low, a large one, located between km 4 and 12, has minimum resistivities at about 7 km. This minimum corresponds to C05 station. At this station, and in the two measurement directions, the apparent resistivity at all frequencies decreases. In the N160°E direction, the resistivities range from approximately 100,000 Ohm.m (at 4.1Hz) to approximately 500 Ohm.m (at 2300 Hz). However, in the N70°E direction, the apparent resistivities are lower, and range from 20,000 Ohm.m approximately at 4.1 Hz to 100 Ohm.m at 2,300 Hz.
– The second resistivity low, a narrow one, located between km 10 and 15, has its minimum at station C03–a. In the N70°E direction, this narrow resistivity low is not so conspicuous. Nevertheless, it is clearly observable. In the N160°E direction, we can note symmetry between the branches of this discontinuity, i.e. approximately the same resistivity variation pattern is observed between the stations C03–b and C02–b, at all the frequencies. That can lead to think about a deep and narrow discontinuity in the subsurface. While following its evolution frequency by frequency compared to the major resistivity discontinuity, it is easy to realize it is deepest in the N160°E direction compared to the perpendicular direction. The difference between the two last stations of this profile (C02 and B01), of almost 5 km does not enable a detailed interpretation on this portion of the profile but we could not do otherwise because of the presence of the power supply in the vicinity. Contrastingly, the distance between C07 and C06, 4 km approximately, does not affect the sampling of major to medium resistivity variation; we observe similar variations of the Earth natural current between these two stations.
The 20 km length Tibati–Tignere profile (Figure 5) shows a major discontinuity, situated at approximately 6 km from the first station, B05. For all frequencies, and in the two measurement directions, one can see the abrupt decrease of apparent resistivities in B02–a. The presence of almost horizontal layers is easily inferred along this profile, in the two directions, especially in the N70°E. These horizons are interrupted by the above mentioned discontinuity and are more clearly seen in the N70°E direction where quasi–symmetry of the edges of the apparent resistivitiy breaks can be observed.
Already, during the analysis of the data from the early first 15 stations, we realized that station B02 was characterized by a strong resistivity peak especially in the N160°E direction. This peak makes the discontinuity of apparent resistivities in B02–a to show a dissymmetry in this direction.
In the two directions, the maximum and major variations taking place at 4.1 Hz frequency are almost uniform and similar. But an important remark is noticed in B02–a station:
– In the N160°E direction, resistivities rise from 160 Ohm.m (at 2,300 Hz) to 13,200 Ohm.m (at 4.1 Hz).
– In the perpendicular direction, resistivities range from 460 Ohm.m (at 2,300 Hz) to 3,500 Ohm.m (at 4.1 Hz).
Finally, on this profile, the break is made as on a block. In direction N160°E, an important dissymmetry between the lips of the break of apparent resistivities is noticed. The resistivities of the southern side (2 last stations) are higher than those of the northern side (two last stations). It seems that this great discontinuity marks the boundary between two different media.
Concerning Tibati–Djombi profile (Figure 6), in N160°E direction, two major characteristics are observed:
– A resistivity peak at A02 (at 4.1 Hz, of almost 1,000,000 Ohm.m is observed).
– Low apparent resistivities between A02 and A03, i.e., at station A02–a. This relative fall in resistivities although dissymmetrical, is observed at all frequencies. In any case, similar apparent resistivity values point to the presence of horizontal layers between A01 and AOl–a, and also between B00 and B01. But in spite of the interpolation, appear to undergo important variations after crossing stations A02, A02–a, A03 and A04.
– Between A02 and A02–a, at 130 Hz, the apparent resistivity changes from 120,000 Ohm.m to 3,800 Ohm.m. At 41 Hz, it passes from 250,000 Ohm.m to 12,000 Ohm.m. At 4.1 Hz, it passes from 870,000 Ohm.m to 270,000 Ohm.m. At depth, the apparent resistivity tends more and more to be standardized. It is thus obvious that an electrical discontinuity can be assumed at A02–a.
In the N70°E direction, apparent resistivity iso–curves are quasi–horizontal; the subsoil seems to be uniform. But some characteristic points can be noticed:
– The peak of apparent resistivities in A02 is less strong in this direction, especially at 4.1 Hz and at 2,300 Hz. We can appreciate this if we eliminate the edge frequencies.
– At A02–a station, there are also low apparent resistivities but they seem less marked than in the orthogonal direction. The same remark on the horizontal variations between A01 and AOl–a (and also BOO and B01) but highly perturbed between A02, A02a, A03 and A04, holds here.
The two almost parallels profiles, Djombi and Tignere are then characterized by great discontinuities and one of the most noticeable results is the dissymmetry existing on both sides of each discontinuity. This could be explained by the rocks's nature and modeling will provide information on the resistivity distribution for the understanding of this characteristic.
Along Yoko profile (Figure 7), the apparent resistivity profiling curves, in the two directions, show an approximately uniform apparent resistivity distribution. The resistivity curves are featured by a horizontal variation, similar in the two directions, in spite of some observed differences; the following remarks must be taken into account:
– It arises from the analysis of this profile, that in the first station D05, apparent resistivities are lowest. The apparent resistivities are highest in D02 in the N70°E direction and in D03 in the N160°E direction.
– The D02–a station has low resistivities, especially in the N70°E direction. Considering the general variation and especially owing to the fact that 3 shallow penetrating frequencies (2,300, 1,300 and 730 Hz) and three depth reaching frequencies (4.1, 7.3 and 13 Hz) are concerned, it is not possible to conclude about this anomaly. But by comparison with the other profiles in particular the Banyo and Tignere profiles, one could easily think that there is not an important anomaly on the Yoko profile.
Discussion
This study illustrates how the MT method is well suited for studying complicated geological environments like shear zones (i.e., David et al., 2004; Zonge, 2003) in particular to help locate more exactly the geographic locations of the Foumban–Adamawa fault system and mylonitic zones featuring the study area. These objectives were based on the fact that the electric and magnetic fields are sensitive to vertical and horizontal variations resistivity.
The data used here were checked for spurious readings, and those due to large fluctuations in the natural fields and random human errors were eliminated through repeated readings. Close to the fault zones, the inter–station distance averaged about 160 m. Thus, the accuracy of the locations of the faults in this study can be of the order of a few hundred meters.
It is well known that rough topography may cause severe distortion in imaging resistivity distribution of the crust based on AMT data acquired with the electric field oriented perpendicular to geologic strike, i.e. the TM mode (Zonge, 2003; Loke, 1999). However, our study having been carried out over a flat area, where elevation differences are on average less than 5 meters, our results are free of topographical disturbances. Because of these considerations, the EM signatures here reported can be considered quite reliable.
As already mentioned, the general objective of this MT study was to obtain images and models of the electrical resistivity sub–surface distribution in the crust and upper mantle, that could allow inferences to be made about the tectonic structure and history of a region (i.e., Jones et al., 2005). The particular objective was to obtain information about the Foumban–Adamawa fault system.
It can be noted that the whole frequency range that characterize our measurements is featured by the same pattern of resistivity variations, which can be observed in Figures 8a through 8e (8b, 8c, 8d) corresponding to the selected frequencies of 7.3, 23, 73, 410 and 1,300 Hz for the N160°E direction). Accordingly, we observe that a similar AMT signature (i.e., resistivity variations patterns) along the Tibati Shear Zone reaches deep crustal levels. The increase in density measurements along the profiles enabled the delimitation of discontinuities in the resistivity, in particular along the Banyo profile. These discontinuities in the resistivity are interpreted as due to major "shear zone". The discontinuity zone on the Banyo profile is more important than those on the Tignere or Djombi profiles (i.e., the mylonitic zone seems more extended along the Tibati–Banyo profile than along the others). Figure 9 elaborated following Delauney's triangulation (Wessel and Smith, 2007) for the Tibati–Banyo profile, and for the N160°E direction images the discontinuities in the resistivity distribution, and enhances its cortical nature.
In addition, the "discontinuity zone" can be correlated with the Sarangambang Mountains to Ngaoundal Mountains passing through Tibati (Guiraudie, 1955).
Our results give an idea about the complexity and lateral extent of the faulted zone which crosses through stations C02–a and C06.
The existence of a fault to the south of Tibati remains questionable as no noticeable anomaly has been revealed by the EM signatures. However, the position of a resistivity low at D02–a matches with the location of a fault suspected by Guiraudie (1955).
The exact geographic locations of the faults are better known now. As we can see in Figure 10, there are several agreements between the geological positions and those revealed by the AMT study. This correlation between the discontinuities revealed by the AMT and the transition zone reported by Guiraudie (1955) indicates that our study succeeded in providing information on the subsurface tectonics.
It is worthwhile to note the high values of apparent resistivities, which characterize a basement made up mainly of granite and migmatite, of Panafrican age, affected by major faults and consolidated mylonites (Figures 11 a–e) (b, c, d). These apparent resistivities are extremely high. The high resistivities compare fairly well with the resistivity range found empirically by Olayinka and Sogbetun (2002) on Nigerian Precambrian and Cambrian crystalline basement rocks. Let us recall that the apparent resistivity is a physical parameter which depends on many factors such as porosity, the mineralogical composition or lithology (Loke, 1999). Moreover, there is often an overlap between the resistivities of the same rock or rocks of different type.
Nevertheless, the analysis of the AMT sounding in the Tibati area enables us also to infer that towards the northern part of Cameroon, the basamental rocks seem to be relatively less conductive. This correlates with the fact that, in the southern part of Cameroon, we have Precambrian rocks, constituted of the Yaounde series (Yaounde Domain, see Figure 1), which comprise granulites, migmatites and medium grade schists (Nzenti et al., 1999), influenced by the nearest craton movements.
These general inferences are in agreement with the resistivity structure of the southern part of Cameroon as studied by Ndougsa et al. (2007), Nouayou (2005), Ngando et al. (2004), Mbom (1997), and Manguelle–Dicoum (1988). The Congo craton, according to Kamguia et al. (2005), Manguelle–Dicoum et al. (1992) extends under the Precambrian nappe, near the 4th parallel. Accordingly, the temperature resulting from the friction between these two major geologic units could have then produced and induced many changes in the resistivity structure. According to Penaye et al. (1993), the conditions of paroxysmal metamorphism in the southern part of Cameroon, were estimated at l,073°Kand 10–12 Kb.
As we can see in Figure 10, there are several agreements between the geological positions and those revealed by the AMT study. In particular we can observe that the mylonitic zone seems more extended along the Tibati–Banyo profile than along the others.
The present study thus gives an idea about the complexity and lateral extent of the faulted zone which could include stations C02–a and C06.
Conclusion
This study helped to characterize the faulted zone based on the electromagnetic signature of narrow fault zones. The quality of the measurements taken, on some profiles allowed us to obtain the signature of this fault as a major deep reaching crustal resistivity variation pattern common to all the frequency analyzed. This qualitative and preliminary geophysical investigation in the Tibati area based on the audiomagnetotelluric method has revealed several zones of electrical discontinuities. Based on these discontinuities, in particular, we can infer that the mylonitic zone seems more extended along the Tibati–Banyo profile than along the others. The present study therefore gives an idea about the complexity and lateral extent of the faulted zone which could include stations C02–a and C06.
These electrical discontinuities are interpreted as the electromagnetic signature of a tectonic orogenic movement which took place during the Panafrican era. Although, preliminarly only the variations of the apparent resistivities have been analyzed, they nevertheless give a clear idea about the variations of the real resistivity. A two dimensional model would obviously complement the information provided by the EM signatures. However, the main focus of this work was to highlight the response to the AMT method for a Precambrian basement characterized by the presence of narrow faults. In this light, the specific types of apparent resistivity analysis were adopted. In this way, we have presented the electromagnetic responses of a Precambrian subsurface using closely spaced data. These responses were compared to those obtained at the southern parts of Cameroon. The 2–D inversion of the AMT data, in order to better understand the internal resistivity distribution will be the subject of future studies. However, the present qualitative preliminary analysis enables us to realize that we are in a very complex structure.
Acknowledgments
The authors are particularly grateful to the Cameroon National Institute of Cartography and the Geophysics Laboratory of the University of Yaounde I for the great assistance brought for the effective realization of this work. We also thank Mr. Tchatat Daniel (Faculty of Science, University of Yaounde I), Dr. Moby Etia (INC, Yaounde), Abdoul Kadri Haman Bello (Tibati's Lamido) and our field's assistants whose help has been appreciable in the data collection and the realization of this paper.
Bibliography
Browne S.E., Fairhead J.D., 1983, Gravity study of the Central African Rift System. A model of continental disruption. Part 1: the Ngaoundere and Abu Gabra rifts. In: P. Morgan and B. H. Baber (Editors). Processes of Planetary rifting. Tectonophysics, 94, 187–203. [ Links ]
Cagniard L., 1953, Basic theory of Magnethotelluric method of geophysical prospecting. Geophysics 18, 605. [ Links ]
Collignon F., 1968, Gravimétrie de reconnaissance (République Fedérale du Cameroun); ORSTOM–Paris, France, 35 p. [ Links ]
Cornachia M., Dars R., 1983, Un trait structural majeur du continent Africain, les lineaments centrafricains du Cameroun au Golfe d'Aden. Bulletin Société Géologique de France, 25, 101–109. [ Links ]
David W.E., Jones A.G., Ferguson I.J., 2004, Lithospheric anisotropy structure inferred from collocated teleseismic and magnetotelluric observations: Great Slave Lake shear zone, northern Canada. Geophys. Res. Let, 31, L19614, DOI: 10.1029/2004GL020939. [ Links ]
Dorbath L., Dorbath C., Fairhead J.D., 1984, Structure de la croûte sous le plateau de I'Adamaoua. Compte Rendu Académie des Sciences Paris, 298, ser. 11, 539–542. [ Links ]
Dorbath L., Dorbath C., Fairhead J.D., Stuart G.W., 1986. A teleseismic delay time study across the Central African Shear Zone in the Adamawa region of Cameroon, West Africa. Geophys. J., Royal Astronomical Society 86, 751–766. [ Links ]
Dupis A., 1989, Selected examples of induction studies in continental regions including AMT prospection for natural resources. Géodynamique 4, 19–38. [ Links ]
Eno B.S., 1972, L'altération des roches basaltiques et le processus de bauxitisation dans I'Adamaoua, Cameroun. These de Doctorat d'état es Sciences Naturelles, Université de Paris, 400 p. [ Links ]
Guiraudie C., 1955., Notice explicative sur la feuille Ngaoundéré–Ouest, accompagnée de la carte géologique de reconnaissance au 1/500000, leves effectués de 1949 á 1953. Paris, Imprimerie Nationale, 23 p. [ Links ]
Ingham M., 2005, High electrical imaging of fault zones. Physics of the Earth and Planetary interiors 150, 93–105. [ Links ]
Jones A.G., Ledo J., Ferguson I., Farqhanson C., Garcia X., Grant N., Mcnelce G., Roberts B., Spratt J., Wennberg G., Wolynec L., Wu X., 2005, The electrical resistivity structure of Archean to Tertiary Lithosphere along 3200 km of SNORCLE profiles, Northwestern Canada. Can. J. Earth Sci., 42, 1,257–1,275. [ Links ]
Kamga G.T., Mercier E., Rossy M., N'sifa E.N., 1999, Synkinematic emplacement of the Pan–African Ngondo igneous complex (West Cameroon, Central Africa). J. Afri. Earth Sci., ISSN0899–5362. PP. 675–691. [ Links ]
Kamguia J., Manguelle–Dicoum E., Tabod C.T., Tadjou J.M., 2005, Geological models deduced from gravity data in the Garoua Basin, Cameroon. J. Geophys. Engin. 2, 147–152. [ Links ]
Lassere M., 1961, Carte du Cameroun au 1/500000. Resume, Bull. Dir. Mines et Géologie du Cameroun, Numero 4. 130 p. [ Links ]
Loke M. H., 1999, Electrical imaging survey for environmental and engineering studies. A practical guide to 2D and 3D surveys. Copyright (1999–2001) M. H. Loke. Report, 62 p. [ Links ]
Manguelle–Dicoum E., 1988, Etude géophysique des structures profondes et superficielles de la region de Mbalmayo, Cameroun. These de Doctorat d'Etat, Université de Yaounde, 202 p. [ Links ]
Manguelle–Dicoum E., Bokossah A.S. and Kwende–Mbanwi T.E., 1992. Geophysical evidence for a major Precambrian Schist–Granite Boundary in Southern Cameroon. Tectonophysics 205, 437–446. [ Links ]
Manguelle–Dicoum E., Tabod C.T., Nouayou R., Kwende–Mbanwi T.E., Batupe M., 2000, Audiomagnetotelluric soundings tranverses across the Northern margin of the Mamfe Basin, Cameroon, J. Afri. Earth Sci., 30. 18th colloquium of African Geology, Graz. [ Links ]
Mbom A.S., 1997, Investigations Géophysiques en bordure du Craton du Congo, region d'Abong Mbang/Akonolinga et implications structurales. These de Doctorat es sciences, Université de Yaounde I, 187 p. [ Links ]
Ndougsa M.T., Gouet D.H., Enyegue Anyam F., Manguelle–Dicoum E., 2007, Imaging the subsurface in the Cameroon centre province using the Audiomagnetotelluric soundings for the monitoring of the Monatele–Sa'a earthquake area. 2nd Alexander Von Humboldt International conference, Lima, Peru. [ Links ]
Ndougsa M.T., Meying A., Manguelle–Dicoum E., 2007, Evidence from the image of the subsurface in the Akonolinga–Ayos area (Cameroon) by combining classical and the Bostick approaches in the interpretation of audiomagnetotellurics data. 2nd Alexander Von Humboldt International conference, Lima, Peru. [ Links ]
Ngako V., Afflaton P., Nnange J.M., Njanko T.H., 2003. Panafrican tectonic evolution in Central and South Cameroon; transpression and transcension during sinistral Shear movements. J. Afri. Earth Sci., 36, 207–214. [ Links ]
Ngako V., Jegouzo P., Soba D., 1991, Le cisaillement centre Camerounais. Role structural et géodynamique dans I'orogenese Panafricaine. Compte rendu de l'Académie de Sciences de Paris, 315, 371–377. [ Links ]
Ngando A.M., Tabod C.T., Manguelle–Dicoum E., Nouayou R., Marcel J., Zakariaou A., 2004, Structure géologique le long de deux profils audiomagnétotelluriques dans le bassin de Mamfé, Cameroun. J. Cameroon Aca. Sci., 4(2), 149–162. [ Links ]
Nnange J.M., 1991, The crustal structure of the Cameroon Volcanic Line and the Foumban Shear Zone based on gravity and aeromagnetic data. PhD Thesis, University of Leeds, England, 242 p. [ Links ]
Nnange J.M., Soba D., Fairhead J.D., Stuart G.W., 1985. Earthquake activity in Cameroon during 1983. Revue Sciences et Techniques, Serie Sciences Terre, 1, 45–53. [ Links ]
Nouayou R., 2005, Contribution á l'étude géophysique du bassin sédimentaire de Mamfé par prospections audio et héliomagnétotellurique. These de Doctorat d'Etat, spécialité géophysique interne, Université de Yaounde I, 184 p. [ Links ]
Nzenti J.P., Kapajika B., Woerner G., Ruananza L. T, 2006, Synkinematic emplacement of granitoids in a Panafrican shear zone in Central Cameroon. J. Afri. Earth Sci., 45, P 74–86. [ Links ]
Nzenti J.P., 1998, Neoproterozoic alkaline meta–igneous rocks from the pan–African North equatorial fold Belt (Yaounde, Cameroon): biotites and magnetites rich pyroxenites. J. Afri. Earth Sci., 26: 37–47. [ Links ]
Nzenti J.P., Barbey P., Tchoua F.M., 1999. Evolution crustale du Cameroun: elements pour un modele géodynamique de I'orogenese néoprotérozoique. In: Géologie, environnements au Cameroun, Vicat et Bilong (editeurs), editions, Collection GEOCAM, 2, 397–407. [ Links ]
Olayinka A.I., Sogbetum A.O., 2002, Laboratory measurements of the electrical resistivity of some Nigerian Crystalline basement complex rocks. Afri. J. Sci. Techn., 3, 93–97. [ Links ]
Penaye J., Toteu S.F., Van Schmus W.R., Nzenti J. P., 1993, V–Pd and Sm–Nd preliminary geochronologic data on the Yaounde series, Cameroon. Reinterpretation of the granitic rocks as the suture of the collision in central African Belt. Compte Rendu Académie des Sciences, Paris, 317, serie II, 789–794. [ Links ]
Pham V.N., Boyer D. et Chouteau M., 1978, Cartographie des <<pseudo résistivités apparen–tes>> par profilage Tellurique–Tellurique associé á la magnétotellurique (exemples d'application sur la region de Cluff lake, Saskatchewan, Canada). Geophys. Prospec, 26, 218–246. [ Links ]
Plomerova J., Babuska V., Dorbath L., Lillie R., 1993, Deep lithospheric structure across the Central African Shear Zone in Cameroon. Geophys. J. Inter., 115, 381–390. [ Links ]
Poudjom D.Y.H., Diament M., Albouy Y, 1992, Mechanical Behaviour of the lithosphere beneath the Adamawa uplift (Cameroon, West Africa) based on gravity data. J. Afri. Earth Sci. 15, 81–90. [ Links ]
Poudjom D.Y.H., Diament M., Wilson M., 1997, Listhospheric studies across the Adamawa plateau (Cameroon) from gravity studies. Techtonophysics, 273, 317–327. [ Links ]
Poudjom D.Y.H., Nnange J.M., Diament M., Ebinger C.J., Fairhead J.D., 1995, Effective elastic thickness and crustal thickness variations in West Central Africa inferred from gravity data. J. Geophys. Res., 100, 22, 047–22,070. [ Links ]
Tabod C.T., Fairhead J.D., Stuart G.W., Ateba B., Nteppe N., 1992, Seismicity of the Cameroon Volcanic Line, 1982–1990. Tectonophysics, 212,303–320. [ Links ]
Toteu S.F., Penaye J., Poudjom D. Y, 2004, Geodynamic evolution of the Panafrican belt in Central Africa with reference to Cameroon. Can. J. Earth Sci., 41, pp 73–85. [ Links ]
Utada H., Sasai Y, Nakagawa I., Koyama S., Ishikawa Y, Hamano Y, 1984, Changes in the electrical resistivity associated with the 1983 eruption of Mitake–Jima Volcano. Bull. Volcanol. Soc. Japan 29, 113–124. [ Links ]
Vozoff K., 1972, The magnethotelluric method in the exploration of sedimentary basins. Geophysics, 37, pages 98–141. [ Links ]
Wessel P., Smith W.H.F, 2007, Generic mapping tools data processing and display software package, version 4.2.0. Free software foundation, Inc. [ Links ]
Zonge Engineering, 2003, The inversion of magnetotelluric data and the diminution of topographic effects through modeling, a comparison of ID and 2D inversion models, Zonge engineering and research organization. Inc., USA, January 2003. [ Links ]

