


Servicios Personalizados
Revista
Articulo
 Inglés (pdf)
 Artículo en XML
 Referencias del artículo
 Enviar artículo por email
Indicadores
-
 Citado por SciELO
 -
 Accesos
Links relacionados
-
 Similares en
SciELO
Similares en
SciELO
Compartir

 Permalink
Geofísica internacional
versión On-line ISSN 2954-436Xversión impresa ISSN 0016-7169
Geofís. Intl vol.49 no.4 Ciudad de México oct./dic. 2010
Articles
The structure of the Goulfey–Tourba sedimentary basin (Chad–Cameroon): a gravity study
J. J. Nguimbous–Kouoh1*, T. Ndougsa–Mbarga2*, P. Njandjock–Nouck1, A. Eyike3, J. O. Campos–Enríquez4 and E. Manguelle–Dicoum1
1 Department of Physics, Faculty of Science, University of Yaounde I, P.O. Box 812 Yaounde, Cameroon. * Corresponding author: guimbouskouoh®justice.com
2 Department of Physics, Advanced Teachers'Training College, University of Yaounde I, P.O. Box 47 Yaounde, Cameroon. * Corresponding author: tndougsa@yahoo.fr
3 Department of Physics, Faculty of Science, University of Douala, Cameroon.
4 Instituto de Geofísica, Universidad Nacional Autónoma de México, Ciudad Universitaria, Del. Coyoacán, 04510, Mexico City, Mexico.
Received: October 22, 2008
Accepted: September 17, 2010
Resumen
Se reporta un estudio gravimétrico de la cuenca Goulfey–Tourba, sureste del Lago Chad, norte del Camerún, cuyo objetivo ha sido establecer las principales características estructurales de la corteza somera. Se interpreta, en terminos de la información geológica disponible, las anomalias regional y residual. Análisis espectral y modelado 2.5D de tres perfiles seleccionados del mapa de anomalía residual proporcionan profundidades al basamento de 4.0, 2.0, y 2.9 km. Estas profundidades constriñen los modelos gravimétricos a lo largo de los perfiles, e indican que el relleno sedimentario tiene espesores variables. De esta forma, se tienen tres sub–cuencas a lo largo de la depresión de Goulfey–Turba (Goulfey, Tom–Merifine, y Tourba). Estas subcuencas son de origen tectónico. Ellas están asociadas con la tectónica de extension que ha afectado la region que va de la depresion de Benue hasta la cuenca de Chad. La sub–cuenca de Goulfey es la más profunda. El relleno sedimentario está probablemente constituido por arenas arcillosas de depositos aluviales, areniscas o margas. Las profundidades al basamento fueron constreñidas por los resultados del análisis espectral. El basamento comprende granite y gneiss, con intrusiones basálticas. Las fallas inferidas son de tipo normal.
Palabras clave: Anomalías gravimétricas, modelado 2.5D, análisis spectral, relleno sedimentario, Cuenca de Goulfey–Turba.
Abstract
A gravity study of the Goulfey–Tourba basin, southeastern Chad Lake, northern Cameroon, is presented to establish its main shallow crustal structural features. Regional and residual anomalies are interpreted in terms of the available geological information. Spectral analysis and 2.5D modelling of three profiles selected from the residual anomaly map provide depths to basement of 4.0, 2.0, and 2.9 km. These depths constrain the gravity models along the profiles, which indicate that the sedimentary infill is of variable thickness. Thus, we have three sub–basins along the Goulfey–Turba depression: Goulfey, Tom–Merifine, and Tourba. These sub–basins are of tectonic origin. They are associated with the extension tectonics that have affected the region from the Benue trough to the Chad basin. The Goulfey sub–basin is the deepest one. The sedimentary infill is probably constituted by sandy clayey alluvial deposits, sandstones or shales. Depths to basement were constrained with by spectral analysis results. The basement is granite and gneiss, with basaltic intrusions. The inferred faults are of the normal type.
Key words: Gravity anomalies, 2.5D modelling, spectral analysis, sedimentary layers, Goulfey–Tourba basin.
Introduction
The study area (Fig. 1) is located between 12° and 14° N, and between 14° and 15°50'E. It comprises a portion of the Chad sedimentary basin, a major regional depression located where Niger, Nigeria, Chad, and Cameroon meet. The study area comprises, in its north–western and central–western limits, a small sector of the Bornu–Termit trough system. It also includes lake Chad. Morphologically, the study area constitutes a sedimentary plain (Fig. 1a).
Ground water prospecting studies have been conducted in this area (Isiorho et al., 1991). Poudjom and Diament (1997) conducted gravity studies in the neighbouring areas. Poudjom et al. (1996) compiled the available gravity data from the study area. The information from gravity surveys carried out in Cameroon and in the adjacent areas by Poudjom et al. (1996), have been used to infer the structure of the Goulfey–Tourba basin in this work.
The observed anomalies on the Bouguer anomaly map were correlated with the various geologic units of the study area. The relative high Bouguer anomalies observed have been linked to intrusion of high density crustal material, while the low ones have been associated with the occurrence of a depression in the subsurface or with sedimentary infilling.
The most important stage in gravity investigation consists in the separation of the anomalies that result from different causes, in order to study and interpret them separately (Ndougsa–Mbarga et al., 2007; Parasnis, 1997). This separation can be described as a preliminary or qualitative interpretation. It is often insufficient for the needs of the investigation (Gupta and Ramani, 1980). The polynomial separation in the framework of this study subtracted at every node of the data grid the regional anomaly from the Bouguer anomaly in order to obtain the residual. The regional anomaly of the study area was represented by a second degree polynomial surface. The regional and residual maps obtained after separation show a series of positive and negative anomalies featuring the Goulfey–Tourba basin. The main aim of this work is to use spectral analysis and 2.5D modelling to determine the shape, depth, thickness and sub–surface structure of the sedimentary Goulfey–Tourba basin. The proposed gravity models illustrate the relationship between the deep–seated geological basement and the sedimentary infill along various sectors of the basin.
Geological setting
From a regional point of view, the study area is located in the transition zone between the Central and the West African rift systems (WCAS). Fig. 1a shows the relationship of the study area with the Bornu and Termit basins, as well as Lake Chad.
Tectonic activity affecting the zone began in the Primary era (i.e., Precambrian) but continued up to the Quaternary, and is featured by relief inversions (Faure, 1966; Pias, 1970; Burke and Dewey, 1974; Durand, 1982; Isiorho et al., 1991). Most lineaments and faults were generated during the Panafrican orogeny (750–550 Ma), the Palaeozoic, the Cretaceous, the Maastrichtian–Palaeogene, and the Neogene–Recent ages. Throughout the lower Cretaceous, the Chad basin constituted an extension zone between the West African plates and those of Central Africa.
The geological history of the region is related to that of the Chad basin (Burke, 1976; Genik, 1992). The study of the lacustrine transgressions has enabled the delimitation of several sedimentary basins in correspondence to palaeo–shorelines of the lake (Louis, 1970; Mathieu, 1976; Cratchley et al., 1984; Nick and Bristow, 2006). The lake Chad transgression occurred in the humid period, the transgressions during the more arid periods were marked by aeolian erosion that removed deposited material; and the subsidence of the basin with the thickening of the actual layers (Schneider, 1968; Braide, 1990; Maurin, 2002; Schuster et al., 2003) affected the basin sedimentary infill.
The sediments have a mean thickness of 600 m, and range in age from Tertiary to Quaternary. They include river alluvia, lacustrine and aeolian sediments. They comprise the following three main series (Schneider, 1968; Mathieu, 1976) (Fig. 1b):
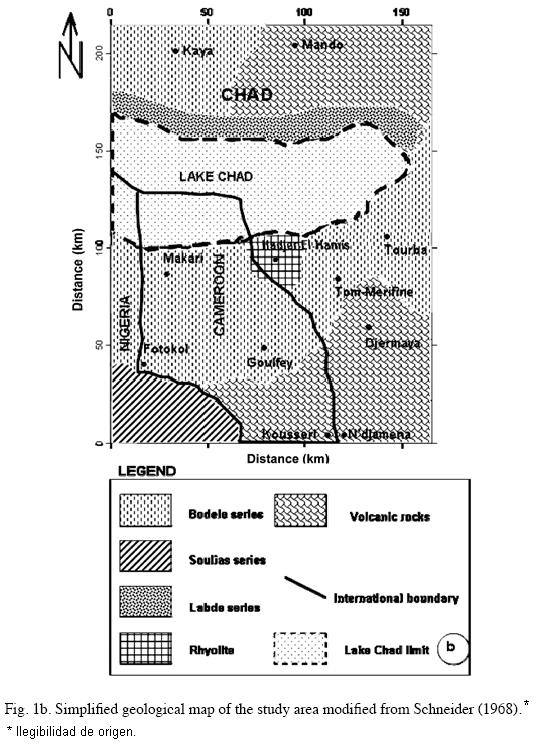
– The Bodele series, consisting of slightly differentiated sediments of Upper Tertiary age, and composed of sand and sandstone with some clayey intercalations. This series, dated in the Pliocene, is mainly fluvial.
– The Soulias series (Middle and upper Pleistocene) constituted by aeolian sand and lacustrine limestone.
– The Labde series, which includes thin lacustrine deposits, dating from 2400 years to recent.
The shallow basin cover comprises sandy clayey alluvial deposits of Quaternary age.
The sequence is underlain by granitic, gneissic and migmatitic basement rocks which appear at variable depths.
Gravity data source and analysis
Bouguer anomaly map
The gravity data used in this study were acquired in several gravity surveys carried out in Cameroon and in the adjacent areas by Poudjom et al. (1996). An average crustal density of 2.67g/cm3 was assumed for the Bouguer correction. The data set (Fig. 2a) comprises 459 measurement points. Significant disparities in the Bouguer data distribution can be observed in Cameroon, Chad, and Nigeria. Lake Chad is devoid of measurements. Nevertheless, this point distribution enables one to obtain information about the sub–surface structure of the study area. The Bouguer anomaly map (Fig. 2b) shows five relative high anomalies: at Mando (–5 mGal), Hadjer–El–Hamis (–25 mGal), Djermaya (–25 mGal), to the east of N'djamena (–15 mGal) and to the west of Kousseri (–25 mGal). These anomalies can be associated with intrusions of upper crustal rocks constituting structural highs. Four relative gravity low anomalies are also observed: at Kaya (–60 mGal), Goulfey (–50 mGal), Tom–Merifine (–45 mGal) and Tourba (–45 mGal). These anomalies can be associated with structural depressions. Together these structural highs and lows might constitute sub–basins.
Regional anomaly map
In general, the Bouguer anomaly reflects a superposition of regional and residual components. In order to analyze the contribution of the various shallow components present in the Bouguer data, it is necessary to separate them.
To constrain the separation of the local and shallower components (residual anomaly) a good understanding of the geological and tectonic context of the study area is very helpful. The choice of regional–residual separation technique is also a key point (Gupta and Ramani, 1980; Ndougsa–Mbarga et al., 2007). Based on these considerations, the approach followed to carry out the regional–residual separation is based on least squares and polynomial decomposition (Radhakrishna and Kryshnamacharyulu, 1990; Gobashy, 2000; Njandjock et al., 2003; Njandjock et al., 2006; Ndougsa et al., 2007). According to the geology of the area, and the anomaly pattern observed in the Bouguer anomaly map, for the regional–residual separation, a second–degree polynomial surface has been assumed as representative of the regional anomaly.
The regional features of the Bouguer anomaly are approximated by a second–degree polynomial surface (Fig. 3). The regional anomaly shows a regional increase of the gravity from west to east: N–S oriented isolines, a value of –51 mGal to the west and a value of 25 mGal around Kousseri and N'djamena; corresponding to a gradient of about 0.09 mGal/km. This E–W gradient is interrupted by two major relative highs located to the northeast (at Mando) and to the southwest (at Kousseri–N'djamena). It seems that these two relative gravity highs would merge towards the middle part. However, gravity observations in the eastern portion of Lake Chad are needed to corroborate this point.
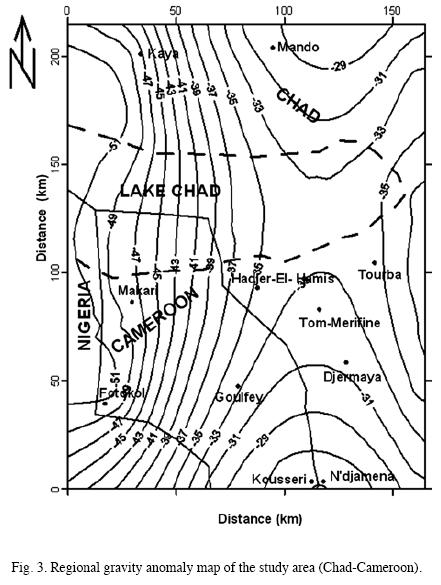
This regional pattern suggests a thinning of the crust. Regional gravity studies by Kamguia et al. (2005), and Noutchogwe et al. (2006) inferred an approximately 23 km thick crust in this area. Regional crustal thinning is related to the extensional tectonics that have given rise to the Benue, the Bornu–Termit troughs and other basins.
Residual anomaly map
The residual anomaly delimits a belt of three gravity lows in the south–south eastern portion of the study area. These anomalies are approximately centered at Goulfey (–15 mGal), Tom–Merifine (–10 mGal), and Tourba (–15 mGal). This composite gravity low is delimited to the south by a composite gravity high, with the most conspicuous anomaly centered at Kousseri–N'djamena (10 mGal). Minor gravity highs are also observed at Djermaya and to the south of Tom–Merifine. To the north of the belt of gravity lows, and due to the lack of measurements at Chad Lake, only a minor gravity high is observed at Hadjer–El–Hamis. On the basis of the available geological information (Schneider, 1968; Louis, 1970; Cratchley et al., 1984; Avbovbo et al., 1986; Schuster et al., 2003), the sources of the gravity low anomalies at Tom–Merifine, Goulfey and Tourba might correspond to sedimentary sub–basins. The anomalies at Mando (to the north of the study area), Hadjer–El–Hamis and Djermaya are possibly due to uplift of the Precambrian bedrock or to intrusions of volcanic rocks (rhyolites). At the southeastern portion of the study area (in Fotokol, Makari), as well as in the Lake Chad zone, it was not possible to delimitate the anomalies due to the lack of gravity observations.
Initial structural analysis of the gravity data indicated three sets of faulting and structural trends in the study area with N–S, NW–SE, NE–SW directions.
Depth to the basement
To estimate the mean depths to the sources of anomalies, spectral analysis was used (Spector and Grant, 1970). This method does not need a priori knowledge of the geometry and density contrast of the source bodies giving rise to the anomalies. The method is well established and proved its usefulness in schemes of interpretation in gravity and magnetics (i.e., Gerard and Debeglia, 1975; Dimitriadis et al., 1987).
The method requires the study of the power spectrum as a function of the wavenumber. The power spectrum can be obtained by means of the Fast Fourier transform. The average depths of the source bodies responsible for the observed gravity anomalies can then be estimated using the following expression (Gerard and Debeglia, 1975):
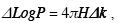
where ΔLogP is the logarithmic variation of the power spectrum for a wavenumber interval Δk.
This relation is deduced from the power spectrum curve versus the wavenumber.
On each curve of Fig. 5, two approximately linear segments can be identified. The high wavenumber portion is due to shallow bodies; the low wavenumber part is caused by the deep–seated bodies. Both depths for the deep–seated and shallow bodies are obtained by using the Spector and Grant (1970) method. The errors values have been obtained by considering that each one is representing 5% of the mean depth value of the basin (Nnange et al., 2000).
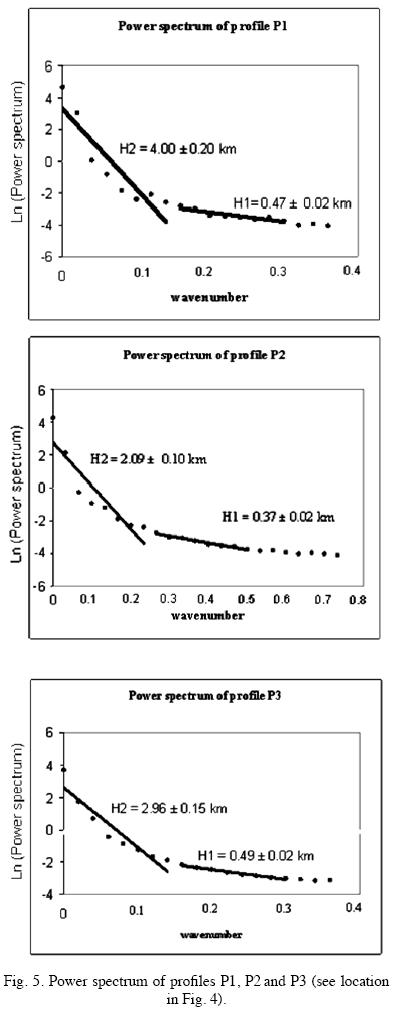
The respective spectrums of the profiles P1, P2 and P3 are shown in Fig. 5. The depths of 4.0 ± 0.20 km, 2.09 ± 0.10 km and 2.96 + 0.15 km obtained from profiles P1, P2 and P3 are related to sediment–bedrock (basement) contact. The depths of 0.47 ± 0.02 km, 0.37 ± 0.02 km and 0.49 + 0.02 km can be interpreted as the interface between the rather thick alluvial cover and the consolidated sediments. As a whole, spectral analysis suggests that the Goulfey sub–basin (see profile P1) is the deepest in the Goulfey–Tourba basin.
The obtained depths to the interface between the shallow unconsolidated and deep consolidated sediments found in the region are in agreement with values of approximately 325–600 m documented in several zones near the study area by Schneider (1968), Durand (1982), Isiorho et al. (1991), and recently by Schuster et al. (2005), who combined Landsat satellite images and electrical resistivity soundings in a study of the sedimentary system around Megachad palaeolake. This Megachad basin includes many sedimentary basins as for example the Bornu, Termit, Chad lake, Masenya and Faya Largeau basins.
Fairhead and Okereke (1988), using spectral analysis of Bouguer anomaly grid maps estimated depths to the basement of approximately 5000 m in some parts of the Chad basin (Termit and Bornu basin).
2.5D gravity modelling
The 2.5D modelling program of Cooper (2003) was used to infer the sub–surface structure along sectors of the basin. The program calculates the gravity anomaly due to 2.5D bodies. It is based on the Talwani algorithm to calculate the gravity contribution of each body to the observed anomaly in an interactive way, so that a change of a body does not require the recalculation of the whole model. The distances are measured in kilometres; the densities are in g/cm3, and the anomalies in mGal.
The depths obtained from the spectral analysis were used as constraints of the model depths. Actually, the depths to the basement in the models were set around respective values obtained from the spectral analysis. Accordingly, in general these depths range between 2 and 4 km from one profile to another.
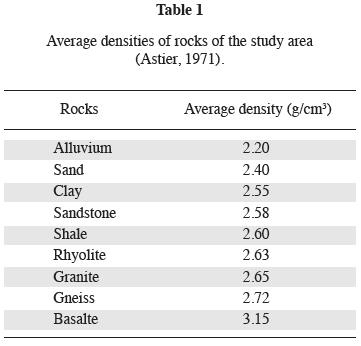
Averages of the rock densities that one can observed in the region have been reported by Astier (1971), and together with the geological maps of the study area (Figs. 1a and 1b) helped us to constrain the choice of densities.
The density contrast between the basement and sediments used previously in other sites close to the study sector (Garoua, Mbere and Yagoua basins) by different authors (Kamguia et al., 2005; Noutchogwe et al., 2006; Njandjock et al., 2006) were retained.
The residual anomaly curves were interpreted according to the shape; size the density contrast of the source of the anomaly beneath the surface of the earth. As a whole, the modelling consisted in fitting the observed anomalies and the computed curve, based on bodies representing the possible geological units present in the sub–surface. Figs. 6 (a, b, c) shows the fit between the observed residual anomalies, and the response of the gravity models along the profiles P1, P2 and P3. The presence of shallow volcanic units, according to the available geologic maps, along the profiles were included in the models.
Profile P1 over Goulfey
Profile PI has a length of approximately 80 km (Fig. 6a). The observed anomaly curve presents a low of –20 mGal suggesting the presence of low density sediments. The model comprises three bodies. The first body has a density d1= 2.47 g/cm3 and corresponds to the sedimentary infill with a variable thickness reaching 6.0 km depth at the centre of the sub–basin. According to the model the deepest point, i.e., the depocenter, is located at approximately 50 km. The second body at the north–western portion of the profile has a density d2 = 3.10 g/cm3; it has been associated with volcanic rocks outcropping in that area. Indeed, they correspond to the presence of rhyolitic inselbergs at the north–western and at south–eastern portions of this profile at Makari and north of Kousseri (Schneider, 1968). The third one has a density of 2.67 g/cm3 and corresponds to the basement. The referred basement is step faulted and uplifted (at the edge of the profile). The model indicates that the bedrock–basement and the volcanic rocks are close to the surface at the SE and at the NW portions respectively. Also the model indicates the geometry of the contact between the granite–gneissic basement and the volcanic and sedimentary infill. The presence of steep gradients in the Bouguer and residual anomaly maps led us to infer faults. A good match is observed between the observed and the model gravity response.
Profile P2 over Tom Merifine
The profile crosses Tom–Merifine and has a length of about 58 km (Figure 6b). The residual anomaly curve associated with the profile is characterized by a low gravity anomaly of approximately –15 mGal, which was interpreted as due to a sedimentary basin. To adjust the computed and the observed curves, three bodies were enough. The characteristics of the three bodies indicate the geometry of the superposition of the geological units in the subsurface. The first body has a density of d1= 2.47 g/cm3 and corresponds to the sedimentary infill with a variable thickness reaching 3.0 km at the centre of the profile. The two other bodies with densities of d2 = 3.10 g/cm3 and d3 = 2.67 g/cm3 correspond respectively to the volcanic rocks and to the granite–gneissic basement. The model is in agreement with the available geological and geophysical studies (Schneider, 1968; Mathieu, 1976; Schuster et al., 2003) which, in particular, have indicated the presence of rhyolites outcrops in the north–western and south–eastern parts of the area, particularly at Hadjer–El–Hamis and Djermaya. The contacts sediment/basement and volcanics/basement are located close to the surface at the edges of the sub–basin. The inferred faults have dips of about 60°. This sub–basin is more symmetrical than the model of profile P1.
Profile P3 over Tourba
The profile crosses Tourba (Fig. 6c). It shows the same gravity pattern as the two preceding profiles. It is composed of sedimentary infill, shallow volcanic rocks and granite–gneissic basement which are represented respectively by bodies 1 to 3. These bodies have variable thickness. The inferred faults have dips varying between 45° and 90°. The second body observed at the north–western edge of the model is associated with volcanic rocks outcroping in the Lake–Chad as reported by Deruelle et al. (2007). The maximum depth of this sub–basin is about 6.5 km deep at 64 km from the north western edge of the profile. The sub–basin is narrower relative to the two precedents.
General structure of the Goulfey–Tourba basin, and discussion
The residual anomaly map and models obtained here reveal that the approximately NE–SW elongated composite gravity low anomaly of short wavelength along Goulfey–Tourba basin may be attributed to the presence of structural depressions filled with low density sedimentary rocks.
According to our models. The Goulfey–Tourba basin comprises three sub–basins (Goulfey, Tom–Merifine, and Tourba), and the Goulfey sub–basin being the deepest one. The sedimentary infill is probably constituted by sandy clayey alluvial deposits, sandstones or shales. Depths to the basement in the models were set around the values obtained from the spectral analysis. The basement comprises granite and gneiss, also basaltic intrusions. The inferred faults are of the normal type.
According to our models, the Goulfey basin is a composite depression of tectonic origin associated with the tectonic extension featuring Chad basin. This interpretation is justified, because originally, the Chad basin was associated with extensive tectonics (Burke, 1976; Cratchley et al., 1984; Avbovbo et al., 1986). A geophysical study based on seismic refraction (Dorbath et al., 1986) reveals crustal thinning in some parts of the Central African shear zone including the Goulfey–Tourba basin. Other gravity studies by Poudjom and Diament (1997) and Noutchogwe et al. (2006) inferred uplifting of the upper mantle associated with an abnormally thin continental crust..
The depths to the basement in the study area are similar to those obtained from an intracrustal interface studies of the Benue and Mbere troughs (Kamguia et al., 2005; Noutchogwe al., 2006), which are affected by Cenozoic Volcanism. According to these two studies, the depths are respectively 4.5 km and 8.0 km. This reinforces the idea of a similar geodynamic evolution for the region from the Benue trough up to the Chad basin. It also supports a relationship with the Central African Shear Zone, which was reactivated during the opening of the South Atlantic Ocean in the Cretaceous times, and the development of intraplate volcanism in the region (Deruelle et al., 2007).
Conclusion
The present investigation indicates that the Goulfey–Tourba sedimentary basin is probably an extension of the Benue and Termit troughs and of similar structures surrounding Lake Chad. Its sedimentary infill comprises aeolian–accumulated sediments partially due to the various transgressive and regressive phases undergone by Lake Chad and its effluents (Logone and Chari) during geological time. It is made up of three sub–basins of the general graben type.
Acknowledgments
Comments and suggestions by two anonymous reviewers greatly helped to improve the paper.
Bibliography
Astier, J. L., 1971. Géophysique Appliquéeàl'hydrologie. Masson & Cie., pp. 114–115. [ Links ]
Avbovbo, A. A., E. O. Ayoola and G. A. Osahon, 1986. Depositional and structural styles in Chad Basin of northeast Nigeria, Amer. Assoc. of Petrol. Geol. Bull., 70, 1787–1798. [ Links ]
Braide, S. P., 1990. Petroleum geology of southern Bida basin, Nigeria, Am. Assoc. Petr. Geol. Bull., 74, 617. [ Links ]
Burke, K. C., 1976. The Chad Basin: an intra–continental basin: Tectonophysics, 36, 192–206. [ Links ]
Burke, K. C. and J. F. Dewey, 1974. Two plates in Africa during the Cretaceous. Nature, G. N, 249, 313–336. [ Links ]
Cooper, G. R. J., 2003. Grav2dc. 2.10. An interactive Gravity Modelling program for Microsoft windows, School of Geosciences University of the Witwatersrand, Johannesburg 2050 South Africa. [ Links ]
Cratchley, C. R., P. Louis and D. E. Ajakaiye, 1984. Geophysical and geological evidence for the Benue Chad Basin Cretaceous rift valley system and its tectonic implications: Journal of African Earth Sciences, 2, 141–150. [ Links ]
Deruelle, B., I. Ngounouno and D. Demaiffe, 2007. The Cameroon Hot Line (CHL): A unique example of active alkaline intraplate structure in both oceanic and continental lithospheres: Geoscience, 339, 589–600. [ Links ]
Dimitradis, K., G. A. Tselentis and K. Thanassoulas, 1987. A basic program for 2D spectral analysis of gravity data and source depth estimation. Computers and Geosciences, 13, 549–460. [ Links ]
Dorbath, L., C. Dorbath, G. W. Stuart and J. D. Fairhead, 1986. A teleseismic delay time study across the central African shear zone in the Adamawa region of Cameroon West Africa, Geophys. J. R. Astron. Soc., 86, 752–766. [ Links ]
Durand, A., 1982. Oscillations of Lake Chad over the past 50,000 years: new data and new hypothesis: Palaeogeogr. Palaeoclim, Palaeoecol, 39,37–53. [ Links ]
Fairhead, J. D. and C. S. Okereke, 1988. Depths to major density contrast beneath the West–African rift system in Nigeria and Cameroon and its tectonic interpretation, Tectonophysics, 143, 141–159. [ Links ]
Faure, H., 1966. Reconnaissance géologique des formations sédimentaires post–paléozoiques du Niger oriental. Mém. B. R. G. M., 47, 630 p. [ Links ]
Genik, G. J., 1992. Regional framework, structural and petroleum aspect of rifts basins in Niger, Chad and Central African Republic (CAR). Tectonophysics, 213, 169–185. [ Links ]
Gerard, A. and N. Debeglia, 1975. Automatic three–dimensional modelling for the interpretation of gravity or magnetic anomalies. Geophysics, 40, 1014–1034. [ Links ]
Gobashy, M. M., 2000. Basin evaluation from gravity measurements using simplex algorithm with application from Sirt basin, Libya. Bulletin of Fac. Sci., Zagazig University, 22, 62–80. [ Links ]
Gupta, V. K. and N. Ramani, 1980. Some aspects of regional–residual separation of gravity anomalies in a Precambrian terrain. Geophysics, 45, 1412–1426. [ Links ]
Kamguia, J., E. Manguelle–Dicoum, C. T. Tabod and J. M. Tadjou, 2005. Geological models deduced from gravity data in the Garoua basin, Cameroon. Journal of Geophysics & Engineering, 2, 147–152. [ Links ]
Louis, P., 1970. Contribution de la géophysique à la connaissance géologique du bassin du lac Tchad. Mém. ORSTOM, 42, 311 p. [ Links ]
Isiorho, S. A., K. S. Taylor–Wehn and T. W. Corey, 1991. Locating groundwater in Chad Basin using remote sensing technique and geophysical method (Abstract): EOS (Transactions of the American Geophysical Union), 72, 220–221. [ Links ]
Mathieu, P., 1976. Évolution géologique récente du bassin du Tchad. ORSTOM, Note 12, 12 p. [ Links ]
Maurin, S., 2002. Géomorphologie. Atlas de la province de l'extrême nord –Cameroun, planche 4, Atlas MINRESI–Cameroun. [ Links ]
Ndougsa–Mbarga, T. E., J. O. Campos–Enriquez and J. Q. Yene–Atangana, 2007. Gravity anomalies, sub–surface structure and oil and gas migration in the Mamfe, Cameroon–Nigeria, sedimentary basin. Geofísica Internacional, 46, 129–139. [ Links ]
Nick, D. and C. Bristow, 2006. Shorelines in the Sahara: geomorphological evidence for an enhanced monsoon from palaeolake Megachad. The Holocene, 16, 901–911. [ Links ]
Njandjock, N. P., H. L. Kande, E. Manguelle–Dicoum, C. T. Tabod, M. T. Ndougsa and J. Marcel, 2003. A Turbo Pascal 7.0 program to fit a polynomial of any order to potential field anomalies based on the analytic least squares method. African Journal of Science and Technology, 4, 1–4. [ Links ]
Njandjock, N. P., E. Manguelle–Dicoum, T. Ndougsa–Mbarga and C. T. Tabod, 2006. Spectral analysis and gravity modelling in Yagoua, Cameroon, sedimentary basin. Geofísica International, 45, 209–215. [ Links ]
Nnange, J. M., V. Ngako, D. Fairhead and C. J. Ebinger, 2000. Depths to density discontinuities beneath the Adamawa plateau region, Central Africa, from spectral analysis of new and existing gravity data. Journal African. Earth Science, 40, 887–901. [ Links ]
Noutchogwe, T. C., C. T. Tabod and E. Manguelle–Dicoum, 2006. A gravity study of the crust beneath the Adamawa fault zone, West Central Africa. Journal of Geophysics & Engineering, 3, 82–89. [ Links ]
Parasnis, D. S., 1997. Principles of Applied Geophysics: 5th edition, Chapman and Hall, London, England, 400 p. [ Links ]
Pias, J., 1970. Les formations sédimentaires tertiaires de la cuvette Tchadienne et les sols qui en dérivent. Mém. ORSTOM. 43, 408 p. [ Links ]
Poudjom, D. Y. H., A. Legeley–Padovani, D. B. Boukeke, J. M. Nnange, Ateba–Bekoa, Y. Albouy and J. D. Fairhead, 1996. Levés gravimétriques de reconnaissance–Cameroun. Orstom, France, 30 p. [ Links ]
Poudjom, D. Y. H., and A. Diament, 1997. Lithospheric structure across the Adamawa plateau (Cameroon) from gravity studies. Tectonophysics, 275, 317–27. [ Links ]
Radhakrishna, M. I. V. and S. K. G. Krisshnamacharyulu, 1990. A Fortran 77 programm to fit a polynomial of any order to potential field anomalies. Jour. Assoc. Expl. Geophys., 11, 99–105. [ Links ]
Schneider, J. L., 1968. Carte hydrologique du Tchad au 1/500000e. Rapport de synthèse. Rapp. BRGM. [ Links ]
Schuster, M., C. Roquin, P. Duringer, M. Brunet, M. Caugy, M. Fontugne, H. T. Macaye, P. Vignaud and J. F. Ghienne, 2005. Holocene lake Mega–Chad palaeoshorelines from space. Quaternary Science Reviews, 24, 1821–1827. [ Links ]
Schuster, M., P. Duringer, J. F. Ghienne, P. Vignaud, H. T. Mackaye, A. Beauvilain and M. Brunet, 2003. Discovery of coastal conglomerates around the Hadjer–El–Hamis inselbergs (Western Chad, Central Africa): a new evidence for lake Mega–Chad episodes. Earth Surface Processes and Landforms, 28, 1059–69. [ Links ]
Spector, A. and F. S. Grant, 1970. Statistical models for interpreting aeromagnetic data. Geophysics, 35, 293–302. [ Links ]

