


Servicios Personalizados
Revista
Articulo
 Inglés (pdf)
 Artículo en XML
 Referencias del artículo
 Enviar artículo por email
Indicadores
-
 Citado por SciELO
 -
 Accesos
Links relacionados
-
 Similares en
SciELO
Similares en
SciELO
Compartir

 Permalink
Geofísica internacional
versión On-line ISSN 2954-436Xversión impresa ISSN 0016-7169
Geofís. Intl vol.48 no.2 Ciudad de México abr./jun. 2009
Article
Synthetic and natural Iron oxide characterization through microparticle voltammetry
Y. Rico1*, J. C. Bidegain1 and C. I. Elsner2
1 Laboratorio de Entrenamiento Multidisciplinario para la Investigación Tecnológica – Comisión de Investigaciones Científicas, calle 52 entre 121 y 122, 1900, La Plata, Argentina. E–mail: jcbidega@yahoo.com.ar *Corresponding author: yamrico@hotmail.com
2 Centro de Investigación y Desarrollo en Tecnología de Pinturas –Consejo Nacional de Investigaciones Científicas y Técnicas, calle 52 entre 121 y 122, 1900, La Plata, Argentina. E–mail: cielsner@ing.unlp.edu.ar
Received: May 15, 2007
Accepted: January 13, 2009
Resumen
Se presentan los resultados de un estudio sobre el uso de la Voltametría de Micropartículas (VMP), aplicada a la identificación de óxidos y oxihidróxidos de hierro. Mediante esta técnica, fue posible diferenciar hematita, goethita, magnetita y maghemita, en muestras sintéticas y naturales. La medición de pigmentos sintéticos tratados a diferentes temperaturas, evidenció la existencia de un patrón de comportamiento que permite diferenciarlos. Se constató que la ubicación del pico de corriente (valor de potencial), varía en función de la especie mineral, el tamaño de grano y el grado de cristalinidad, el área, en relación con la concentración de especie electroactiva y el ancho, con la distribución de tamaños de partícula. En muestras con elevadas concentraciones de óxidos y oxihidróxidos de hierro, los picos se definieron a corrientes del orden de los mA (miliamperes) y en muestras de paleosuelos con un contenido de hierro total inferior al 6%, los picos se registraron a corrientes del orden de los µA (microamperes). De esta manera, se constata la posibilidad de aplicación de la técnica en estudios ambientales y paleoambientales que tengan en cuenta a estos minerales.
Las principales ventajas de la VMP, respecto a los métodos convencionales, se refieren a la rapidez y simplicidad de aplicación y a la posibilidad de procesar pocos microgramos de muestra, sin limitación de su grado de cristalinidad. A diferencia de los métodos magnéticos, fuertemente condicionados por la presencia de magnetita, la VMP resulta altamente sensible a la detección de especies débilmente magnéticas.
Palabras clave: Voltametría de micropartículas, potencial de pico de corriente, óxidos y oxihidróxidos de hierro.
Abstract
We are hereby presenting the results obtained from a study on using Microparticle Voltammetry (MPV) for identifying Iron oxides and oxy–hydroxides. This technique allowed us to distinguish different mineral species, such as hematite, goethite, magnetite and maghemite, in both synthetic and natural samples. By measuring synthetic pigments at different temperatures, evidence was found of an electrochemical behavioral pattern which allowed differenciating them. The current peak location (potential value) proved to vary according to the mineral species, grain size and chrystallinity degree. The area varies in terms of electroactive concentration of the species given. Width varies according to particle size distribution. In high iron oxide and oxy–hydroxide concentration samples, peaks were defined at current values of mA (milliampers) and in paleosol samples having an overall iron content lower than 6%, peaks were recorded at currents of µA (microampers). Therefore, a possibility arises of applying this technique to environmental and palaeo–environmental studies of these minerals.
MPVs main advantages compared to conventional methods are speed and simplicity as well as the fact that it allows processing a few sample grains, in spite of its chrystallinity degree. Unlike magnetic methods – strongly influenced by the presence of magnetite– MPV is highly sensitive for detecting weakly magnetic species.
Key words: Microparticle voltammetry, current peak potential, Iron oxides and oxy–hydroxides.
Introduction
Electrochemical techniques are usually used for analysing species in solution. Nevertheless, MPV allows electrochemical analysis of solid particles, such as metal alloys, pigments, superconductors, minerals and, lately, soil and rock samples (Grygar, 1995). It is highly sensitive for detecting low electrical conductivity species, as well as those which are weekly magnetic, have amorphous phases, or are micro and nano chrystalline (van Oorschot, 2001).
Different types of electrodes have been developed for electrochemistry of the solid state since 1950. In all cases, the component under study is present in the electrode, mixed with graphite powder. These compounds are called compact electrodes and carbon –paste electrodes. Adams (1958) was one of the first researchers to design a compact electrode –consisting of a mixture of magnetite, graphite and paraffin– with the aim of studying magnetites electrochemical behavior. Many researchers have used compact electrodes for the study of the electrochemical behavior of solids (Hickling and I ves, 1975; Allen et al., 1979; Allen et al. 1980; Brainina and Vydrevich, 1981). Nevertheless, this kind of electrodes can only be used for the analysis of metallic and semi–conducting solids. In 1989, Scholz et al. came up with a new method to analyse non–metal solids. According to this method, the sample is not added into the working electrode, but immobilised by rubbing it upon the surface of a paraffin impregnated graphite electrode –PIGE– (Scholz et al., 1989a). Such electrode is then dipped into an electrolite and the linear potential is scanned. System current is meanwhile monitored. This originates the MPV.
The technique is based on reductive dissolution of Fe2O3 or FeO.OH, via:
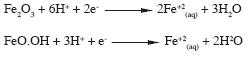
When a current peak is generated, the potential shows the reacting compound, and the peak area is directly proportional to the amount of electro–active species (Kissinger and Heineman, 1984).
In 1995, Thomas Grygar started using this technique to study iron oxide and oxy–hydroxide electrochemical behavior in natural soil and rock samples. He found a reduction of each of these minerals to a potential value that was characteristic of its species (Grygar, 1995, 1996b, 1998). In processes of this kind, particle morphology determines the specific area where the reaction is going to take place. The composition, shape and size define the current peaks position and, therefore, the development of the reactions involved in the process of reductive dissolution (Brainina and Vydrevich, 1981 and Grygar, 1998).
In our study, MPV has been used to characterize iron oxides and oxy– hydroxides in both synthetic (inorganic pigments) and natural (minerals, ferruginous sedimentites and paleosols) samples. Tests were performed on iron oxide mixtures and, in order to better differentiate mineralogical phases, samples were measured before and after receiving a given thermal treatment. Results were complemented by other techniques such as XRD, susceptibility at low temperature and microscopy. Although semi–quantification of these iron oxides may be achieved by adding manganese oxide (Pirolusite (β–MnO2) as reference mineral (Grygar and van Oorschot, 2002), only qualitative determinations have been made for this paper.
Methodology
An electrochemical cell was used to perform voltammetric measurements. This cell is made up of three electrodes in saline solution 0,2M acetic acid + 0,2M sodium acetate and a PAR 273 A model potentiostat controlled by Softcorr® corrosion software (Fig. 1).
Working electrode consists of a 5mm diameter, paraffin impregnated graphite cylinder. This tends to diminish bottom currents as well as avoid contammination from the electrolytic cell (Scholz and Meyer, 1998). To achieve impregnation, the graphite cylinder is submerged into a container filled with melted paraffin. The air is then pumped out of the container, thus creating a vacuum atmosphere which enables graphite stick impregnation. When paraffin stops bubbling, the empty spaces are tottaly occupied by paraffin. Sample particles are mechanically absorbed on the electrodes surface by rubbing the samples upper tip over the sample. The amount of sample transferred to the electrode is estimated to vary between 0,1 – 2 µg (Grygar, 1995).
When natural samples, containing several electroactive components, are studied, it is of utmost importance for the sample to be ground to fine powder in order to avoid preferential retention of any given component by the working electrode (cathode) where reductive dissolution of iron oxide finally takes place. A platinum wire electrode is used as a counter electrode (anode – electron supplier) and a saturated calomel electrode (SCE) as a reference electrode. Reductive dissolution of the iron oxides in the sample is performed by means of a linear potential scan (E) between 0,3 and –1,2 volts (V), referred to (SCE), to a constant scan speed of 4 milivolts/second (mV.s–1). Measurements are performed in a nitrogen atmosphere (N2) and each sample is scanned twice so as to achieve better definition of current peaks as well as minimize bottom current effects produced by oxygen reduction on the working electrode. The second scan is substracted from the first one (scan 1 – scan 2), the iron oxide reduction signal is thus obtained (Grygar 1996b, 1998). For the given experimental conditions, total scan time was about six minutes. Scholz and Meyer 1994, 1998 discuss MPV technique in greater detail.
A different electrochemical response is achieved for each iron oxide species. This allows differenciating them, except for goethite and hematite, whose voltamograms present a current peak of the same potential range, generally varying between–0,80 and –0,60 V. According to Grygar (1996b), in order to differenciate both species, once the voltimmetric analysis of original samples has been performed, these should be measured again, after thermal treatment including heating at 300° C for 15 minutes, in an air atmosphere. Goethite is thus dehidrated into poorly christalline hematite, which shifts the current peak towards more positive values, around –0,40V, while hematite, due to its being thermodinamically more stable than goethite, does not show any modifications. Therefore, no differences are noticed between the voltammograms from the original sample and the heated one.
The first electrochemical measurements for this research were performed on synthetic samples so as to calibrate the measuring equipment. Natural minerals, ferruginous sedimentites and paleosol samples were then analysed and, in order to better differentiate the mineralogical phases, tests were made on samples treated at different temperatures.
MPV results are complemented by other techniques such as x–ray diffractommetry, optical microscopy and low–temperature magnetic susceptibility data obtained by using a LakeShore 7130 AC Susceptometer.
Potential values (E) obtained for all samples are expressed in volts (V) which are referred to Saturated Calomel electrode (SCE). Current values (I) are expressed in milliampers (mA) or microampers (µA). Graphs show (I) values in ordinates and (E) values in abscisses.
Results
Synthetic samples
In a first stage in research, synthetic samples were tried which came from inorganic pigments from iron oxides of different origin and manufacture. Minerallogical differenciation was performed prior to electrochemical analysis by means of x–ray difractommetry (XRD).
Reflections obtained for Bayferrox 318M samples (sample "a") and Heurocox Schwartz 960MF samples (sample "b") show magnetite. Bayferrox 140M samples (sample "c") and Heurocox ROT305MF samples (sample "d") show hematite; and Bayferrox 3920 samples (sample "e") and Heurocox GELB145MF samples (sample "f") show goethite.
Fig. 2, shows the voltammograms obtained for synthetic pigments using Grygars methodology. Sample "a" voltammogram showed two current "shoulders" to potentials between –0,26 and –0,79 V. Sample "b" voltammogram showed two peaks at –0,23 and –0,96 V. Sample "c" voltammogram showed only one peak at –0,74 V and that of sample "d" showed a main peak at –0.74V and a minor one at –0,40V. Electrochemical spectrums corresponding to samples "e" and "f" showed current peaks at –0,66 V and –0,64 V, respectively.
In magnetite the voltammogram shows two current shoulders (sh) or peaks, with a separation from each other of about 600 to 700 mV (millivolts), unlike hematite and/or goethite, which show a well defined current peak between potential values between –0,80 and –0,60 V, on occasions with a small shoulder of about –0,40 V.
In order to establish a difference between hematite and goethite, samples were thermally treated, as explained under "Methodology". As an example, Fig. 3 shows the behavior found in samples "c" and "f". Voltammogram for heated sample "c" (Fig. 3a) does not show any substantial changes from the original, while sample "f" (Fig. 3b) showed a shift to –0,40V after heating. This accounts for the fact that sample "c" contains hematite and sample "f" contains goethite. The shoulders recorded in both samples after heating are showing that neither sample is completely pure. The shoulder at –0,42V, shows that sample "c" contains a little proportion of goethite, while the one recorded at –0,64 V for sample "f", may correspond to the response of a little fraction of hematite or else to that of a part of non transformed goethite.
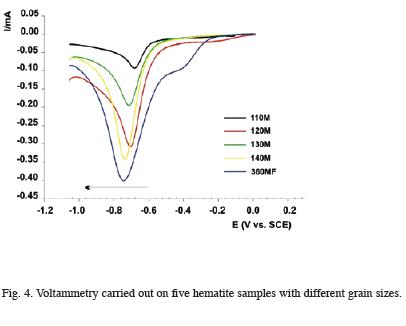
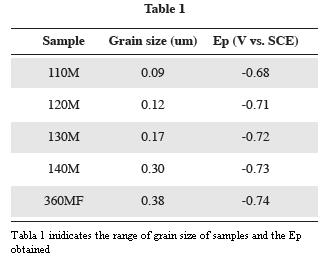
In order to estimate particle size influence on current peak position, tests were performed with synthetic samples having the same mineralogical composition but different grain size (variable particle sizes between 0,09 and 0,38µm). As hematite particle size increased, the current peak, slightly but progressively was shifted towards more negative potential values (Fig. 4 and Table 1). This leads us to infer – together with Brainina and Vydrevich (1981) – that particle size is, among others, a factor conditioning current peak position. This leads to inferring that, in natural samples where grain size distribution is generally wide, the peaks of potential (greater potential variability) are less defined.
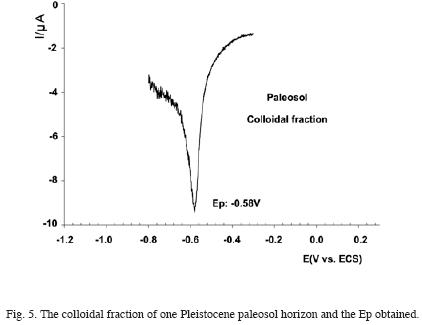
On the contrary, the better the sample selection grade (smaller grain size variation), the smaller the peak width and, therefore, the better the definition. Analysis of the colloidal fraction of a paleosol level seems to confirm the previous. Fig. 5 shows a well defined peak at –0,58V which could correspond to hematite. Such behavior is in time favoured by the smaller mineralogical variation in relation to the total sample.
In order to verify this techniques potentiallity to differentiate the species in an Iron oxide mixture, samples were made with different non uniform combinations of synthetic minerals. All mixtures were measured before and after thermal treatment. The results obtained allowed differentiating the various components for each species.
Fig. 6 shows the results obtained for a magnetite, hematite and goethite mixture. The original curve (o) presented three current peaks: those at –0,25V and –0,98V correspond to the magnetite signal and that recorded at –0,67V corresponds to the hematite and goethite overlapping signal. The latter could be observed after thermal treatment (h). The peak recorded at –0,73V is indicative of hematite, while the one appearing at –0,39V evidences goethite.
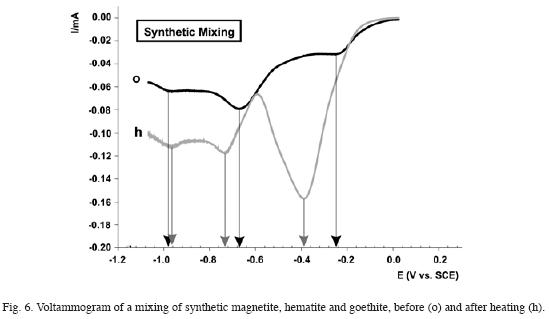
This experience allows verification of MPV viability for differentiating iron oxide and oxyhydroxide contribution in a sample.
Different synthetic samples of magnetite, goethite and hematite, previously characterized by XRD, were submitted to different temperatures, from 200° C to 600° C, at intervals of 100° C during two hours of exposure and afterwards analysed. A couple of samples were analysed for each mineral species, so as to verify their differences by means of MPV. The potential values obtained for each sample are presented in table 2.
The potential values obtained for magnetic pigments (a– Fe3O4) Bayferrox 318M (M1) and Bayoxide E8611 (M2) (Fig. 7) allow us to confirm that we are in the presence of magnetite samples. Nevertheless, the response to consecutive heating processes recorded by MPV allows us to determine that both samples are different. By comparing the evolution of both electrochemical curves, after each heating stage, we can infer that M1 pigment is more stable than M2. Magnetites transformation into maghemite (γ–Fe2O3) and into hematite was recorded at 300° C and 600° C respectively for M1 and at 200° C and 300° C respectively for M2. These differences may be related with these pigments particle size. Mineralogical changes inferred through potential value analysis obtained at different temperatures, were checked by means of X–ray testing.
Voltammograms obtained for Bayferrox 745M (H1) and Bayferrox 732M (H2) allow us to determine (Fig. 8) that the samples belong to hematite (α–Fe2O3). Current peak potential value for each of the original samples –0,76V for the first one and –0,73V for the second one and their different response to consecutive thermal treatment stages, allow us to differenciate them. In sample H1, the voltammograms obtained after each heating stage do not show great variation in the most conspicuous potential values (between –0,72 and –0,77V). Nevertheless, the presence of a shoulder around –0,45V at 200°C, would indicate the pigment has a little proportion of goethite in its composition.
Sample H2 seems to be a very stable pigment, as the most conspicuous current peak through all heating stages was recorded at –0,72V. At 500° C, some kind of process takes place which has not yet been attributed to any mineralogical phase but shows a shoulder at around –0,95V, which disappears at 600°C. A little inflection defined around –0,45V, both in the original sample and in the ones heated at 200 and 300°C would in time indicate the presence of another mineralogical phase.
Goethite (α–FeO.OH) Bayferrox 912LOM (G1) and 918LOM (G2) (Fig. 9) pigments show, at 200°C (two hours exposoure), the appearance of a current peak at –0,35V and –0,38V respectively, which comes from goethite turning into poorly chrystalline hematite. This behavior suggests the importance of both degrees C and time of exposure, as a similar definition is obtained at 300°C for 15 minutes (Fig. 3b). It is not possible to find major differences between samples G1 and G2. Nevertheless, it should be noted that electrochemical response in both at 400° C is noticeably different. At such temperature, sample G1 records only one peak at –0,73V while sample G2 shows one at –0,63V and another one at –0,42V. Both samples have a similar behavior at higher temperatures.
By allowing us to monitor a certain samples response to being exposed to different temperatures, this methodology allows establishing a characteristic behavioral pattern for each pigment.
By means of magnetic susceptibility measurement at low temperatures (Fig. 10), it was possible to differentiate magnetites contribution, from Verwey transition (a) around 100K. Although this transition is more evident for pure magnetite and it is recorded at 120K, its location and definition might vary with grain size, chrystallinity degree and purity. Disappearance of Verweys transition, as well as the high magnetic susceptibility values recorded (b) for the 300°C, two hours heated magnetite sample, allow us to suggest that magnetite has become transformed into a more oxidated phase which has been recognised by means of XRD as maghemite. At 600°C (c), the abrupt decrease of susceptibility values is the evidence of the magnetic mineral transformation into hematite (anti ferromagnetic).
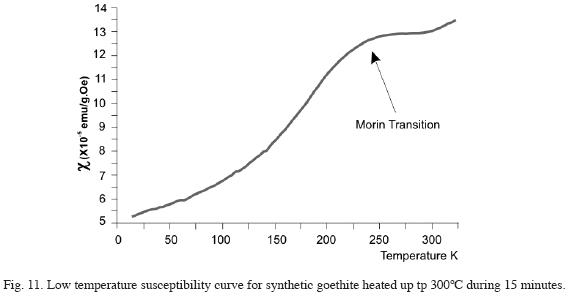
Susceptibility values (Fig. 11) obtained for goethite (sample "f") heated at 300°C for 15 minutes were very low and the curves inflection is associated to Morins hematite transition. This transitions width and location (not exactly at 260K), suggests in agreement with Grygar, 1995, that goethite has become transformed into poorly chrystalline hematite.
Natural samples
Natural Minerals
The procedure for applying MPV to pigments was also applied on natural minerals (magnetite, hematite, goethite and specularite), previously characterized by means of XRD. The samples were ground to fine powder in an agate mortar (Scholz and Mayer, 1998) in order to perform voltimetric measurements at RT and after heating up to 300°C during 15 minutes. Analysed minerals belong to the mineralogycal archive of the Faculty of Natural Sciences in La Plata University as to the Geological Laboratory at LEMIT–CIC, Buenos Aires Province, Argentina.
The voltammogram in the original (o) sample M (Fig. 12) showed two current shoulders, one around –0,27V and the other at –0,88V. The one belonging to the heated (up to 300 °C during 15 (h) presented a peak at –0,31V and another one at –0,82V. MPV and XRD tests indicate the presence of magnetite for both the original and the heated sample. This leads us to infer that no mineralogycal phases were generated during the thermal procedure. Nevertheless, MPV test shows an increase in the current peak area after heating, as well as a decrease in their separation of aproximately 100mV, which is due to converging migration of both peaks. In the original sample, separation between both peaks was 610 mV and 510 mV for the heated one. These differences may be due to the beginning of an oxidation process by temperature, which has not yet been detected by XRD.
For original (o) sample H (Fig. 13) the current peak was obtained at –0,68V and a shoulder at –0,46V. After heating (h), the shoulder located at –0,46V has disappeared and the peak located at –0.68V was recorded at the same position. X–ray tests, as well as those obtained by means of MPV, indicate the presence of hematite both for the original sample and for the heated one. Bearing in mind the fact that goethites thermal transformation into poorly chrystalline hematite (Grygar, 1998) generates a current peak at –0,40V, it could be inferred that the shoulder recorded at –0,46V might be related to a less chrystalline hematite phase than that represented by the peak at –0,68V.
For original (o) sample G (Fig. 14) a current peak was obtained at –0,67V as well as a poorly defined shoulder around –0,45V, and for the heated one (h) the peak was found at –0,44V. The most conspicuous current peak shift, at –0,67V, towards a potential value of –0,45V after sample heating, as well as the XRD results, allow us to determine that it is a goethite sample.
Fig. 15 shows the results of electrochemical analysis on two specularite samples, one from Brazil (EB) and the other from Argentina (EA). Specularite (α–Fe2O3) is a variety of hematite. Its chrystalls have micaceous habits and it has a hydrothermal origin. For the original EB sample (o), a wide current peak was obtained at a variable potential range between –1,10V and –0,80V. No significant variations were recorded after heating (h), either in potential values or in current values (Fig. 15a). Curiously enough, original EA samples voltammogram (o) showed two peaks defined at different potential values, a more conspicuous one at –0,39V and another one at –0,68V (Fig. 15b).
Unlike sample EB, after thermal treatment (h) significant changes appeared in curve configuration: the more conspicuous curve peak disappears and only one peak is recorded at –0,72V. It could be suggested that specularite EA is made up of particles with a low chrystallinity degree, as the original current peak was recorded at a potential value which is characteristic of poorly chrystalline hematite. A higher distribution of particle sizes is estimated for sample EB. This becomes evident by the current peaks width as well as the higher thermal stability than that of EA. Unlike the latter, after the heating process, no significant changes are shown in its electrochemical response.
Ferruginous sedimentites
Two samples were taken a few kilometres from the left bank of Paraná River in southern Brazil. One sample was taken around Morro da Torre (MDT), in Umuarama city 23° 47 55 South and 53° 18 48 West, 490 m.a.s.l. and the other on the banks of Ivaí River (RI), 23° 14 36 South and 53° 24 46 West, 225 m.a.s.l., both belonging to Paraná State. The samples were analysed by means of optical microscopy with both transmitted and reflected light, XRD and MPV. Petrographic study shows that both MDT and RI samples are made up of a quartz skeleton and are subrounded and subangular, cemented by a relatively homogeneous mass of little opaque chrystalls. With reflected light, magnetite and hematite grains were differentiated in the cement in the Morro da Torre sample, while this kind of differentiation was impossible in the Ivaí River sample due to the small size of chrystalls.
For the original MDT sample (MDTo, Fig. 16a), a well defined current peak was obtained at –0,66V and a series of shoulders between –0,54V and –0,16V, after thermal treatment (MDTh sample, Fig. 16b), defined a peak at a wide potential range, variable between –0,64V and –0,48V. X –ray tests show the presence of quartz, magnetite and goethite for sample MDTo and only hematite for the heated sample. By means of MPV, the peak was recorded at –0,66V, this must be reflecting the contribution of the more oxidated phases (hematite and/or goethite), while the other peaks would reflect magnetite/maghemite phases. The definite peak at –0,48V after heating would be related to goethite presence and the remaining peak at –0,64V, with hematite. Dissapearance of the shoulders located at less negative potentials and the subsequent appearance of a peak at potential values characteristic of a hematite phase after thermal treatment, account for the occurrence of a temperature oxidation process, where the more reduced phases (magnetite/maghemite) have evolved to hematite, as would be indicated by the results obtained by XRD. The current peak defined after heating is recorded within a wide range of potential values, which is probably due to overlapping of various current peaks. This might be showing differences in the chrystallinity degree of the hematite formed from the other iron oxides and/or to a wide particle size distribution.
The curve belonging to the original RIV sample (Fig. 17a) is defined at very low currents, around a wide shoulder recorded to a potential range varying between –0,40V and –0,80V approximately. After heating (RIVh), a peak was obtained at –0,52V (Fig. 17b). By XRD it is determined that the original RIV sample is made up by Quartz and goethite. No iron oxides are observed. Nevertheless, voltammetry results show the presence not only of goethite but also of a little hematite proportion, which is related to the recorded values around –0,40V, which may not have been detected by XRD due to its low chrystallinity degree. Moreover, although the potential value where the current peak is defined after heating is not exactly the one expected to confirm the presence of goethite, the low currents at which the curve was defined in the original sample, as well as the increase of the current peak area after thermal treatment, would allow to infer its presence, since these two phenomena are repeated in almost all measurements performed for this paper on both synthetic and natural goethite samples.
Paleosol samples
In order to contribute to palaeo– environmental studies by means of iron oxides as climate indicators and in view of the fact that MPV technique is used for microparticle analysis, coloidal fraction of three paleosol samples was analysed. Such samples were extracted from a geological profile presented in Cantera de Juárez (34°5700" South and 57°5300" West), La Plata city, province of Buenos Aires, Argentina and they belong to late Pleistocene sediments (Bidegain and Rico, 2004). Up to the present time, chemicals tests (Wilson method) on these sediments show total iron concentration (Fe2O3) as varying between 4 and 6% throughout all profiles (Bidegain, 1995). It should be pointed out that the studies on palaeo environmental magnetism are strongly conditioned by magnetite, as this mineral (though scarce), controls the values of remanence in loess/paleosols sequences (Bidegain et al. 2005). However, other methodologies as for instance Mössbauer spectrometry, indicates the predominance of hematite in the same sediments (Bidegain et al. 2004). Due to the latter, MPVs contribution to detecting anti ferromagnetic species (hematite, goethite) proves to be of great interest in this context. The current peaks obtained for the original samples (o) J41, J43 and J44 (Fig. 18) are defined at potentials of around –0,59V, –0,55V and –0,58V respectively. After the heating process (h), all three samples show a slight shift of the peak potential towards more negative values, no higher than 0,10V, which could be related to the occurrence of a rechrystallinity process under thermal treatment.
The results allow determining the presence of hematite in the colloidal fraction of the paleosol levels corresponding to Buenos Aires Formation, in La Plata city. The low current at which these peaks are defined, in µA, would reflect the low iron oxide concentration in these sediments. It should be pointed out that, for the synthetic samples, natural minerals and ferruginous sedimentites analyzed, peaks were recorded at currents in mA. Hematite determination in the colloidal fraction of a paleosol by means of MPV produces further evidence of this techniques high sensitivity. This has to do, not only with species differentiation (at a certain range), but also with the possibility of detecting low iron oxide and oxyhydroxide concentrations which, due to the small particle size and the low chrystallinity degree, cannot be detected by means of XRD. Bidegain (1998), mention the impossibility to obtain reflections to enable mineral differentiation of iron oxides and oxyhidroxides in the fraction < 62µ in Pleistocene sediments of La Plata, due to the poor cristallinization as for the presence of amorfous minerals. Although some samples show the presence of illite and montmorillonite, in no case do they account for iron minerals presence.
Summary
• Microparticle Voltammetry is presented here as a valid and reliable alternative for characterizing iron oxides and oxyhydroxides, in both synthetic and natural samples. Only a few sample micrograms are required for determination of mineral species and, unlike other methods (for instance XRD) there are no limitations in terms of chrystallinity degrees.
• MPV differs from rock magnetism techniques in its sensitivity to detect weakly magnetic species (antiferromagnetic), more oxidated, such as goethite and hematite. Nevertheless, more reduced magnetic species, like magnetite, is also well defined by MPV.
• Similar responses are found to those obtained by other researchers in relation to the current peak. Its position varies according to the mineral species, grain size and chrystallinity degree. The peaks width would be conditioned by granulometric distribution as well as by the amount of electroactive compound.
• Current intensity also indicates concentration. In natural pigments and samples with high concentrations of iron minerals, peaks are recorded in mA, while in paleosol (where the concentration of iron minerals is smaller) the signal is recorded in µA.
• In the clay and colloidal fraction belonging to hydromorphic Pleistocene paleosols in the Buenos Aires province, it is practically impossible to determine the existence of iron minerals by means of XRD. By applying MPV the peaks of current (within the potential range corresponding to hematite) were clearly defined.
• MPV applied to a mineral species, previously submitted to different temperature ranges, can be of use in order to differentiate its thermal stability. The smallest potential variation, obtained up to a temperature of 600°C, corresponded to hematite and it was no higher than 0,05V.
Acknowledgements
The authors wish to thank Dr. T. Grygar for encouraging the development of the present research by providing the synthetic samples and Dr. J. Stevaux for sending the natural ones from Brazil. Many thanks also to CIC and LEMIT for the financial support, as well as to CIDEPINT for allowing us to use the equipments. We would also like to thank Dr. R. De Barrio for providing the specularite samples.
Bibliography
Adams, R. N., 1958. Analytical Chemistry, 30, 1576. [ Links ]
Allen, P. D., N. A. Hampson and G. J. Bignold, 1979. The electrodissolution of magnetite – Part I. The electrochemistry of Fe3O4/C discs – Potentiodynamic experiments. Journal of Electroanalytical Chemistry, 99, 299–309. [ Links ]
Allen, P. D., N. A. Hampson and G. J. Bignold, 1980. The electrodissolution of magnetite – Part II. The oxidation of bulk magnetite. Journal of Electroanalytical Chemistry, 111,223–233. [ Links ]
Bidegain, J. C., 1995. New evidence of the Brunhes/ Matuyama polarity boundary in the Hernández–Gorina Quarries, north–west of the city of La Plata, Buenos Aires province, Argentina. Quaternary of south America and Antartic Península. Vol 11, cap. 12, 207–229 (A.A. Balkema,1998). [ Links ]
Bidegain, J. C., 1998. New evidence of the Brunhes/ Matuyama polarity boundary in the Hernández Quarries, north–ewst of the city of La Plata, Buenos Aires Province, Argentina. Quaternary of South America and Antartic Peninsula, V12, 207–229. [ Links ]
Bidegain, J. C. and Y. Rico, 2004. Mineralogía magnética y registros de susceptibilidad en sedimentos cuaternarios de polaridad normal (Brunhes) y reversa (Matuyama) de la Cantera de Juárez, provincia de Buenos Aires. RAGA 59, 3, 451–561. [ Links ]
Bidegain, J. C, L. Terminiello, Y. Rico, R. C. Mercader and E. Aragón, 2004. Mineralogía magnética en la transición Brunhes/Matuyama. Pleistoceno de la provincia de Buenos Aires. RAGA 59, 2, 193–199. [ Links ]
Bidegain, J. C., M. E. Evans and A. J. van Velzen, 2005. A magneto–climatological investigation of Pampean Loess, Argentina. Geophysical Journal International 160, 55–62. [ Links ]
Brainina, Kh.Z., M.B. Vydrevich, 1981. StrippingAnalysis of Solids (Review). Journal of Electroanalytical Chemistry. 121, 1–28. [ Links ]
Grygar, T., 1995: Kínetics of electrochemical reductive dissolution of RIon (III) hidroxy–oxides.Collections of Czchoslovak Chemical Communications, 60, 1261– 1273. [ Links ]
Grygar, T., 1996b. Electrochemical dissolution of RIon (III) hidroxy–oxides: more information about the particles. Collections of Czechoslovak Chemical Communications, 61, 93–106. [ Links ]
Grygar, T., 1997. Dissolution of pure and substituted goethite controlled by the surface reaction under conditions of abrasive stripping voltammetry. Joumal of Salid State Electro– chemistry, 1, 77–82. [ Links ]
Grygar, T., 1998. Phenomenological kinetics of RIreversible electrochemical dissolution of metal–oxide microparticles. Journal of Electroanalytical Chemistry , 2, 3, 127–136. [ Links ]
Grygar, T. and J. H. M. van Oorschot, 2002. Voltammetric identification of pedogenic RIon oxides in paleosol and loess. Electroanalysis 14, 339–344. [ Links ]
Grygar, T., R. Kral, C. Nekovarik and P. Zelanda, 1997. Journal of the Czech. Geological Society, 42, 121. [ Links ]
Hickling, A. andD. J. G. Ives, 1975. The electrochemical behaviour of RIon oxides in dilute sulphuric acid and the interpretation of the flade potential of RIon. Electrochimica Acta, 20, 63–69. [ Links ]
Kissinger, P. T. and W. R. Heinaman, (Editors), 1984. Laboratory techniques in Electroanalytical Chemistry. Monographs in Electroanalytical Chemistry and Electrochemistry, 5. Marcel Dekker, New York, 751 pág. [ Links ]
Scholz, F. and B. Meyer, 1994. Electrochemical solid state analysis: State of the art. Chemical society Reviews: 341 –347. [ Links ]
Scholz, F. and B. Meyer, 1998. Voltammetry of solid microparticles inmovilized on electrode surfaces. In: A.J. Bard and I. Rubinstein (Editors), Electroanalitycal Chemistry – A series of Advances. Marcal Dekker Inc., New York, pp. 1–86. [ Links ]
Scholz, F., L. Nitschke and G. Henrion, 1989a. A new procedure for fast electrochemical analysis of solid materials. Naturwissenschaften, 76, 71–72. [ Links ]
Van Oorschot, I.H.M., 2001. Chemical distinction between lithogenic and pedogenic RIon oxides in envRIonmental magnetism. Geologica Ultraiectina N° 208, Part 3, Voltammetry of Microparticles. [ Links ]

