


Serviços Personalizados
Journal
Artigo
 Inglês (pdf)
 Artigo em XML
 Referências do artigo
 Enviar este artigo por email
Indicadores
-
 Citado por SciELO
 -
 Acessos
Links relacionados
-
 Similares em
SciELO
Similares em
SciELO
Compartilhar

 Permalink
Geofísica internacional
versão On-line ISSN 2954-436Xversão impressa ISSN 0016-7169
Geofís. Intl vol.47 no.4 Ciudad de México Out./Dez. 2008
Article
Precipitation variability and soil water content in Pampean Flatlands (Argentina)
J. Forte Lay1*, O. Scarpati1,2 and A. Capriolo1
1 CONICET Consejo Nacional de Investigaciones Científicas y Tecnológicas, Paraguay 2155. Piso 16, 1121, Buenos Aires, Argentina. Email: albertocapriolo@yahoo.com.ar *Corresponding author: jafortelay@arnet.com.ar
2 Departamento de Geografía, Universidad Nacional de La Plata, Calle 48 N° 555, 1900, Piso 5, La Plata, Argentina. E–mail: olgascarpati@yahoo.com.ar
Received: March 7, 2007
Accepted: August 26, 2008
Resumen
El presente trabajo tiene como finalidad demostrar la variabilidad en los montos de precipitación en la llanura pampeana durante las últimas décadas y por consiguiente los cambios en los contenidos de agua en el suelo. Se analizaron dos períodos de treinta años cada uno (1947–1976 y 1977–2006) y se encontró un mayor monto en la precipitación anual en el último período en toda el área de estudio. Se localizaron áreas con diferentes aumentos en la precipitación anual, ellos oscilaron entre 50 y 200 mm. El mayor incremento en la precipitación se registró en el semestre cálido (Octubre–Marzo) en el centro–oeste de la región. Una de las consecuencias de este incremento fue el aumento en la disponibilidad de agua en el suelo, la cual es de fundamental importancia en el desarrollo de la actividad agrícola.
Palabras clave: Argentina, región Pampeana, clima, humedad edáfica, uso del suelo.
Abstract
The goal of this paper is to show the precipitation variability in pampean flatlands during the last decades and the consequential changes in soil water content. Two periods of 30 years each (1947–1976 and 1977–2006) were analyzed and an increase in annual precipitation all over the region was found in the last one. Areas with different increase in precipitation were located and these varied between 50 and 200 mm in annual precipitation. The bigger increase was found in the warm semester (October–March) in the center–western part of the region. One of the consequences of this was the increase in soil water supplies, which is very important for the development of agricultural activities.
Key words: Argentina, pampean region, climate, soil moisture, landuse.
Introduction
Climate can be considered a natural resource. Civilizations develop under the tacit assumption that the climate remains constant. Climate does vary, for example, from one century to another and from one year to the next. And humanity manages its affairs and its survival – as do flora and fauna, managed and unmanaged ecosystems – to varying degrees of success within such climate variability. Climate of the globe as a whole can change (above and beyond mere variability) for causes that are external to the climate system, such as changing Sun's radiation or volcanic eruption spewing ash and soot into the atmosphere – or for causes that are within the system – such as large scale conversion of forests to agricultural and pasture lands (Scarpati, 2007). Climate can also change at local scales by activities such as depletion of ground water and consequent decrease in soil moisture (Scarpati, 2007). Climate change can have direct consequences: it is known that the demise of some of the past civilizations was associated with prolonged climate stress including shifts in precipitation patterns (Obasi, 2004).
It is very important understanding the fundamental causes of climate variability. The policy issue of sustainable use and management of natural resources are addressed in this context.
Weather conditions, including seasonal to interannual extremes and variations, locally, regionally or across the globe averaged over a period of time long enough to establish statistical properties for that period largely independent of any instantaneous atmosphere state, is considered climate.
From a climatological point of view, the term climate change refers to the difference between the mean values of a climate parameter or statistics that is the difference between climatic states, which is outside the normal range of natural climate variability, whatever the cause may be (Arnell, 1996). The term climate variability denotes deviation or anomalies of climate parameter over a given period of time. In the most general sense, however, climate variability can be described by the differences between long–term statistics of meteorological elements calculated for different periods (Arnell, 1996).
Estimates of changes in agricultural production are dependent upon a) how climate changes at regional scales; b) assumptions regarding adaptation by producers and consumers; c) future technologies; d) population and income growth; e) land degradation; f) macroeconomic conditions; g) changes in international trade barriers; and h) changes in social and political conditions (Adams, 2004). The results are also sensitive to the assessment methods and models employed in these estimation exercises.
Agronomic and economic impacts from climate change depend primarily on two factors: (1) the rate and magnitude of change in climatic variables and the biophysical effects of these changes and (2) the ability of agricultural systems to adapt to changing environmental conditions (Adams, 2004).
The flexibility of agricultural systems suggests there is a significant human potential to adapt to climate change. Appropriate choices can lessen the yield losses that might result from climate change, or improve yields where climate change is beneficial. At the market level, yield changes will generate price and supply changes that can signal further opportunities to adapt (Adams, 2004). Climate affects plant development and crop production either directly or indirectly.
The main source for moisture to natural vegetation and crops is rainfall; additional water is available from capillary rise of ground water and from moisture that has been stored in the soil after the rainy season. The importance of capillary rise is estimated at 1–2 mm per day, depending on the depth of the groundwater, soil texture and relative air humidity (Verheye, 2004). Soil moisture storage depends mainly on soil depth, texture and organic matter content; it may range from an approximate 30–50 mm in shallow and sandy soils to more than 200 mm in deep loams and clay–loams (Verheye, 2004).
Mean annual precipitation is the most common and simplest climatic parameter for characterizing the moisture status in an area. It is however incomplete and not very relevant as an expression of moisture availability for agriculture or forestry because it gives no information on the precipitation pattern and on the eventual occurrence of intermediate dry spells. Rainfall information used for land evaluation purposes has therefore imperatively to include both the amount and the distribution of rain over the year.
Annual rainfall data define the moisture status of trees and perennials, but for annual crops only the rainfall in the growing period is relevant. As an example, a number of classification systems only take into account the April to September (Britain) or May to September (Canada) precipitation (Verheye, 2004). This gives not only a measure of the moisture status in the main part of the growing season, but also permits estimations of water deficiencies and their direct impact on crop behaviour and production (Verheye, 2004).
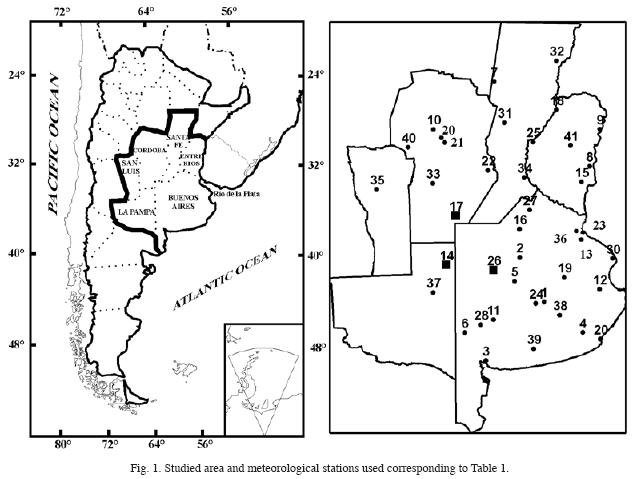
The main agricultural region of Argentina is located in the pampean flatlands of the provinces of Buenos Aires, Santa Fe, Córdoba, Entre Ríos, La Pampa and San Luis (Fig. 1). This area covers about 840,000 km2. Wheat, maize, soybean, sunflower and pastures for cattle rising are the most important land uses of this region. Most of the regional crops are grown in non–irrigated land and frequently the availability of soil moisture during the summer limits the yields; this is demonstrated in the regional climatology of the soil water (Forte Lay and Spescha, 2001, a). El Niño and La Niña events impact the precipitation (Forte Lay and Aiello, 2001) and soil water storage (Forte Lay and Spescha, 2001, b, and Spescha and Forte Lay, 2002) in several ways.
Pampean plain with natural pasture is now very modified for human activities. It presents a high degree of technology and improvements in its non irrigated area, mainly in its central – eastern part. Its agricultural frontier is advancing towards the north, west and southwestern area, due to the climatic fluctuation in the last decades, and for that, its limits are dynamics.
Soil water surplus is the quantity of rainwater on the soil surface resulting when soil storage capacity is achieved. This water is often not able to infiltrate because the water table is generally too close the surface; this is the case in many depressed areas of pampean flatlands. The vertical hydrologic fluxes of rainfall and evapotranspiration are more important in regions of low relief like the study area, than horizontal movements or surface and subsurface flows. The water table is elevated during periods of surplus, eventually rising to the surface, thereby increasing flood potential and the area of lakes, ponds and surface impoundments. This situation is more common now over the pampean flatlands as a result of increased precipitation, during the last decades according to Castañeda and Barros (1994), Minetti and Vargas (1997), and Rusticucci and Penalba (2000).
According to Barros et al. (2000) subtropical Argentina, Paraguay and South of Brasil have experienced more precipitation during summer, but the interannual variability is larger. In this season, a convergence zone at low level, divergence in high level and an intense convection is developed north of this region. This is known as South Atlantic Convergence Zone (SACZ) and it seemed to have a relationship with the interannual precipitation variability.
Kruse et al. (2001) describe the relationship between precipitation, evapotranspiration, soil water storage, soil water surplus, water table subsurface and surface runoff under different scenarios in the north–west of the Buenos Aires province. There they observed a good temporal relationship between water table levels and the surplus.
Several authors, including Forte Lay et al., (2005), remarked the benefits for the crop yields caused by the more humid conditions during the last decades, mainly because this precipitation increase occurred in the more arid areas in spite of other negative consequences.
The goal of this paper is show the precipitation variability in pampean flatlands during the last decades and the consequential changes in soil water content.
Materials and Methods
Fig. 1 shows the general setting of the studied area and the meteorological stations used.
Monthly precipitation data, for the period 1947–2006, are provided by the National Meteorological Service (SMN) and by the National Institute of Agronomic Technology (INTA). Normal mean potential evapotranspiration are calculated by the Penman method (Damario and Cattáneo, 1982).
The spatial and temporal variability of the soil water storage are examined using the Forte Lay – Aiello method (1996) which permits the estimation of the soil water content and its anomalies. It is based on the Thornthwaite and Mather daily soil water balance using measured precipitation and daily mean potential evapotranspiration calculated by the Penman method (Frère, 1972).
The meteorological stations were selected according to their long record, homogeneity and historical development.
Table 1 shows the 41 meteorological stations used in this paper which fulfil all the requirements in the region and in its surroundings. Most of SMN stations are situated at airports since 1959 or 1961, before they functioned in the city of the same name and were managed by the same institution. So, we considered that this does not influence the data homogeneity, and this fact is reinforced with the plain landscape of pampean flatlands.

Three meteorological stations: Laboulaye, in Córdoba province, General Pico in La Pampa province and Pehuajó in Buenos Aires province, were selected to visualize the modification on soil water storage caused by the different amount in precipitation during the two studied periods. They are specially marked in Fig. 1b.
For the statistical study, the series of soil water storage data obtained were adjusted following Forte Lay and Troha, (1987 and 1988), by means of the theoretical Beta (I) two parameters probability distribution.
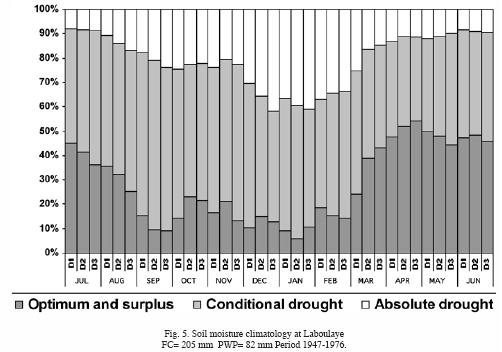
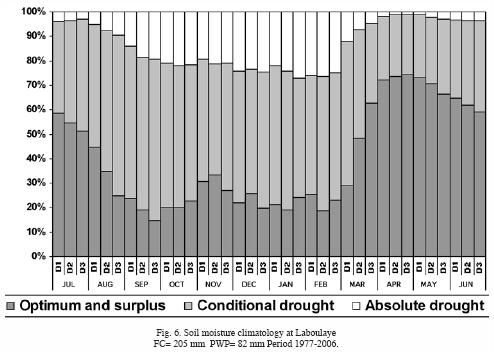
The total soil moisture can be divided in two equal parts: the available soil water content and the non useful water. The permanent wilting point (PWP) is the limit between them. The available soil moisture can be divided in two equal parts: the optimum soil water content and the conditional drought content which limit is the conditional drought level (CDL). The last one has been chosen as the upper limit of drought in this paper. The total soil moisture content varies from field capacity (FC) until the natural limit of desiccation (LD). LD is variable according to soil texture, being more close to the PWP in loamy and clay soils than in sandy ones, where it is lower. All the mentioned parameters vary according the soil texture and the effective depth (root zone), which depends of a restrictive horizon existence. Some soils with high effective depth reach one meter or more and have high FC. In other soils, with low effective depth, root zone only reach depths close to the surface and so the FC diminishes. All these variables were considered in the realization of this paper.
Ten days' soil water storages climatology were done for all the meteorological stations and for both analyzed periods: 1947–1976 and 1977–2006. First, daily water balances were realized without using Kc crop's coefficient. This means considering a water consumption of a permanent prairie or reference permanent prairie and obtaining a ten days storage average (three ten day's average by month).
Daily soil water balances were done for the three selected localities, Laboulaye, Pehuajó and General Pico and considering the whole period 1947–2006. These water balances take into account the mentioned Kc coefficients for each culture. The soybean water balance considered a sowing on November 7 and a critical period to soil moisture between January 15 and February 28. In this period the soybean Kc surpass 1, value corresponding to those of the reference prairie. The maize Kc considered a sowing at October 10 and a critical period between December 15 and January 20, when Kc is bigger than 1 (Forte Lay et al., 2005).
Results and Discussion
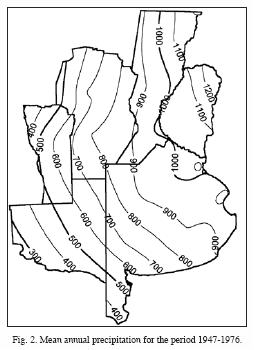
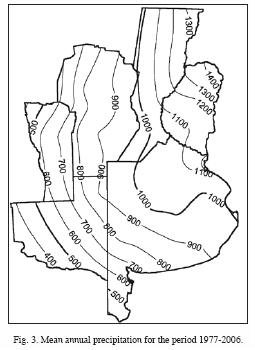
In Fig. 2 the mean precipitation isohyets for the period 1947–1976 can be seen and in Fig. 3 for the period 1977–2006.
There is an important difference in the precipitation pattern between the two considered periods (Fig. 4). The differences are all larger than 50 mm and there is an important area with differences between 100 and 150 mm, which is reviewed below. The value 200 mm is only reached in a small surface at the northwest of Entre Rios province.
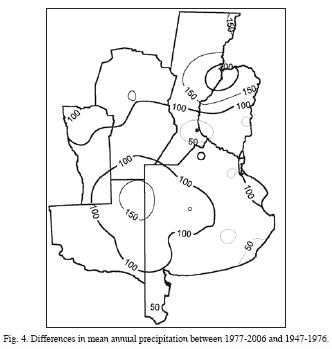
At northwest and west of Buenos Aires province, south of Córdoba province and northeast of La Pampa the differences are the most important because these caused changes in land uses, where livestock was replaced by agriculture.
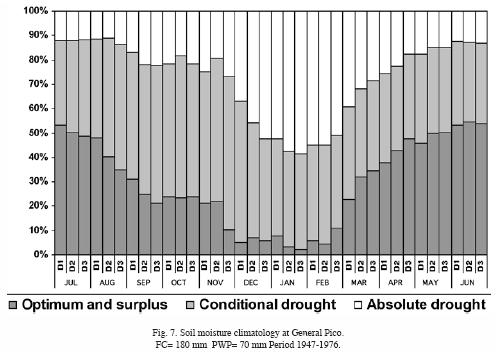
The different amounts in precipitation that modify the soil water storage for the two considered periods, 1947–1976 and 1977–2006, can be seen for Laboulaye, Pehuajó and General Pico (Fig. 5 to Fig. 10).(Figures 5, 6, 7, 8, 9 and 10) In these figs. it can be seen, for the last period, the increase of the probabilities corresponding to the category optimum and surplus (dark bars longitude) and the diminished of the absolute drought probabilities (white bars longitude). This is specially observed in the ten days series corresponding to the warm semester. The mentioned effect is very remarkable in General Pico (Fig. 7 and 8). The increases are too notable for the other two localities: Laboulaye (Fig. 5 and 6) and Pehuajó (Fig. 9 and 10).


To visualise the experimented changes in the soil water content in the two periods: 1947–1976 and 1977–2006, it is interesting to see what would happened to maize and soybean, the most important crops of the region.
For each critical period, for both crops, and for the three localities the mean soil water moisture for each year since 1947 to 2006 were calculated as can be seen at figs. 11 to 16, (figures. 11, 12, 13, 14, 15 and 16) like bars. Considering the soil constants according to each soil, a point line represents the permanent wilting point (PMP) and a dashed line represents conditional drought (CDL) which divides useful water in two equal parts. Below PMP means it is absolute drought with danger of crop loss. The area between PMP and CDL is conditional drought, and if it is more close to PMP the crop situation is more vulnerable to lower water provision, but if it is near CDL the situation is not severe. From CDL to Field Capacity (FC), at the upper part of the figures, it is optimum humidity and the crop can develop all its potential, mainly close to FC.
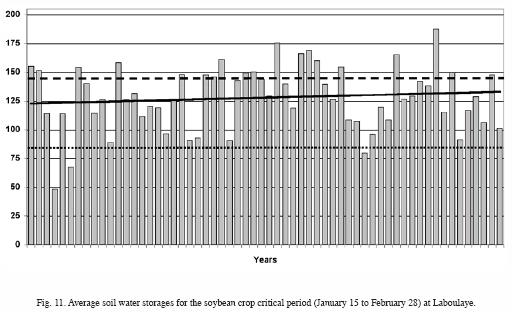
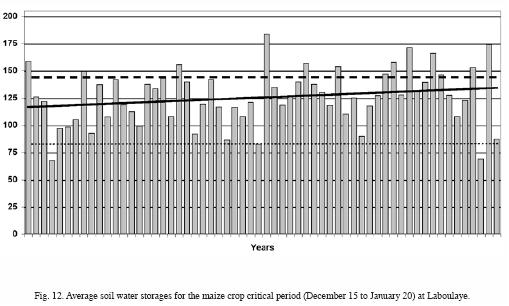
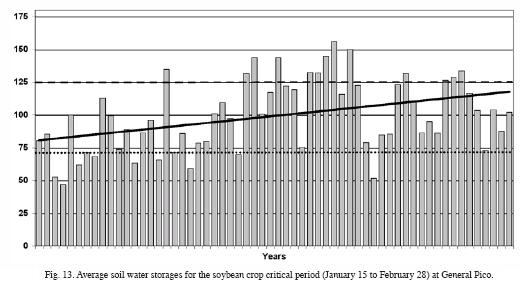
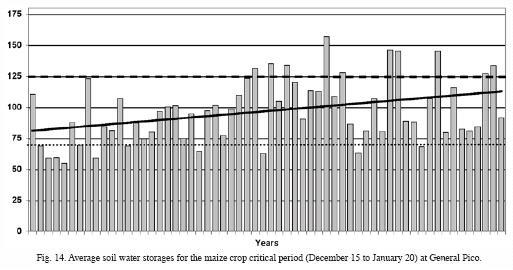
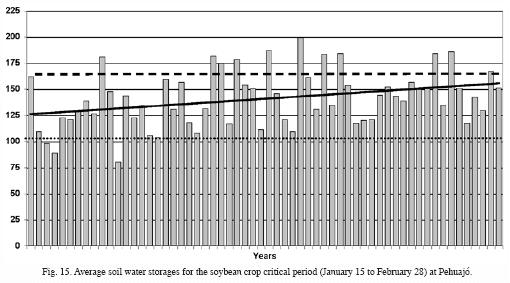
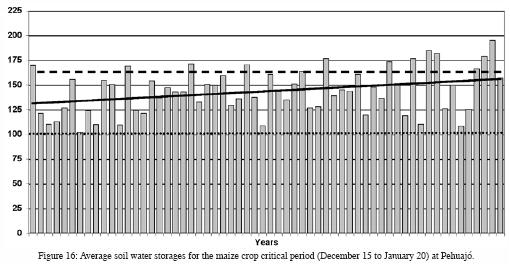
Trends of the soil water content for the critical periods were calculated and can be observed in Figs. 11 to 16. The three localities and both crops have a positive trend, mainly in General Pico. A bigger proportion of years with possible crop losses can be seen in the period 1947–1976 than in the other period. Otherwise, it can be seen a little quantity of years with optimum soil water content in the first period and a bigger one in the second period.
Conclusions
1.– During the last three decades an increase in annual mean precipitation occurred in comparison to the preceding 30 years.
2.– The annual increase varied between 50 and 200 mm according to different zones.
3.– Changes in land uses were one of consequences, mainly in centre west area of the region where rangelands passed to crop fields.
4.– The change verified in precipitations has had, as main consequence, an increase in the soil water availability, where dryland is the predominant practice.
5.– This change in soil water availability has been more verifiable in the warm semester (October–March) than in the cold semester (April–September), favouring the success of summer cultures.
6.– Making a simulation by means of soil water balance of could have happened to two of the more important summer cultures, maize and soybean, referred to their critical periods in three localities situated in the centre–west of the region, both verify a greater frequency of cases with optimal humidity and a smaller amount of cases with drought in the last 30 years period.
7.– It is inferred that the verified change is not permanent, and it simply deals with a climatic fluctuation. The return to the previous situation to the '70 decade could have negative consequences on farming production.
Bibliography
Adams, R. M., 2004. Climate Change and Agriculture, in Climate Change, Human Systems and Policy., Ed. Antoaneta Yotova in Encyclopedia of Life Support Systems (EOLSS), Developed under the Auspices of the UNESCO, Eolss Publishers, Oxford, UK, (http://www.eolss.net). [ Links ]
Arnell, N. W., 1996. Global Warming, River Flows and Water Resources. Wiley, Chichester, UK. 224pp. [ Links ]
Barros, V., M. González, B. Liebman and I. Camilloni, 2000. Influence of the South Atlantic convergence zone and South Atlantic sea surface temperature on interannual rainfall summer variability in southeastern. South America Theor. Appl. Climatol., 67,123–133. [ Links ]
Castañeda M. and V. Barros, 1994. Las tendencias de la precipitación en el cono sur de América al este de lo Andes. Meteorológica, 21, 23–32. [ Links ]
Damario, E. A. and C. Cattáneo, 1982. Estimación climática de la evapotranspiración potencial en la Argentina según el método de Penman 1948. Rev. Fac. Agr., 3, 3, 271–292. [ Links ]
Forte Lay, J. A., O. E. Scarpati and J. L. Aiello, 2005. El ENOS y su relación con el agua en el suelo en períodos críticos para el cultivo de maíz en la región pampeana. RADA. Revista Argentina de Agrometeorología. 3–4, 77–83, 2003/2004. [ Links ]
Forte Lay, J. A. and J. L. Aiello, 2001. Relaciones entre el MEI (multivariate ENSO index) y las precipitaciones en la Argentina continental. IX Congreso Latinoamericano e Ibérico de Meteorología. VIII Congreso Argentino de Meteorología. CLIMET IX–CONGREMET VIII. CD ROM. [ Links ]
Forte Lay, J. A. and L. B. Spescha, 2001. a. Método para la estimación de la climatología del agua edáfica en las provincias pampeanas de la Argentina. Revista Argentina de Agrometeorología, RADA, 1, 1, 67–75. Buenos Aires. Argentina. [ Links ]
Forte Lay, J. A. and L. Spescha, 2001. b. El Niño y su impacto en la reserva de agua edáfica en la región pampeana. VIII Congreso Argentino de Meteorología y IX Congreso Latinoamericano e Ibérico de Meteorología. Buenos Aires, Argentina. CD ROM. [ Links ]
Forte Lay, J A. and J. L. Aiello, 1996. Método para el diagnóstico de la reserva hídrica del suelo y sus anomalías en las provincias pampeanas. Training Course on Practical Applications of Seasonal–to–Interannual Climate predictions to Water Resources and Agriculture for Mesoamerica and the Caribbean". International Research Institute (IRI) for Seasonal to Interannual Climate Prediction. Instituto de Meteorología de Costa Rica. San José. Costa Rica. Pág. 15. [ Links ]
Forte Lay, J. A. and A. Troha, 1988. Utilización de la función Beta para la estimación de probabilidades de humedad edáfica. Anales del V Congresso Brasileiro de Meteorologia. (Brasil). Vol. 1. Pág. 6 10. [ Links ]
Forte Lay, J. A. and A. Troha, 1987. Distribución de probabilidad de valores de humedad edáfica. GEOACTA (AAGG). Argentina. 14, 1. Pág. 141 152. [ Links ]
Frère, M., 1972. A method for the practical application of the Penman formula for the estimation of potential evapotranspiration and evaporation from free water surfaces. FAO–AGP:AS/1972/2, Rome. [ Links ]
Kruse, E., J. A. Forte Lay, J. L. Aiello, A. Basualdo and G. Heinzenknecht, 2001. Hydrological processes on large flatlands: case study in the northwest region of Buenos Aires Province (Argentina). International Association of Hydrological Sciences. IAHS, 267, 531–535. [ Links ]
Minetti, J. and W. Vargas, 1997. Trends and jumps in the annual precipitation en South America on the 15° S. Atmósfera, 11, 205–221. México. [ Links ]
Obasi, G. O. P., 2004. Climate Change and Natural Resources Policy and Management , in Climate Change, Human Systems and Policy, Ed. Antoaneta Yotova, in Encyclopedia of Life Support Systems (EOLSS), Developed under the Auspices of the UNESCO, Eolss Publishers, Oxford ,UK, (http://www.eolss.net). [ Links ]
Rusticucci, M., O. Penalba, 2000. Interdecadal changes in the precipitation seasonal cycle over Southern South America and their relationship with surface temperature. Climate Research, 1, 16, 1–15. [ Links ]
Spescha, L. and J. A. Forte Lay, 2002. Impacto de La Niña en la reserva de agua edáfica en la región pampeana. RADA. Revista Argentina de Agrometeorología, 2, 1, 81–88. [ Links ]
Scarpati, O. E., 2007. Hydrology. Geography. Editor M. Sala. 58 St. Aldates, Oxford, OX1 1ST, United Kingdom. Eolss Publishers/ UNESCO. www.eolss.net/eBooks. ISBN: 978–1–905839–60–5 eBook. [ Links ]
Verheye, W. H., 2004. Agro–Climate–Based Land Evaluation Systems, in Land Use and Land Cover, (Ed. Willy H. Verheye), in Encyclopedia of Life Support Systems (EOLSS), Developed under the Auspices of the UNESCO, Eolss Publishers, Oxford ,UK, (http://www.eolss.net). [ Links ]

