


Serviços Personalizados
Journal
Artigo
 Inglês (pdf)
 Artigo em XML
 Referências do artigo
 Enviar este artigo por email
Indicadores
-
 Citado por SciELO
 -
 Acessos
Links relacionados
-
 Similares em
SciELO
Similares em
SciELO
Compartilhar

 Permalink
Geofísica internacional
versão On-line ISSN 2954-436Xversão impressa ISSN 0016-7169
Geofís. Intl vol.47 no.4 Ciudad de México Out./Dez. 2008
Article
Magnetic characteristics and archeointensity determination on Mesoamerican Pre–Columbian Pottery from Quiahuiztlan, Veracruz, Mexico
J. M. López–Téllez1, B. Aguilar–Reyes1, J. Morales1*, A. Goguitchaichvili1, M. Calvo–Rathert2 and J. Urrutia–Fucugauchi3
1 Laboratorio Interinstitucional de Magnetismo Natural, Instituto de Geofísica, Sede Michoacán, Universidad Nacional Autónoma de México, Morelia, Mexico. * Corresponding author: jmorales@geofisica.unam.mx
2 Departamento de Física, Escuela Politécnica Superior, Universidad de Burgos, C/Francisco de Vitoria, Burgos, Spain.
3 Laboratorio de Paleomagnetismo y Paleoambientes, Instituto de Geofisica, Universidad Nacional Autónoma de México, México D.F., C.P. 04510, Ciudad Universitaria, Mexico.
Received: March 13, 2008
Accepted: July 3, 2008
Resumen
Reportamos una investigación arqueomagnética detallada de algunas cerámicas pre–Colombinas de Quiahuiztlan (Veracruz, Golfo de México). Las muestras estudiadas pertenecen al intervalo de ~900 D.C. a 1521 D.C. Las muestras, analizadas por técnicas magnéticas modernas, parecen portar esencialmente una magnetización termoremanente estable y univectorial, observada a partir del tratamiento por campos magnéticos alternos. Las curvas continuas de susceptibilidad magnética inicial de bajo campo contra temperatura obtenidas en aire señalan como responsables de la magnetización a las titanomagnetitas pobres en Ti. Algunas muestras, sin embargo, presentan dos fases ferrimagnéticas con temperaturas de Curie compatibles con aquellas de las titanomagnetitas pobres y ricas en Ti. Los parámetros de histéresis magnética caen esencialmente en la región de los pseudos dominios sencillos– lo cual podría corresponder alternativamente a una mezcla de granos multi–dominio con una cantidad significativa de granos de domino sencillo. Las determinaciones de la intensidad geomagnéticas antigua obtenidas por medio del método de Thellier modificado por Coe fueron obtenidas de 90 muestras seleccionadas. Los valores de arqueointensidad corregidos por ritmo de enfriamiento varían entre 34.0 ± 1.2 y 62.2 ± 0.2 µT. Los momentos dipolares axiales virtuales correspondientes (VADM) varían entre 5.7 y 10.7 x10²² Am2. Las curvas de intensidad absoluta para Mesoamérica poseen una resolución espacial/temporal limitada. Para propósitos de fechamiento tentativo, utilizamos curvas globales de arqueointensidad reducidas a México central y del este, dando algunos fechamientos preliminares para la cerámica de Quiahuiztlan. La comparación de nuestros datos contra aquellos reportados en la base de datos ArcheoInt nos permitió identificar dos periodos (900– 1000 y 1400–1600 DC) como los rangos mas probables de fabricación de las cerámicas estudiadas.
Palabras clave: Arqueointensidad, propiedades magnéticas, cerámicas, Mesoamérica, Quiahuiztlan, Golfo de México.
Abstract
We report a detailed archeomagnetic investigation on pre–Columbian potteries from Quiahuiztlan, Veracruz, from ~900 AD to 1521 AD. Archeological samples analyzed by modern magnetic techniques carry a stable univectorial thermoremanent magnetization under alternating field treatment. Continuous low–field susceptibility vs. temperature curves performed in air indicates Ti–poor titanomagnetites as magnetization carriers. Few samples, however, show two ferrimagnetic phases with Curie temperatures compatible with both Ti–poor and Ti–rich titanomagnetites. Hysteresis parameter ratios fall essentially in the pseudo–single–domain region, which may indicate a mixture of multi–domain and a significant amount of single domain grains. Early geomagnetic field intensity determinations using the Coe variant of Thellier method were performed on 90 selected samples. Cooling rate corrected intensity values range from 34.0 ± 1.2 to 62.2 ± 0.2 µT. Corresponding virtual axial dipole moments (VADM) range from 5.7 to 10.7 x10²² Am2. Absolute intensity curves for Mesoamerica present limited spatial/temporal resolution. For tentative dating purposes, we used global archeointensity curves reduced to central and eastern Mexico that permit preliminary dating of Quiahuiztlan potteries. Comparison of our data against those reported in ArcheoInt database allow to identify two periods 900– 1000 and 1400–1600 AD as the most probable manufacturing ranges for the potteries studied.
Key words: Archeointensity, Magnetic Properties, Pottery, Mesoamerica, Quiahuiztlan, Gulf of Mexico.
Introduction
Archeological remains are abundant in Mexico, but archeomagnetic studies are still scarce and of uneven quality (Morales et al., 2008). In the early seventies, Wolfman (1973) reported archeomagnetic directions from some sites in Central and Eastern Mexico. Unfortunately most of the archeological material that can be used in archeomagnetism is not oriented. Thus, relatively few reliable paleodirections of the geomagnetic field may be obtained. Absolute geomagnetic intensity studies (archeointensity) have the advantage that no oriented material is required. Nonetheless, few studies have been carried out in the region (e.g., Nagata et al., 1965; Bucha et al., 1970; Urrutia–Fucugauchi, 1975). High quality studies have been carried out for other places in America (southwestern U.S. and northwestern South America; e.g., Kono et al., 1986; Sternberg, 1989; Bowles et al., 2002 and references therein). Bowles et al. (2002) presented archeointensity records for southwestern U.S. and northwestern South America reporting rather different curves in terms of field variation, probably related to non–dipole field effects across distant regions.
Since an archeointensity master curve for Mesoamerica is yet of preliminary nature (e.g., Gonzalez et al., 1997; Urrutia–Fucugauchi, 1996), we used global data curves (McElhinny and Senanayake, 1982; Yang et al., 2000; Bowles et al., 2002; Genevey and Gallet, 2003) reduced to eastern Mexico (19° 40' 11.4" N, 96° 24' 54.9" O) as an alternative way of dating. We carried out in this study several magnetic experiments (susceptibility vs. temperature curves, alternating field and thermal demagnetization, hysteresis cycles and archeointensity) on fragments of Pre–Columbian pottery from the Quiahuiztlan archeological site (Veracruz State, Mexico).
Location and samples
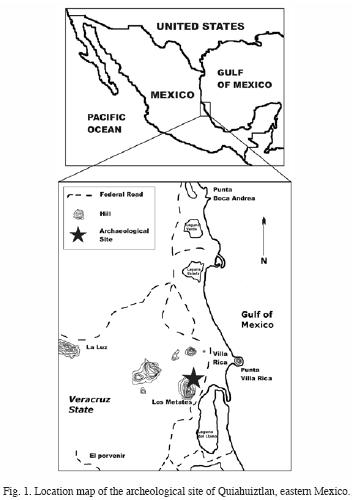
The archeological site of Quiahuiztlan (Fig. 1) is located in the central zone of Gulf of Mexico, Veracruz State, Mexico. This site presents cultural vestiges that match to the central Totonacapan culture (Arellanos, 1997). Quiahuiztlan – a city–cemetery–fortress, was apparently shared between several groups of the central coastal Totonacapan and seems to correspond to the Post–classic period (900 – 1521 AD). In addition, it is one of the first important human settlements known by Spaniards at their arrival to American territory (Arellanos, 1997).
Fragments under study correspond to pottery artifacts. During their manufacturing process these materials were baked inside a kiln and later cooled in the presence of the ambient magnetic field. Most samples correspond to basic utensils used by the old settlers in their routine life and the manufacture style is considered coarse. It's unlikely that these pieces have been imported from other places. There is archeological evidence that the site was occupied from about 900 to 1521 AD. This is supported by an authenticity test using thermoluminescence, confirming a pre–Columbian origin with an average absolute age of 600 years.
Twenty–six fragments from three different sites within the archeological zone were analyzed. The fragments were previously washed with distilled water and separated into three groups. These fragments were further divided into at least five pieces and embedded into salt pellets in order to treat them as standard paleomagnetic cores (for more details on sample preparation, please see in Morales et al., 2008).
Magnetic characteristic
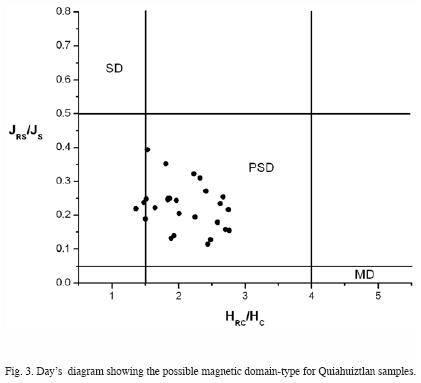
Magnetic hysteresis measurements at room temperature were performed on all studied samples using an AGFM "Micromag" apparatus in fields up to 1 T. The saturation remanent magnetization (Jrs), the saturation magnetization (Js), and the coercive force (Hc) were calculated after correction for the paramagnetic or diamagnetic contribution. Coercivity of remanence (Hcr) was determined by applying a progressively increasing backfield after saturation. Some typical hysteresis plots are reported in the left part of Fig. 2. The curves are symmetrical in all cases. IRM (isothermal remanent magnetization) acquisition curves (right part of Fig. 2) show saturation at moderate fields from 150 to 250 mT, which point to the presence of ferrimagnetic minerals as remanence carriers, more likely Ti–poor titanomagnetites (Gogichaishvili et al., 2004). The hysteresis parameters reported in a Jrs/Js versus Hcr/Hc plot (Fig. 3) are essentially in the pseudo–single–domain (PSD) range (Day et al., 1977). This also could indicate a mixture of multi–domain (MD) and a significant amount of single domain (SD) grains (Parry, 1982; Dunlop and Özdemir, 1997; Dunlop, 2002). However, we note that the room temperature hysteresis parameters have limited resolution in estimating domain state of most natural rocks (Gogichaishvili et al., 2001).
Selected samples carry essentially a stable, univectorial remanent magnetization observed upon alternating field treatment (Fig. 4a). Median destructive fields range mostly in the 20 – 40 mT interval, confirming the existence of pseudo–single–domain grains as remanence carriers (Dunlop and Özdemir, 1997).
Continuous low–field susceptibility vs. high–temperature curves performed in air show the presence of Ti–poor titanomagnetite as dominant magnetic mineral (Fig. 5). Only exception is sample Q1L which shows two ferrimagnetic phases with Curie temperatures compatible to both Ti–poor and Ti–rich titanomagnetites. Some samples show low initial susceptibility signal, which indicates poor magnetic mineral presence (sample Q1A, Fig. 5). For archeointensity determination we selected samples that show almost reversible k–T curves.
Archeointensity determination
Archeointensity experiments were performed using the Thellier method (Thellier and Thellier, 1959) in its modified form (Coe, 1967). Heating and cooling were made in air and the laboratory field was set to 30 µT. Due to the design of the thermal demagnetizer chamber (ASC TD–48) and for practical reasons, samples were divided in two groups: Series 1 and Series 2 (Table 1a and b). Series 1 included specimens: Q2A, Q2B, Q2C, Q2D Q2E, Q2H, Q3A, Q1A and Q1C while Series 2 consisted of: Q1D, Q1H, Q1I, Q1J, Q1K, Q1M, Q1N, Q1L and Q1P. Eleven to twelve temperature steps were distributed between 200 and 575°C. Several control heatings (i.e. reinvestigations of results from previous heating steps, commonly referred to as partial TRM (pTRM) checks) were performed throughout the experiments (Fig. 6).
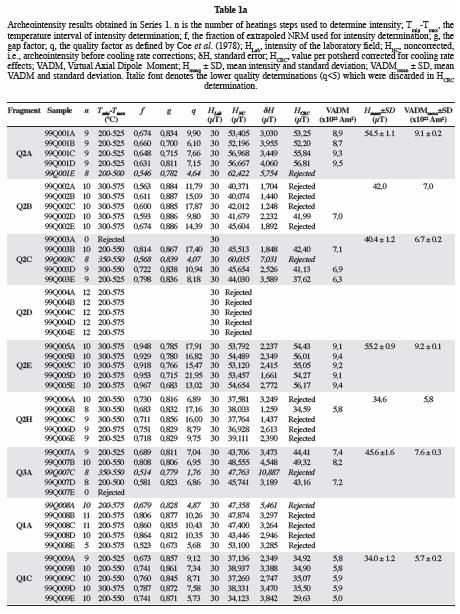
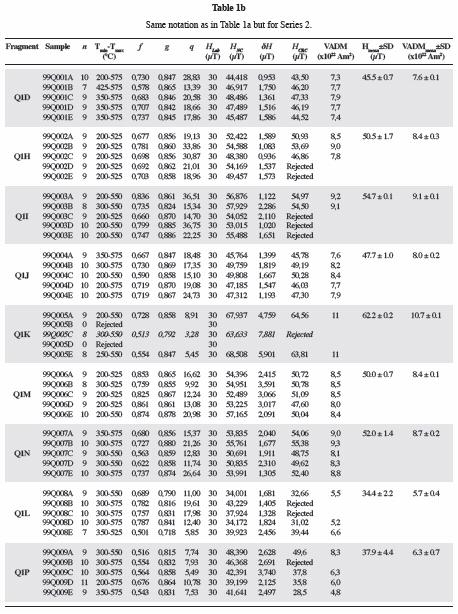
Strength of thermoremanent magnetization of the samples is also related to cooling rate (e.g. Fox and Aitken, 1980; McClelland–Brown, 1984). Cooling rate dependence of TRM was investigated here following a modified procedure to that described by Chauvin et al. (2000) (see Morales et al., 2008). Contrary to European archeological artifacts manufacture process, which utilized closed brick kilns, Native Americans employed open kilns with cooling times on the order of 1 to 12 h. (Bowles et al., 2002). We have thus decided to use a slow cooling time of 6 ½ hours, from 575°C to 20°C. Cooling rate procedure provided correction factors < 1 for most samples, which corresponds to an overall decrease of the raw intensity values. Cooling rate correction was applied only when corresponding change in TRM acquisition capacity was below 15%. This correction diminished the dispersion of the archeointensity results up to 31.7 %. Results obtained indicate that field intensities have a range from (34.0 ± 1.2 to 62.2 ± 0.2) µT. Corresponding virtual axial dipole moments (VADM) range from 5.7 to 10.0 x10²² Am2.
TRM anisotropy corrections can be implemented in different ways (e.g., McCabe et al., 1985; Selkin et al., 2000; Chauvin et al., 2000, etc.). It basically requires the creation of a TRM along 6 mutually perpendicular directions (+X, +Y, +Z, –X, –Y, –Z) by cooling them from 600 °C to room temperature in a known magnetic field. This involves six additional heatings which may alter significantly the magnetic mineralogy of the samples. To circumvent this time–consuming procedure, individual specimens (belonging to the same fragment) were embedded in the six above described positions into the salt pellets. In this way, possible bias due to TRM anisotropy effects would be canceled, as attested by our various previous test experiments (see Morales et al., 2008).
Discussion and main results
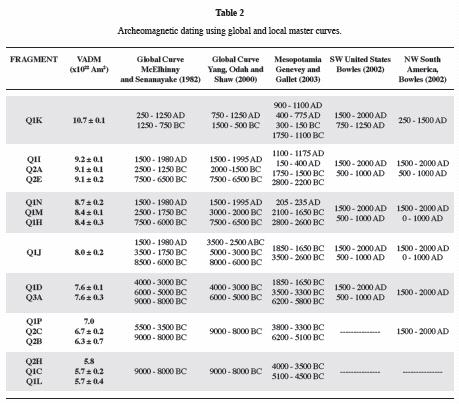
Proposal of a master archeomagnetic curve as an alternative way of dating archeological artifacts has been the aim of researchers for long time. In theory, this would be possible by comparison of the ancient field recorded in archeological artifacts against a previously established geomagnetic intensity variation curve. In this study, we tried several global and local (reduced) geomagnetic intensity variation models to make an estimation of the manufacturing dates of our studied pottery. Global models used for dating proposes were those proposed by McElhinny and Senanayake (1982) and Yang et al. (2000), while local models for United States and South America are those of Bowles et al. (2002), and that from Mesopotamia elaborated by Genevey and Gallet (2003).
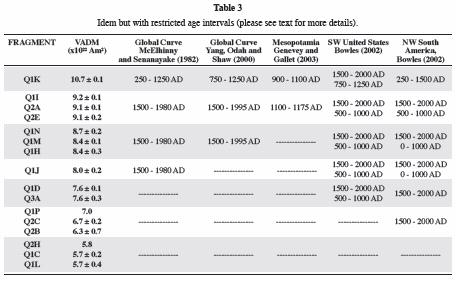
'Possible dates' according to the different models are presented in the Table 2. It is obvious that dating archeological artifact by means of either global or local variation curves is not a straightforward task. As one may appreciate from the Table 2, there are various VADM's that could be associated to different periods throughout the time scale and complementary information such as archeological background and/or alternative dating methods (e.g., radiocarbon or thermoluminescence (TL) dates, etc.) is more than welcome. In this context, we performed an authenticity test on some selected pottery fragments by the TL technique. This test was applied to three fragments; Q1L, Q2C and Q2E. The absolute ages obtained are: 535±70, 770±150 and 500±230 years, respectively. These results confirm the pre–Columbian origin for the studied pottery. These new data allows restricting the time range considered as acceptable or 'true' age of our samples. Indeed, based on archeological considerations and TL measurements the most likely time interval is from 900 to 1521 AD. Moreover, we note that pre–Columbian pottery at eastern Mexico cannot have an antiquity beyond 2500 years BC (Guillermo Acosta, personal communication). This allows us to reject older dates. All these considerations permitted us to propose a more accurate relationship between calculated VDAM's and archeomagnetic datings (Table 3). Nonetheless, there are still some samples that cannot be accommodated in the time intervals proposed here. In spite of high scatter, best results were obtained with the use of local curves of the geomagnetic intensity variation from North and South America. These curves provide, however, a very coarse dating.
It is worth noting that in spite of the concordance between VADM's from different places, archeomagnetic dating on displaced materials by means of VADM's could be little precise. Taking this into account, we made an alternative comparison using only intensity data against geomagnetic field model CALS7K (Korte and Constable, 2005) and the latest archeointensity compilation data ArcheoInt (Genevey et al., 2008), considering the following premises:
1. Based on archeological considerations the most likely time interval for samples analyzed ranges from 900 to 1521 AD
2. An average absolute (TL) age of 600 years.
3. Archeological artifacts are seldom of enough different ages at one location (Schnepp et al., 2003).
4. Smooth secular variation is expected for averaged intensity, as suggested for geomagnetic filed models.
Above premises allowed the construction of Fig. 7, where fragments having similar AI values were reunited in five groups (a–e) and plotted according their minimum and maximum age for their AI value within the time interval suggested by premise 1. Two possible restricted intervals are recognized: from 900 to 1000 AD and from 1400 to 1600 AD, approximately. Both intervals lie on almost linear paths connecting ArcheoInt data points. Groups plot almost symmetrically on both sides from 1200 AD, presenting, however, different variation rates. Right hand interval (1400 to 1600 AD) seems to be better supported by premise 2.
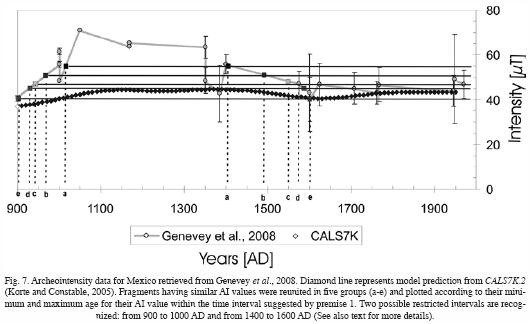
An attempt of dating using model prediction CALS7K failed because of the notorious downward shift of the curve (Morales et al., 2008). One most take into account, however, that data used to model geomagnetic field variation for the last 7 millennia is based mainly on old data, obtained with no strict acceptance criteria without any corrections applied (cooling rate and/or anisotropy correction).
This work confirms usefulness of Mesoamerican pottery for archeointensity studies and opens perspectives to construct a reliable local curve of geomagnetic intensity variation that may be used as an alternative and confident dating method. The use of global archeointensity curves seems to be inappropriate for dating purposes, at least for Mesoamerica.
Acknowledgements
We appreciate the comments and suggestions made by two anonymous reviewers that greatly improve the manuscript. We thank Angel Ramirez–Luna for assistance with the TL experiments. Financial support was provided by CONACYT project # 54957 and 'Proyecto Interno de Investigación G122'.
Bibliography
Arellanos, M. R., 1997. La arquitectura monumental postclásica de Quiahuiztlan, Estudio monográfico, Universidad Veracruzana, 15–49. [ Links ]
Bowles, J., J. Gee, J., Hildebrand and L. Tauxe, 2002. Archeomagnetic intensity results from California and Ecuador: evaluation of regional data, Earth Planet. Sci. Lett., 203, 967–981. [ Links ]
Bucha, V., R. E. Tylor, R. Berger and E. W. Haury, Geomagnetic intensity: Changes during the past 3000 years in the western hemisphere, Science, 168, 111–114, 1970. [ Links ]
Chauvin, A., A. Garcia, Ph. Lanos and F. Laubenheimer, 2000. Paleointensity of the geomagnetic field recovered on archaeomagnetic sites from France, Phys. Earth Planet. Int., 120, 111–136. [ Links ]
Coe, R. S., 1967. Paleo–Intensities of the Earth's Magnétic Field Determined from Tertiary and Quaternary Rocks, J. Geophys. Res., 72, No. 12, 3247–3262. [ Links ]
Coe, R. S., S. Grommé and E. A. Mankinen, 1978. Geomagnetic paleointensities from radiocarbon–dated lava flows on Hawaii and the question of the pacific nondipole low, J. Geophys. Res., 83, B4, 1740–1756. [ Links ]
Day, R., M. Fuller and V. A. Schmidt, 1977. Hysteresis Properties of Titanomagnetites: Grain–Size and Compositional Dependence, Phys. Earth Planet. Inter., 13, 206–267. [ Links ]
Dunlop, D. J. and Ö. Özdemir, 1997. Rock magnetism: Fundamentals and frontiers, Cambridge University Press, Cambridge, 573. [ Links ]
Dunlop, D. J., 2002. Theory and Applications of the Day Plot (Mra/Mr versus Hcr/Hc). Theorical Curves and Test Using Titanomagnetite Data, J. Geophys Res., 107, b3, 1029–2001. [ Links ]
Fox, J. M. W. and M. J. Aitken, 1980. Cooling rate dependence of the thermoremanent magnetization. Nature, 283, 462–463. [ Links ]
Genevey, A. and Y. Gallet, 2003. Eight thousand years of geomagnetic field intensity variations in the eastern Mediterranean, J. Geophys. Res., 108, B5, 2228, 1–18. [ Links ]
Genevey, A., Y. Gallet, C. G. Constable, M. Korte and G. Hulot, 2008. ArcheoInt: An upgraded compilation of geomagnetic field intensity data for the past ten millennia and its application to the recovery of the past dipole moment, Geochem. Geophys. Geosyst., 9, Q04038, doi:10.1029/2007GC001881. [ Links ]
Gogichaishvili, A., J. Morales and J. Urrrutia– Fucugauchi, 2001. On the use of thermomagnetic curves in paleomagnetism, C. R. Acad. Sci. Ser., IIa, 333, 699–704. [ Links ]
Gogichaishvili, A., L. M. Alva–Valdivia, J. Rosas–Elgera, J. Urrutia–Fucugauchi and J. Solé, 2004. Absolute geomagnetic paleointensity after the cretaceus normal superchron and just prior to the cretaceus–tertiary transition. J. Geophys. Res., 109, B01105. [ Links ]
Gonzalez, S., G. Sherwood, H. Bohnel and E. Schnepp, 1997. Paleosecular variation in central Mexico over the last 30 000 years: The record from lavas. Geophysical Journal International, 130, p. 201–219. [ Links ]
Kono, M., N. Ueno and Y. Onuki, 1986. Paleointensities of the geomagnetic field obtained from Pre–Inca potsherds near Cajamarca, Northern Peru, J. Geomagn. Geoelectr. 38, 1339–1348. [ Links ]
Korte, M. and C. G. Constable, 2005. Continuous geomagnetic field models for the past 7 millenia: 2. CALS7K, Geoch. Geophys. Geosyst., 6, Q02H16, doi:10.1029/2004GC000801. [ Links ]
McCabe, C., M. Jackson and B. Ellwood, 1985. Magnetic anisotropy in the Trenton limestone: results of a new technique, anisotropy of anhysteric susceptibility, Geophys. Res. Lett. 12, 333–336. [ Links ]
McClelland–Brown, E., 1984. Experiments on TRM intensity dependence on cooling rate. Geophys. Res. Lett., 11, 3, 205–208. [ Links ]
McElhinny, M. W. and W. E. Senanayake, 1982. Variations in the geomagnetic dipole 1: the past 50,000 years, J. Geomag. Geoelectr., 34, 39–51. [ Links ]
Morales, J., A. Goguitchaichvili, G. Acosta, T. González, L. Alva–Valdivia, J. Robles–Camacho and S. Hernández–Bernal, Magnetic Properties and Archeointensity determination on Pre–Columbian Pottery from Chiapas, Mesoamerica, EPS Special Issue, in press. [ Links ]
Nagata, T., K. Kobayashi and E. J. Schwarz, 1965. Archeomagnetic intensity studies of South and Central America, J. Geomagn. Geoelectr., 17, 399–405. [ Links ]
Parry, L. G., 1982. Magnetizations of immobilized particle dispersion whit tow distinct particle size, Phys. Earth Planet. Inter., 28, 230–241. [ Links ]
Schnepp, E., R. Pucher, C. Geodike, A. Manzano, U. Müller and P. Lanos, 2003. Paleomagnetic directions and thermoluminescence dating from a bread oven–floor sequence in Lübeck (Germany): A record of 450 years of geomagnetic secular variation, J. Geophys. Res., 1008, B2, 2078, doi:10.1029/2002JB001975. [ Links ]
Selkin, P. A., J. S. Gee, L. Tauxe, W. P. Meurer and A. J. Newell, 2000. The effect of remanence anisotropy on paleointensity estimates: a case study from the Archean Stillwater Complex, Earth Planet. Sci. Letters, 183, 403–416. [ Links ]
Sternberg, R. S., 1989. Archeomagnetic paleointensity in the American Southwest during the past 2000 years, Phys. Earth Planet. Inter., 56, 1–17. [ Links ]
Thellier, E. and O. Thellier, 1959. Sur l'intensité du champ magnétique terrestre dans le passé historique et géologique. Ann. Géophysique. 15, 285–376. [ Links ]
Urrutia Fucugauchi, J., 1975. Investigaciones paleomagneticas y arqueomagneticas en Mexico. Anales Inst. Geofisica, 21, 27–34. [ Links ]
Urrutia Fucugauchi, J., 1996. Palaeomagnetic study of the Xitle–Pedregal de San Angel lava flow, Southern Basin of Mexico. Physics Earth Planetary Interiors, 97, 197–196. [ Links ]
Wolfman, D., 1973. A re–evaluation of Mesoamerican chronology: AD 1–1200. PhD thesis, University of Colorado. [ Links ]
Yang, S., H. Odah, and J. Shaw, 2000. Variations in the geomagnetic dipole moment over the last 12 000 years, Geophys. J. Int., 140, 158–162. [ Links ]

