


Serviços Personalizados
Journal

Artigo
 Inglês (pdf)
 Artigo em XML
 Referências do artigo
 Enviar este artigo por email
Indicadores
 Citado por SciELO
 Links relacionados
-
 Similares em
SciELO
Similares em
SciELO
Compartilhar

 Permalink
Geofísica internacional
versão On-line ISSN 2954-436Xversão impressa ISSN 0016-7169
Geofís. Intl vol.46 no.2 Ciudad de México Abr./Jun. 2007
Submarine topography and faulting in Bahía de Banderas, Mexico
Román Alvarez
Instituto de Investigaciones en Matemáticas Aplicadas y en Sistemas (IIMAS),Universidad Nacional Autónoma de México, Ciudad Universitaria, Del. Coyoacán, 04510 Mexico City, México. Email: rab@leibniz.iimas.unam.mx
Received: March 16, 2006
Accepted: May 28, 2007
Resumen
Un modelo digital de elevación de Bahía de Banderas y su continuación costa afuera hasta la Trinchera Mesoamericana se construye con 6872 sondeos batimétricos. Se identifican dos nuevas cuencas costa afuera y también varias fallas, hasta ahora no reportadas, dentro de la bahía. El flanco sur del Cañón de Banderas es considerablemente más empinado que el flanco norte. Esta asimetría, junto con la actividad sísmica presente, lleva a proponer que el Cañón de Banderas tiene una estructura de semi–graben del tipo de crecimiento de falla, con arrastre inverso, que se origina en una cuenca de extensión en la dirección N–S. El cañón se divide en dos secciones orientadas en direcciones diferentes. La sección más antigua del cañón, orientada E–O pertenece probablemente al Mioceno Tardío y es la que corresponde al semi–graben; no obstante se presentan evidencias que sugieren que la traza de la falla podría extenderse hacia el oeste a lo largo de un tramo adicional al del semi–graben, hasta la Trinchera Mesoamericana. La sección del Cañón de Banderas orientada al NE, que continúa en el Valle de Banderas, se identifi ca como una sección más joven de la estructura. La porción antigua y la joven del cañón parecen estar activas actualmente en forma simultánea. Un grupo de fallas con rumbo NE parece estar también asociado al cambio de dirección del cañón. Estos resultados apoyan la hipótesis de que el Cañón de Banderas tiene estructura de semi–graben, y refuerzan la idea de que es el límite entre la región al norte del cañón, la que experimentó una extensión en el Mioceno, y la región al sur, la que no sufrió dicha extensión
Palabras clave: Bahía de Banderas, estructura de semi–graben, Cañón de Banderas, MDE submarino, cuenca de extensión.
Abstract
A digital elevation model of Bahía de Banderas and its offshore continuation to the Middle America Trench (MAT) is built from a data set of 6872 bathymetric soundings. Two new, offshore basins and several, previously unknown faults within the bay are also identified. The south flank of Banderas canyon is considerably steeper than the north one. This asymmetry and the seismic activity present lead to propose that Banderas Canyon has a half–graben structure of the fault growth type, and reverse drag geometry, which originates in an extensional basin oriented N–S. The canyon is divided in two sections that trend in different directions. The older section of the canyon, trending E–W, is probably Late Miocene; the associated Banderas Fault is suggested to extend westward, down to the MAT along a section that complements that of the half–graben. The section of Banderas Canyon trending NE and continuing into Banderas Valley is identified as a younger portion of the structure. The older and the younger portions of the canyon appear to be active presently. A group of faults also trending NE seem to be associated with the change in direction of the canyon. These results support the hypothesis that the structure of Banderas Canyon is a half–graben, and strengthen the idea that it is the limit between the region to the north that underwent extension in the Miocene, and the region to the south that did not experienced it.
Key words: Bahía de Banderas, half–graben structure, Banderas canyon, submarine DEM, extensional basin.
Introduction
The region from Bahía de Banderas to the Middle America Trench (MAT) contains important records of the detachment and initial separation of Baja California from mainland Mexico; however, its relief and structure are poorly known. It also contains evidence of the accretionary prism at the terminus of the subduction zone (Dañobeitia et al., 1997), and of the interaction of these tectonic processes with major turbidite pathways and depocenters. Bahía de Banderas (BB) is located on the central western portion of Mexico  (20.60 N, 105.50 W), on the Pacific coast (Figure 1); it is formed by a deep structure that up to now has been identified with a canyon. The south coastline and a shallow platform to the north of the bay flank the structure. The length of the bay in the E–W direction is of approximately 60 km, and its width in the N–S direction is 33 km. The overall geologic structure has also been associated with a graben (Johnson and Harrison, 1990; Alvarez, 2002), but no structural model was presented. To the west of the bay one finds the northernmost portion of the Middle America Trench (e.g., Fisher, 1961; Ness and Lyle, 1991) as well as the eastern limit of the Rivera plate (e.g., Lyle and Ness, 1991; Stock, 1993). The first contour representation of the bay's depths was probably that of Fisher (1961); he proposed the existence of a fault along the canyon. A second contour representation was that of the Continental Margins Study Group (Dauphine and Ness, 1991); however, they showed the depths of Bahía de Banderas decreasing monotonously in the west direction, ignoring some individual depth soundings that indicated irregular topography within the bay. In order to gather more precise data on the bay's depths, a group of seven transects was obtained onboard O/V El Puma in August 2001 (see Puma 1 in Figure 2a), which together with 92 sparse soundings obtained by R/V Argos in 1970 (SCAN11AR), reported in GEODAS (1993), and 64 individual soundings reported on navigation charts (e.g., Maptech, 1997) were used by Alvarez (2002) to build the first digital depth model of the bay integrating various depth data sets. In the present work additional soundings are incorporated including a new area, which allows for the construction of an extended model reaching to the Middle America Trench. The existence of a set of faults in the bay and its vicinity is proposed herein based on ship's transects, the modeled submarine topography, and the available epicentral distribution of seismic activity along the fault traces.
Data sets
In the preliminary digital elevation model (DEM) Alvarez (2002) was able to identify three basins and two sub–basins within Banderas canyon, showing that the bottom of the canyon has a fairly irregular topography. The basins were named, from W to E (see Figure 3): Cabo Corrientes Basin (CCB), Yelapa Basin (YB), and Majagua Basin (MB); two additional depressions of smaller dimensions were identified, which were named the Vallarta Sub–Basin (VSB) and the Marietas Sub–Basin (MSB). Towards the east end, a change in strike of the bottom of the canyon was observed, which aligns the shallowest portion of the canyon with the NE strike of Valle de Banderas.
To extend the depth model down to the Middle America Trench (MAT), three data sets are incorporated in order to make the depth soundings more dense in the study area: a) new transects from O/V El Puma obtained inside the bay and in its mouth, b) a group of ship soundings from 1970 to date, obtained from the Wessel and Smith Data Base (http://topex.ucsd.edu) and, c) a set of satellite–derived depths (Smith and Sandwell, 1997); these sets are described below.
a) Transects from O/V El Puma
A new set of bathymetric soundings was obtained on board O/V EL Puma in August 2004. The new trajectory (Figure 2a, Puma 2) was planned to complement the previous sounding data set in the bay, and extend it offshore towards the MAT, in particular the second and fourth legs (marked 2 and 4 in italics in Figure 2a) with a W–E and E–W orientation respectively, were intended to add detail to the northern flank of the canyon. The four additional legs in the zigzag pattern allowed to define some characteristics of the continental slope; that is, the transition region from the continental platform to the abyssal depths in the vicinity of the MAT. Additional data from O/V Argos was also added in the western portion and new, individual soundings were included where available. Figure 2a shows the collection of points (1785) contributed from these sources.
b) Ship's transects
The Wessel and Smith Data Base was queried to obtain data from 19° to 22° N and from 107° to 105° W. It returned 28 ship tracks that contained bathymetric data in that region in the form (lat, long, depth). The ship's tracks were analyzed individually to verify its quality and consistency. The data were further reduced to 20.2° to 21.2° N and 106.7° to 105° W to comply with the dimensions of the study area. The tracks from 15 ships were discarded since they missed the new working area, or did not contain valid data (some contained NaNs instead of valid depths). The coded names in the data base, for the ships whose data were incorporated to this study are: a0156, c1203, de015, dmm09, fd776, gam21, kk051, kk906, mrsur, sb015, u653b, we753, and yq712; their corresponding tracks are identified in Figure 2b. The number of soundings incorporated from this procedure was 3872.
c) Satellite–derived depths
Smith and Sandwell (1997) obtained satellite–derived depths; they constitute a global 2–minute (3.66 km) grid; they combined shipboard measurements with satellite observations (Sandwell and Smith, 1999) in order to create a reliable database. This independent data set shows the same trends inside the bay, with a lesser resolution, as those published by Alvarez (2002). In particular, the larger basins (Cabo Corrientes and Yelapa basins) can be clearly identified. This data set fi lls several areas that have scant soundings, or were devoid of them. The number of depth values incorporated from this data set was 1170 and are shown in Figure 2c.
The above data sets were merged yielding a total number of 6872 depth values, which were used for generating the new digital elevation model of the study area. The new data set was used to build a regularly spaced mesh between latitudes 20.2° and 21.2°, and between longitudes –106.7° and –105°, whose depth values were calculated by bicubic spline interpolation (e.g., González–Casanova and Alvarez, 1986; Campos–Enriquez et al., 1983), which is an interpolation algorithm that forces the interpolating surface to occupy the observation points, minimizing the curvature of the function. The mesh is a (lat, long) matrix of 267 x 501 elements, where the increments in latitude and longitude are of 333 m. The matrix of depth values was subsequently contoured, as shown in Figure 3, where a contour interval of 250 m is used; the modeled area almost doubles that of the previous version, reaching to the MAT.
Banderas Canyon
Banderas Canyon is clearly delimited in the contoured map of Figure 3, as well as in a portion of the continental shelf to the north, herein referred to as the shallow platform. This platform is the continuation of the land portion, showing no significant topographic transition between them, which corresponds to a submerged portion of continental land, ending to the west in a steep scarp of the continental slope that connects with the Tres Marías Escarpment (TME, Figure 1). On the vicinity of the scarp and Banderas Canyon a new basin is revealed, which will be called La Corbeteña Basin (LCB), since nearby the platform surfaces in a promontory called Roca La Corbeteña (20.7264°N, 105.8572°W). The second new basin will be called Tehuamixtle Basin (TB); this basin appears as a local depression farther offshore of the continental slope SSW of LCB; the slope represents a sharp transition from the continental platform.
The existence of topographic depressions, or enclosed basins, within and around Banderas Canyon, is of major importance for the inter–relations between tectonics and sedimentation. It is thus necessary to show that such structures are not interpolation artifacts in the DEM. In order to do so consider the three independent transects shown in Figure 4a, corresponding to the location of three portions of transects from the above data sets, which approximately follow the canyon's axis. Transects corresponding to El Puma and Argos are parallel and displaced 4 km from each other, while the Sat transect intersects them. Together they cover the deepest portions of the canyon. Figure 4b shows the depth vs longitude plots of the three transects; each one clearly indicates the existence of depressions within the canyon (CCB, YB, MB) before data interpolation, confirming that these are not interpolation artifacts.
The southern margin of the bay shows steeper slopes than those in the northern flank of the canyon; the north slope is a shallow platform that surfaces in the Marietas Islands (MI in Figure 2a), which are of low relief. The change in strike (Figure 3) of the easternmost portion of the canyon mentioned above is evident along contours of –750, –500, and–250 m, as well as the tendency to shallow in the northern region. Figure 5 is a 3–D representation of the contoured model emphasizing Banderas Canyon and the continental platform; one can appreciate the asymmetry in the flanks of Banderas Canyon. Making four N–S cross–sections a, b, c, and d, as shown in Figure 3, and plotting them as shown in Figure 6 one confirms that the south flank is considerably steeper than the north one. Profile d appears displaced to the N from the others; this occurs since this Profile cuts the NE–SW trending portion of the canyon, while the others cut across its E–W trending section. From these discussions it becomes apparent that Banderas canyon can be considerations as containing two sections with trends E–W and NE–SW respectively; they correspond to the traces of Banderas fault and Valle de Banderas fault. The canyon's south flank dipping plane ranges from 15° to 22°, while its north flank ranges from 5° to 9°. The north flank appears to be affected by strong erosional processes, with no appreciable counterpart on the south flank.
Banderas Fault
Figure 7 is similar to Figure 5, incorporating the trace of Banderas fault (BF), a set of NE trending faults, and two lines shown as A–A' and B–B' to be discussed below. As previously mentioned, the existence of Banderas Canyon has long been associated with a fault (Fisher, 1961; Ness and Lyle, 1991, Plate 8), designated Banderas Fault. It is located along the thalweg of the canyon as shown in Figure 7, and although its strike is E–W along most of the canyon, some authors have extended it outside the bay and shown it curved towards the NW without a formal justifi cation (e.g.: Ness and Lyle, 1991, Plate 8; Núñez–Cornú et al., 2002, Figure 2). Although this fault is the dominating tectonic feature in the area, no additional E–W trending faults have been reported, or found in the present study. The deep portion of the fault trending E–W terminates to the E at (20.553N, 105.419W), continuing to the NE along a fault named Valle Banderas Fault (VBF) as shown in Figures 7 and 8. Arzate et al. (2006) reported geophysical evidence of the continuation of the latter into Valle de Banderas.
Figure 8 shows the faults in Figure 7 with the superposed epicentral locations obtained by Núñez–Cornú et al. (2002), to be discussed below. A fault trending ENE is identified intersecting BF at the mouth of the bay and named the North Flank Fault (NFF, Figures 7 and 8); it is probably one of the faults responsible for the erosional processes along the northern flank of the canyon, as suggested by a series of aligned geomorphological features along the north flank, that appear to be related to submarine slumping and by the correlation with a group of epicentral locations. In the study of Arzate et al. (2006) the continuation of this fault into Valle de Banderas was not determined.
The NE trending faults
In addition to Banderas Fault few other offshore faults have been reported for this area. One such fault, reported by Fenby and Gastil (1991, Plate 10), is worth mentioning; it trends SW–NE crossing the NE corner of the bay; herein it will be referred to as Cabo Corrientes–Bucerías–El Colomo Fault (CCBCF) and its trace is shown in Figures 7 and 8. They extend the fault offshore reaching to the vicinity of Roca Corbeteña; in the opposite direction they extend the fault inland, up to El Colomo village, where it forms the western flank of Banderas Valley, with its downthrown block to the SE. They map the valley and the shallow platform within the bay as marine sediments with an age between 0–5 Ma, and map another, parallel fault about 1 km NW of the previous fault, with its downthrown block also to the SE, which may correspond to Las Coronas Fault (Núñez–Cornú et al., 2000), where hydrothermal activity has been found at one location in the bay.
Ferrari et al. (1994, Figure 2) have also presented some faults in the area, however, they restrict themselves to the inland area, mapping Valle de Banderas as Quaternary alluvial and coastal deposits; regarding the inland representation of the CCBCF they differ slightly from the above, showing a bend in the fault towards the W, at its southern end. In any event, they do not continue the fault into the bay. The study of Prol–Ledezma et al. (2003, Figure 5) marginally shows the portion of CCBCF fault, trending N47E, which meets the shoreline and aligns with Valle de Banderas graben (N40E strike). However, they found that in the vicinity of Punta Mita, that is, the northwestern portion of land enclosing the bay, the main fault system has a N25E strike, coinciding with the strike of faults MPMF and CF (Figure 8) proposed herein. They concluded that this fault and fracture system controls the morphostructural features in their study area, and probably controls the deep circulation of the thermal fluids appearing slightly offshore in such an area.
Fault CCBC is of importance since several authors have defined it independently, and since it differs in orientation from Banderas Fault. In order to verify the offshore existence of CCBCF, I looked at the intersections of the fault's trace (Figure 8) and El Puma transects (Figure 2a); additional depth soundings performed on smaller vessels on the northern platform, along the trace of CCBCF, indicate that an average step of 8 m is present when crossing the fault from NW to SE and vice versa, with the downthrown block to the SE. Figure 9 is a plot of the O/V El Puma soundings along Legs 2 and 4 vs longitude, showing such a step along Leg 2; along Leg 4, which corresponds to a deeper section of the canyon, there is a cut of 200 m in the location where the soundings intersect the fault. In this region the fast topographic variations suggest that erosional processes are active, as previously mentioned; along Leg 2 these processes appear to be active in two regions, with the rest of the platform slightly perturbed. The continuation of CCBCF from the NW flank of Valle de Banderas into the bay, as proposed by Fenby and Gastil (1991), is thus confirmed by these results; however, the seismological results of Núñez–Cornú et al. (2002) suggest that the fault extends farther down beyond Cabo Corrientes (Figure 8), which differs from the trace proposed by the former authors for the SW portion of the fault, close to Roca Corbeteña. One can easily correlate the region between MPMF and CCBCF (Figure 9) as that corresponding to the Marietas Sub–Basin (MSB, Figure 3). Faults CF, MPMF and VBF are herein traced offshore in a similar way, and are also indicated in Figures 7 and 8; they are sub parallel to CCBCF.
Valle de Banderas Fault (VBF) trends NE and appears to start within the bay at the intersection with BF; VBF enters Banderas Valley parallel to its axis, thus the name is derived from that of the valley. Parallel to VBF is Cucharitas–Pitillal Fault (CPF), which extends beyond Bahía de Banderas to a location called Cucharitas Rocks on the shoreline, south of Cabo Corrientes. At Pitillal town, close to Puerto Vallarta, this fault has a distinct topographic expression. VBF and CPF flank the portion of the canyon trending NE. Two additional faults are inferred NW of CCBCF; one runs from Tres Marietas Islands to Punta Mita and along the Nayarit coast, the Marietas–Punta Mita Fault (MPMF), and the second one is La Corbeteña Fault (CF) which runs into La Corbeteña Basin and, comparatively, shows scarce seismic activity; their strike is NNE. An additional fault is incorporated into this NE trending pattern called the Picacho–Aguacatera Fault (PAF), which was originally inferred from the location of the corresponding epicenters, and subsequently observed in the topographic maps (1:50,000) of the inland portion. In conclusion this fault system trends NE in the average, and prevails in the study area involving portions of land and portions of the bay. Recent geophysical studies in Valle de Banderas (Arzate et al., 2006) confirm that faults CCBCF,VBF, and CPF continue into the valley.
Faults and epicentral locations
Núñez–Cornú et al. (2002) reported 93 epicentral locations within, and in the vicinity of Bahía de Banderas in a study that gathered seismic events in a two–year period, from 1996 to 1998; however, they did not attempt to correlate the seismic activity with faults in the bay or elsewhere. The magnitude of such events ranged from 1 to 5 in the Richter scale, while their hypocentral locations ranged from close to the surface down to 35 km. In the present representation the epicentral locations are shown without distinguishing among the magnitudes. Figure 8 shows the correlation between the faults shown in Figure 7 and the epicenters reported by the above authors. The epicenters corresponding to BF and NFF are shown as squares and triangles respectively. Notice that two epicenters aligned with BF (squares) occurred in the vicinity of the MAT: one over Banderas Mount (see also Figure 20) and the other west of the MAT, with magnitudes of 3 and 5 respectively. In addition Banderas Mount is crossed by a fault that appears to be the continuation of the trace of BF in the bay area, as previously mentioned. Based on these evidences I suggest that BF may extend down to the MAT. The epicentral locations corresponding to the NE trending faults are shown as circles. 77 out of 93 epicentral locations reported for this area align with the faults depicted in Figure 7. This confirms that Bahía de Banderas and its vicinity is presently a fairly active tectonic setting; particularly the deepest sections of the canyon are flanked by active faults. This interpretation of BF as a fairly straight, E–W trending fault possibly reaching down to the MAT, differs from the versions reported above that show its portion outside the bay curved toward the NW.
Half–graben model
Alvarez (2002) formerly speculated that the canyon structure corresponded to a graben, continuing the trend of the branching grabens oriented NE that, according to Johnson and Harrison (1990), run from the Tepic–Zacoalco graben to Valle de Banderas graben; at that time the information on the fault system within the bay, presented in this work, was not available. For its development a graben requires of two sub parallel faults that limit the structure, producing symmetrical cross–sections with respect to the graben's axis; in Bahía de Banderas one finds no counterpart of Banderas fault in order to delimit the graben. In addition, several cross–sections of the canyon (Figure 6) confirm the asymmetry between its north and south flanks. This asymmetry between the slopes first suggested to the author that the canyon's structure rather corresponded to a half–graben. In this section a model is presented and tested for Banderas Canyon, based on previous developments for half–graben structures.
Schlische (1991) described the three possible end–member models of half–graben development: detachment fault, domino–style, and fault growth. In the latter model subsidence is associated with seismic activity and basins grow wider through time, as the basin–flanking faults lengthen; additionally, the displacement on the normal fault flanking the structure is generally greatest at or near the center of the fault (e.g., Walsh and Watterson, 1987,1988,1989) and decreases to zero at its ends. This is the model that seems to best fit the characteristics of Banderas canyon, as will be discussed below. Figure 10 shows the location of several transects in the image of the DEM of Bahía de Banderas identified as Profile 1 (BF), Profile 2, and lines 1W, 1E, 2E, 3E, and Baseline that intersect Banderas canyon at various places. The topographic Profiles along those lines will be used in the construction of the half–graben model.
Figure 11 shows the schematics of the fault growth half–graben model, where normal and reverse–drag geometries for the hanging wall are exemplified. Reches and Eidelman (1995) describe normal–drag as the process that produces bent lines convex toward the direction of the fault motion, and reverse–drag when the bent lines are concave toward the direction of the fault motion.
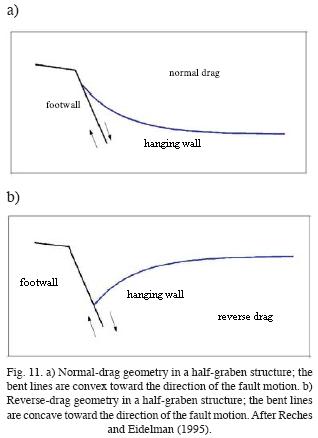
In the case of Banderas canyon the footwall corresponds to the south flank and the hanging wall corresponds to the north flank, including the shallow platform to the north of the bay. The geometry of the region where the hanging wall meets the footwall suggests that the basin corresponds to a reverse–drag process. The deepest portion of Bahía de Banderas was formerly described as a basin within the bay (Alvarez, 2002), and named Yelapa basin (YB, Figure 3); an average depth of 1600 m can be assigned to it. In the fault growth model the deepest portion of the footwall–hanging wall contact is located at or near the mid of the length of the footwall. In this work the seismic activity in the area, an essential part of the model, has been already associated with faulting.
Schlische (1991) calculated several half–graben models of the fault growth type using the equations below.
A universal scaling law
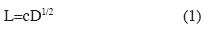
where L is the length of the fault, D is the maximum fault displacement, and c is some constant of proportionality, primarily depending on rock properties. Gibson et al. (1989) derived the along–strike dimension of the basin, which is the length of the fault L as

where D is the maximum displacement at the center of the fault, S is the increment by which slip increases after each slip event, required for the fault to grow, G is the shear modulus, and  is the stress drop after each seismic event. D given by

where n is the nth slip event. The total time of active faulting and the average repeat time between slip events yield the total number of slip events. Gibson et al. (1989) also obtained the displacement d at any point on the fault surface as

where R=L/2 is the radius of the fault and r is the distance on the fault from the center of the fault. This equation shows the characteristic of the half–graben model of maximum displacement D at the center (r=0) and zero displacement at the ends of the fault (r=R).
For non–vertical synsedimentary faults Schlische (1991) observed that there is an asymmetry between footwall and hanging wall displacement of horizons, with the asymmetry increasing as the fault dip (φ) decreases; the percent contribution of hanging wall displacement (HW) is given by

The expression for calculating the displacement d' normal to the fault surface is given by Gibson et al. (1989) as

where r' is the distance from the fault measured normal to the fault, and R' is the roll–over radius given by
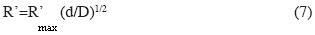
Where R'max is the maximum roll–over radius, taken by Gibson et al. (1989) to be equal to the mean of the major and minor radii of the fault surface ellipse. The ratio of the major to minor radii of the ellipse typically ranges from 1.25 to 3 according to the above authors.
Schlische (1991) was concerned with modeling the filling of extensional continental basins with sediments. In the case of Bahía de Banderas extension probably started when the sea was not invading the bay, and could be considered a continental process. However, since the extensional process occurred in a region neighboring the ocean, eventually the ocean invaded the extending tectonic structure, filling it with seawater and sediments, thus forming the bay's first stages of development. The extensional process should not be affected whether the filling material is water, sediments, or a mix of both; if this is correct then the half–graben of Bahía de Banderas can be modeled with the above equations and the parameters obtained above for the length of the fault (63 km) and the depth of its central portion, to be determined below.
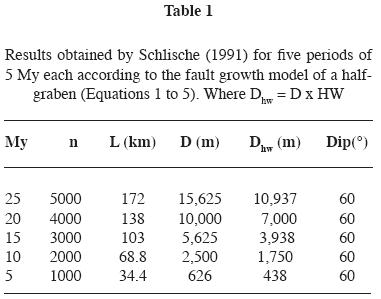
Schlische (1991) obtained as an example the values for the length of the fault L, the displacement D, and the displacement of the hanging wall Dhw , at 5 My intervals for a dip of the footwall of 60°, as shown in Table 1, where n represents the number of slip events for each time span (25, 20, 15, 10 and 5 My). The increment by which slip increases from one seismic event to another is calculated with Equation (3) as S=1.25 x 10⁻³ m. L is obtained from Equation (2), and Dhw is calculated with Equations (3) and (5). He assumed a duration of active faulting of T=25 My, final maximum displacement of D=15,625 m, with repeat time of slip events of 5000 years, and average values for shear modulus G=3.0 x 10¹⁰ Pa and stress drop =3.0 x 10⁶ Pa which are the average values suggested by Walsh and Watterson (1987), and Gibson et al. (1989).
In order to apply the model to Bahía de Banderas a set of parameters must be obtained, which should reproduce the topography of the hanging wall at various cross–sections. However, since the topography along the trace of the fault is quite irregular, the question arises of whether the Baseline (Figure 10) is actually located at the point of maximum displacement of the proposed half–graben. If this were not the case, substantial differences with the calculated model would be expected. It is therefore necessary to justify that the Baseline is located at, or near, the region of maximum displacement on the fault. Figure 12 shows the topographic Profiles (Profile 1 and Profile 2) corresponding to those in Figure 10. Fit 1 and Fit 2 represent quadratic fits to Profile 1 and Profile 2, respectively. Profile 1 corresponds to the topographic Profile along Banderas fault (BF in Figure 10) and Profile 2 was obtained for comparison purposes, to evaluate how much a nearby Profile departed from that of the fault. The curve labeled d was obtained from Equation (4) with the parameters to be discussed below, and represents the theoretical contact between the footwall and the hanging wall for Banderas fault. The curve reaches maximum depth at the middle of the fault and approaches zero depth at its ends. Below the contact between the hanging wall and the footwall, one expects rock material, probably the granites that characterize the region; between the contact line and Profile 1 there are slumped materials and sediments, and above it the ocean floods the region. Both topographic Profiles can be adjusted to quadratic expressions; Fit 1 and Fit 2 are the resulting fits using expression

the values of the corresponding coeffi cients are given in Table 2.
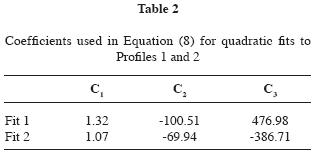
The quadratic fit to the topographic Profile of Banderas fault (Fit 1) shows a minimum within 2 km of the location of the Baseline. Depths tend to zero at distances slightly larger than those predicted by curve d. Small circles on the Profile show the location of the places where Profiles 1W, 1E, 2E, 3E, and the Baseline intersect it. The minimum value for Fit 2 is slightly offset (7 km) to the east of the minimum of Fit 1; on its eastern half it shows a good match with the corresponding portion of Fit 1, which is expected since both Profiles converge to the same point. On the shorter, western portion of both Profiles the mismatch is larger. Based on these observations I conclude that the mid–point of Banderas fault lies nearby the one proposed in here (i.e., at the Baseline).
Profile 1 of Figure 12 corresponds to Banderas fault; as one moves toward the E the depth shallows reaching 1000 m at approximately 4.5 km from the coastline; thus, the transition from 1000 m depth to the surface occurs rapidly. I take this region as the limit of the footwall, which yields a half–length of 31.5 km. Projecting this distance in the opposite direction (W), from the Baseline, it is observed that along this half–length the depth shallows and deepens, fi nally rising to depths of 1000 m in two promontories which are aligned with the footwall (see Figure 10). I will consider tentatively that the promontories represent the shallower portion of the western half–length of the fault; this topography may be the result of additional erosional processes occurring at the border of the continental slope. Thus it appears that the eastern half–length of the footwall is better defined, whereas the western half–length shows a more controversial geometry. The length L of the fault, defined this way, is 63 km.
The actual topographic Profiles of the five lines will be now compared individually to the results calculated from the model with the following parameters: Φ=20°, which is representative of the dip of the fault plane, r in Equation (4) is the intersection distance measured from the Baseline (rr in Figures 13–17, 13, 14, 15, 16 and 17), and the maximum displacement D=2800 m is determined from the depth at which the footwall and the hanging wall converge along the Baseline (Figure 13); sediments and slumped materials fill the section between –1600 m (Yelapa basin) and –2800 m. The ratio of the major to the minor radii of the ellipse is set equal to 2. Figure 13 corresponds to the cross–section showing the Baseline topography, the footwall plane (straight, dashed line), and the Profile for the hanging wall calculated with Equation (6), which fits the topographic Profile of the hanging wall fairly well. The dashed curve d represents the theoretical depth limit of the contact between the footwall and the hanging wall along the half–length of the fault, calculated with Equation (4); it is included for reference.
Next, Profile 1E is calculated using the same parameters and equations; the results are shown in Figure 14. Slumping likely produces the irregular geometry of the Profile at the bottom of the hanging wall. Notice that the footwall and the hanging wall meet at the depth predicted by Equation (4) at 13 km from the center of the fault (dashed curve). An equivalent calculation is performed for Profile 1W (Figure 15) in the western half of the fault, which appears to be less well preserved. The dip of the fault is 17° in this region and there is thus a discrepancy with the 20° dip shown by the dashed line. Convergence of the footwall and the hanging wall occurs below the theoretical prediction (dashed curve) at 20°, but gets much closer to the prediction using the actual dip of 17°. It is worth mentioning that if this variation in the dip of the fault plane is introduced in the corresponding equations it induces only a minor change in the theoretical Profile. The shallow portion of the hanging wall remains below sea level at all points. On this Profile the agreement is considered satisfactory in spite of the differences shown between the theoretical and the actual Profiles. No attempt is made at comparing topographic and theoretical Profiles to the west of this one, owing to the erosional alterations in the area.
Profile 2E is located 20 km east of the Baseline; it is shown in Figure 16 together with the model results calculated as before. The hanging wall theoretical Profile agrees well with the actual topographic Profile of the upper portion; however the topographic Profile is wider and deeper than the theoretical prediction. As will be seen below with Profile 3E, this effect increases as we approach the east end of the fault. Figure 17 shows Profile 3E at 25 km distance from the Baseline, and only 6.5 km from the assumed end of the fault where displacement should be zero. The widening effect is more pronounced and the observed depth is much greater than the theoretical prediction. One must bear in mind that this is the region in which Banderas canyon changes direction, following a fault that was named Valle de Banderas fault (see Figure 8). Thus, it seems that at least two faults are affecting this region, widening the cross–sections along it. Various examples of how erosion modifies the walls of a half–graben have been documented (e.g., Hamblin, 1965).
I conclude that the model describes well the central portion of the half–graben, within ±14 km of the central point. As one gets closer to the assumed fault ends one gets poorer results. Complications apparently arise from the effects of additional faults eroding those locations and modifying the theoretical predictions. Thus, the agreement between topographic Profiles and theoretical calculations in the central portion of the fault strengthen the hypothesis that Banderas canyon is actually a half–graben.
The age of Banderas half–graben can be estimated by obtaining parameter n from Equation (3), assuming S=1.25 x 10⁻³ m, which is the value used by Schlische (1991), and the maximum displacement at the center of the fault D=2800 m that fits the observations as explained above. The resulting value of n is 2120, which under the assumption of one slip event every 5000 years yields an age of 10.6 My. Calculating the errors in determining D and L, I obtain variations of ± 0.5 My; thus the age of the half–graben is estimated at 10.6 ± 0.5 Ma with these parameters. However, higher or lower slip rates will modify the above age; for instance, if the assumption of one slip event every 5000 years is changed to one event every 3000 (or 7000) years, one gets ages of 6.36 (or 14.8) Ma respectively. The actual slip rate will have to be determined independently in order to get an accurate age for Banderas half–graben using this procedure. The age proposed for Bahía de Banderas by Arzate et al. (2006) of ~14 Ma favors rates in the vicinity of 6600 years per slip event.
Cross–sectional models
Two cross–sections are presented in Figure 18: one runs along line A–A' and the other along line B–B'; their locations are shown in Figure 7. Their interpretation is based on the topographic expression along the lines, and their intersections with the observed faults. Since Banderas Canyon is emplaced within the Puerto Vallarta batholith (e.g., Schaaf et al., 1995), it is likely that the general composition of the basement is granitic; however, andesite–rhyolite flows of 5–13 Ma outcrop at the intersection of the A–A' cross–section and MPMF, as mapped by Fenby and Gastil (1991). Since a geological study of the bay is lacking, these observations will have to be revised when one is available. In Figure 18a the cross–section shows that faults NFF and CCBCF developed on the north flank of the canyon. It has been observed that this type of fault is not uncommon in half–graben hanging walls (e.g., Sheth, 1998); when the footwall corresponds to a major listric fault they are classified as antithetic faults. To the NW of this portion, a block flanked by MPMF and CCBCF represents the shallow platform of the northern part of the bay; the geometry of the section agrees with an extensional process originating in crustal thinning (e.g., Barr, 1987). Figure 18b supports this interpretation, noting that the Punta Mita block, flanked by MPMF and CCBCF is raised with respect to the neighboring blocks and represents the end portion of the half–graben, followed to the north by blocks of increasing depths. The NE continuation of Banderas Canyon, is in turn flanked by VBF and CPF.
Banderas Mount
A structure located at 20.5°N and –106.3°W is aligned with Banderas Canyon; it protrudes 600 m from the slope located west of the canyon (Figure 3). It will be called Banderas Mount (BM); this structure originally appeared in the map of Fisher (1961), although in lesser detail. The structure is surrounded to the W, N, and S by the ending portion of the MAT, and rises sharply (1600 m) from the trench. Figure 19 shows two ship transects (Argos, Figure 2a) and (kk051, Figure 2b) across a portion of this structure, which delineate its topographic Profile in the E–W direction; the depth Profiles in these two independent transects are quite similar, confirming that the structure has the characteristics shown. Figure 20 shows a close–up, 3–D model of Banderas Mount generated from a section enclosing it, of the merged data set previously described. The view is from the SW; it evokes a conical structure capped by a complex topography. The trace shown corresponds to the apparent continuation of Banderas Fault (see Figures 7 and 8), traversing BM and suggesting that the fault may be possibly traced to the MAT.
Age of Banderas Canyon
Reconstructing the plate boundaries from the Present to 20 Ma, Larson (1972, Figure 15) showed the Molokai fracture zone at 20 Ma aligned with Bahía de Banderas, forming part of the Pacific–Farallón plate boundary at the time. At present the Molokai fracture zone lays at the latitude of mid–Baja California, indicating that it has been transported northwesterly, while Bahía de Banderas remained attached to the NAM plate. Regarding the separation of Baja California from mainland Mexico, Karig and Jensky (1972, Figure 2b) proposed the formation of a proto–Gulf by an E–W extensional zone of 100–150 km whose southern limit at 10 Ma was along a line that included Bahía de Banderas. Stock and Hodges (1989) studied the Late Miocene circumgulf extension, linking it to the southern Basin and Range extensional province. Furthermore, they suggested that the southern limit of the Gulf Extensional Province on mainland Mexico ends at a line that extends W–E from Bahía de Banderas to the intersection with the Mexican Volcanic Belt. Lonsdale (1991, Figure 10f) also placed a transform fault as the active–abandoned trench limit at 12 Ma linking the ridge to the Tosco–Abreojos fault suggesting that it was the limit of the basin and range extension. In their model of the opening of the Gulf of California, Lyle and Ness (1991, Figure 9) suggested the existence of Bahía de Banderas at 14 Ma, and associated it with slow rifting in the NW–SE direction.
As pointed out above, Arzate et al. (2006) assigned an age of 14 Ma to Bahía de Banderas. From the half–graben model, I derived an age of 10.6 ± 0.5 Ma for the initiation of extension in the area; however, this fi gure resulted from the assumption of one slip event every 5000 years. If the rate varies, the age will vary accordingly. These interpretations suggest that the age of Banderas Canyon is probably mid–Miocene, making it contemporaneous with the formation of the Magdalena Fan (Yeats and Haq, 1981).
Faults CPF and VBF actually define a graben structure in the section of Banderas Canyon that constitutes its continuation towards the ENE, postdating the half–graben structure along Banderas fault. The sediments of the valley and its continuation into the eastern portion of the bay have been assigned an age younger than 5 Ma (Fenby and Gastil, 1991; Ferrari et al., 1994; Ferrari and Rosas–Elguera, 2000). Lonsdale (1991, Figure 10h) proposed that at 5 Ma a new strike slip fault developed along the proto–Gulf that linked to the San Gabriel fault zone in southern California. This new fault shared slip with the Tosco–Abreojos fault for some time, until motion ceased along the latter and slip was completely transferred to the new Gulf of California fault system. Thus, the reorientation of the canyon axis was probably associated with the start of the NW motion of Baja California, after the extensional episode and Proto–Gulf opening took place. From the seismic data reported above one may conclude that both faulting directions are presently active.
Conclusions
The continuity of Banderas Fault can be established from close to Puerto Vallarta to the vicinity of the MAT. A change in strike of approximately 30° had been noted by Alvarez (2002) between the Banderas Canyon and Valle de Banderas, the inland valley that constitutes the continuation of the bay. It can now be established that such a change starts within the bay, towards its eastern end and continues inland into Valle de Banderas in the form of a graben with a reoriented axis; this change in orientation probably took place in the last 5 Ma, involving the more eastern portion of the bay, as well as a portion of land which is now Valle de Banderas, where active tectonism is also present. The major tectonic event in this area at this period of time was the initiation of the drifting of Baja California in the NW direction. It is thus plausible that the change in orientation of the canyon occurred linked to it. More precise dating of the origin of Valle de Banderas and the shallow marine platform are required. The processes of sediment deposition and/or removal from the canyon are yet to be identified.
Banderas Fault apparently extends in the E–W direction from inside the bay, near Puerto Vallarta, to the intersection with the ending portion of the Middle America Trench, crossing the intriguing structure of Banderas Mount.
Banderas Canyon constitutes a limiting structure between the region that experienced extension to the north and the undisturbed region to the south; it is shown that the structure of the canyon corresponds to a half–graben. Regarding the continental platform there is a drastic change in width between the region to the north and the region to the south of it. Additionally, Núñez–Cornú et al. (2002) noted that there is considerable seismic activity within the bay and south of it, and almost no activity to the north. These observations are in agreement with the assumption that Banderas Canyon is the limit between the region that underwent extension in North America eventually giving rise to the detachment of Baja California, and the region south of it, which apparently did not undergo extension. The half–graben structure is the result of a tectonic extension, supporting the concept of lithospheric extension in the area.
Acknowledgments
I thank A. Bernal for figures preparation. The continuing support of Drs. E. Magaña and I. Emilsson is greatly appreciated. The crew of O/V El Puma provided technical and material support in both cruises; my sincere thanks to all of them. Partially supported by UNAM–PAPIIT Project IX121704.
Bibliography
ALLAN, J. F., 1986. Geology of the northern Colima and Zacoalco grabens, southwest Mexico: Late Cenozoic rifting in the Mexican Volcanic Belt. Geol. Soc. Am. Bull., 97, 473–485. [ Links ]
ALVAREZ, R., 2002. Banderas Rift Zone: A plausible NW limit of the Jalisco Block. Geophys. Res. Lett., 29 (20), 1994, DOI:10.1029/2002GL016089. [ Links ]
ARZATE, J. A., R. ALVAREZ, V. YUTSIS, J. PACHECO and H. LÓPEZ–LOERA, 2005. Geophysical modeling of Valle de Banderas graben and its structural relation to Bahía de Banderas, Mexico. Revista Mexicana de Ciencias Geológicas, 23, num. 2, 184–198. [ Links ]
BARR, D., 1987. Structural/ stratigraphic models for extensional basins of half–graben type. J. Structural Geol. 9, 491–500. [ Links ]
BOURGOIS, J., V. RENARD, J. AUBOUIN, W. BANDY, E. BARRIER, T. CALMUS, J–C. CARFANTAN, J. GUERRERO, J. MAMMERICKX, B. MERCIER DE LEPINAY, F. MICHAUD and M. SOSSON, 1988. Active fragmentation of the North American plate: offshore boundary of the Jalisco block off Manzanillo. Comptes Rendues, Acad. Sci. Paris, t. 307, Serie II, 1121–1130. [ Links ]
CAMPOS–ENRIQUEZ, J. O., J. THOMANN and J. GOUPILLOT, 1983. Applications of two–dimensional spline functions to geophysics. Geophysics, 48, 9, 1269–1273. [ Links ]
COUCH, R. W., G. E. NESS, O. SÁNCHEZ–ZAMORA, G. CALDERÓN–RIVEROLL, P. DOGUIN, T. PLOWMAN, S. COPERUDE, B. HUEHN and W. GUMMA, 1991. Gravity anomalies and crustal structure of the Gulf and peninsular province of the Californias. In: The Gulf and Peninsular Province of the Californias, edited by J.P. Dauphin and B .R.T. Simoneit, 25–45, AAPG, Memoir 47. [ Links ]
DAÑOBEITIA, J. J., D. CÓRDOBA, L. A. DELGADO–ARGOTE, F. MICHAUD, R. BARTOLOMÉ, M. FARRAN, R. CARBONELL, F. NÚÑEZ–CORNÚ and the CORTES–P96 WORKING GROUP, 1997. Expedition gathers new data on crust beneath Mexican west coast. EOS, Transactions AGU, 78, 49, 565–572. [ Links ]
DAUPHIN, J. P. and G. E. NESS, 1991. Bathymetry of the Gulf and Peninsular province of the Californias. In: The Gulf and Peninsular Province of the Californias. J. P. Dauphin and B. R. T. Simoneit, editors, 21–24, Plates 1–2, AAPG, Memoir 47. [ Links ]
FERRARI, L., E. PASQUARÉ, S. VENEGAS, D. CASTILLO and F. ROMERO, 1994. Regional tectonics of western Mexico and its implications for the northern boundary of the Jalisco block. Geofísica Internacional, 33, 139–151. [ Links ]
FERRARI, L. and J. ROSAS–ELGUERA, 2000. Late Miocene to Quaternary extension at the northern boundary of the Jalisco block, western Mexico: The Tepic–Zacoalco rift revisited. In: Delgado–Granados, H., Aguirre–Díaz, G. and Stock, J.M., eds., Cenozoic Tectonics and Volcanism of Mexico. 41–63. Boulder, Colorado. Geological Soc. Am. Special Paper 334. [ Links ]
FENBY, S. and G. GASTIL, 1991. Geologic–Tectonic map of the Gulf of California and surrounding areas. In: The Gulf and Peninsular Province of the Californias, edited by J. P. Dauphin and B.R.T. Simoneit, 79–83, AAPG, Memoir 47. [ Links ]
FISHER, R. L., 1961. Middle America Trench: topography, and structure. Geol. Soc. Am. Bull. 72, 703–720. [ Links ]
GEODAS, 1993. GEODAS CD–ROM data set. Marine Geophysical Data. SCAN11AR. National Geophysical Data Center, Boulder, Colorado. [ Links ]
GIBSON, J. R., J. J. WALSH and J. WATTERSON, 1989. Modelling of bed contours and cross–sections adjacent to planar normal faults. J. Struct. Geol. 11, 317–328. [ Links ]
GONZÁLEZ CASANOVA, P. and R. ALVAREZ, 1985. Splines in geophysics, Geophysics, 50, 2831–2848. [ Links ]
HAMBLIN, W. K., 1965. Origin of "reverse–drag" on the downthrown side of normal faults. Geol. Soc. Am. Bulletin, 76, 1145–1164. [ Links ]
JOHNSON, C. A. and C. G. A. HARRISON, 1990. Neotectonics in central Mexico. Phys. Earth Planet. Int., 64, 187–210. [ Links ]
KARIG, D. and W. JENSKY, 1972. The Proto–Gulf of California. Earth Planet. Sci. Lett., 17, 169–174. [ Links ]
LARSON, R. L., 1972. Bathymetry, magnetic anomalies, and plate tectonic history of the mouth of the Gulf of California. Geol. Soc. Am. Bull., 83, 3345–3360. [ Links ]
LONSDALE, P., 1991. Structural patterns of the Pacific floor offshore of peninsular California. In: The Gulf and Peninsular Province of the Californias, edited by J. P. Dauphin and B.R.T. Simoneit, 87–125, AAPG, Memoir 47. [ Links ]
LUHR, J. F., S. A. NELSON J. F. ALLAN and I. S. E. CARMICHAEL, 1985. Active rifting in southwest Mexico: Manifestations of an incipient eastward spreading ridge jump. Geology, 13, 54–57. [ Links ]
LYLE, M. and G. E. NESS, 1991. The opening of the southern Gulf of California. In: The Gulf and Peninsular Province of the Californias, edited by J.P. Dauphin and B.R.T. Simoneit, 403–423, AAPG, Memoir 47. [ Links ]
MAPTECH, 1997. ChartPack 16, Acapulco, Mexico to San Diego, CA, Defense Mapping Agency Electronic Charts, Resolution Mapping Inc., Andover, MA. [ Links ]
NESS, G. E. and M. W. LYLE, 1991. A seismo–tectonic map of the gulf and peninsular province of the Californias. In: The Gulf and Peninsular Province of the Californias, edited by J.P. Dauphin and B.R.T. Simoneit, 71–78, AAPG, Memoir 47. [ Links ]
NÚÑEZ–CORNÚ, F. J., R. M. PROL–LEDESMA, A. CUPUL–MAGAÑA and C. SUÁREZ–PLASCENCIA, 2000. Near shore submarine hydrothermal activity in Bahía de Banderas, western Mexico. Geofísica Internacional, 39, 2, 171–178. [ Links ]
NÚÑEZ–CORNÚ, F. J., M. RUTZ L., F. A. NAVA P., G. REYES–DÁVILA and C. SUÁREZ–PLASCENCIA, 2002. Characteristics of seismicity in the coast and north of Jalisco block, Mexico. Phys. Earth Planet. Int., 132, 141–155. [ Links ]
PROL–LEDEZMA, R. M., C. CANET, G. TOLSON, A. GARCÍA–PALOMO, R. MILLAR, M. A. RUBIO, R. TORRES DE LEÓN and J.S. HUICOCHEA–ALEJO, 2003. Basaltic volcanism and submarine hydrothermal activity in Punta Mita, Nayarit, Mexico. In: Geologic transects across Cordilleran Mexico, Guidebook for the fi eld trips of the 99th Geological Society of America Cordilleran Section Annual Meeting, Puerto Vallarta, Jalisco, Mexico. March 30–31, 2003. México, D.F., Universidad Nacional Autónoma de México, Instituto de Geología, Publicación Especial 1, Field trip 7, p. 169–182. [ Links ]
RECHES, Z. and A. EIDELMAN, 1995. Drag along faults. Tectonophysics, 247, 145–156. [ Links ]
SANDWELL, D. T. and W. H–F. SMITH, 1999. Bathymetric Estimation. In: Satellite Altimetry and Earth Sciences: A Handbook of Techniques and Applications, L. L. Fu and A. Cazenave, editors, 441–458. Elsevier, Amsterdam. [ Links ]
SCHAAF, P., D. MORÁN–ZENTENO, M. S. HERNÁNDEZ–BERNAL, G. SOLÍS–PICHARDO, G. TOLSON and H. KÖHLER, 1995. Paleogene continental margin truncation in southwestern Mexico: Geochronological evidence. Tectonics, 14, 1339–1350. [ Links ]
SCHLISCHE, R.W., 1991. Half–graben basin filling models: New constraints on continental extensional basin development. Basin Research, 3, 123–141. [ Links ]
SHETH, H. C., 1998. A reappraisal of coastal Panvel flexure, Deccan Traps, as a listric–fault–controlled reverse drag structure. Tectonophysics, 294, 143–149. [ Links ]
SMITH, W. H. F. and D. T. SANDWELL, 1997. Global seafloor topography from satellite altimetry and ship depth soundings, Science, 277, 1957–1962, 26 Sept. [ Links ]
STOCK, J. M., 1993. Tectónica de placas y evolución del Bloque Jalisco, México, GEOS, Bol. U. Geofís. Mex. 13 (3), 3–9. [ Links ]
STOCK, J. M. and K. V. HODGES, 1989. Pre–Pliocene extension around the Gulf of California and the transfer of Baja California to the Pacific plate. Tectonics, 8, 99–115. [ Links ]
WALSH, J. J. and J. WATERSON, 1987. Distribution of cumulative displacement and of seismic slip on a single normal fault surface. J. Struct. Geol. 9, 1039–1046. [ Links ]
WALSH, J. J. and J. WATERSON, 1988. Analysis of the relationship between displacements and dimensions of faults. J. Struct. Geol. 10, 239–247. [ Links ]
WALSH, J. J. and J. WATERSON, 1989. Displacement gradients on fault surfaces. J. Struct. Geol. 11, 307–316. [ Links ]
YEATS, R. S. and B. U. HAQ, 1981. Deep–sea drilling off the Californias: Implications of leg 63. In: R.S. Yeats and B.U. Haq, et al., Eds., Initial Reports of the Deep Sea Drilling Project, Volume 63. Washington, D.C., U.S. Printing Office, p. 949–963. [ Links ]

