


Servicios Personalizados
Revista
Articulo
 Inglés (pdf)
 Artículo en XML
 Referencias del artículo
 Enviar artículo por email
Indicadores
-
 Citado por SciELO
 -
 Accesos
Links relacionados
-
 Similares en
SciELO
Similares en
SciELO
Compartir

 Permalink
Geofísica internacional
versión On-line ISSN 2954-436Xversión impresa ISSN 0016-7169
Geofís. Intl vol.45 no.2 Ciudad de México abr./jun. 2006
Crustal thickness beneath Rio de Janeiro, Brazil, from spectra of SH waves at station RDJ
Felipe Dias Cario and Jorge Luis de Souza*
MCT – Observatório Nacional, R: Gal. José Cristino, 77 – São Cristóvão, 20921–400 Rio de Janeiro, Brazil *Author for correspondence: jorge@on.br
Received: November 13, 2005
Accepted: April 4, 2006
Resumen
Se analizaron espectros de amplitud y de fase para ondas S para estimar el espesor de la corteza bajo la estación sísmica de Río de Janeiro. El resultado estimado es de 32.9 ± 2.6 km, que es consistente con una zona de transición intraplaca de océano a continente. Las fuentes sísmicas someras a distancias de 83 a 88 grados proporcionan óptimos resultados.
Palabras clave: Ondas SH, espectros de amplitud y de fase, espesor de la corteza, Río de Janeiro, velocidad de S, Brasil.
Abstract
Amplitude and phase spectra of long period analog S wave records were used to estimate crustal thickness under Rio de Janeiro seismic station. Earthquakes with shallow focal depths (10–33 km) and epicentral distances varying from 83 to 88 degrees provided the best estimates of crustal thickness. Epicentral distance seems to be the most important parameter in getting adequate amplitude and phase spectra. The estimated crustal thickness under RDJ station is 32.9 ± 2.6 km. This value is compatible with an intraplate continent–ocean transition zone and with recent surface wave studies and crustal thickness determinations from receiver functions.
Key words: SH waves, amplitude and phase spectra, crustal thickness, Rio de Janeiro, S wave velocity, southeastern Brazil.
1. Introduction
Seismological research in South America began at the end of the XIX century, with the installation of the Observatório Nacional station at Rio de Janeiro, Brazil. Since then, the instrumentation of seismic station RDJ has been updated regularly. Until 1977, all analog records generated at RDJ were sent to North American institutions, which were responsible for providing all necessary material to support of the station. From 1977 to 1992, Observatório Nacional accumulated a valuable data set of long period analog records, which have been used to investigate crustal and upper mantle structure of Brazil by surface wave dispersion (Souza, 1988; 1991; 1995; 1996a; 1996b; 1996c).
The spectral content of seismic body waves has been used in the seismological literature to estimate crustal thickness in many places around the world (Bakun, 1971; Leong, 1975; Al–Amri, 1998). In Brazil, information about crustal thickness is limited and concentrated in some regions of the country. Surface wave studies along profiles crossing several geological provinces (Souza, 1988; 1991; 1996b) have shown that the average crustal thickness in Eastern Brazil is around 40 ± 5 km, which is a typical value for shield regions. However, recent determinations of crustal thickness in Southeastern Brazil (Assumpção et al., 1997; Assumpção et al., 2002), by using receiver function methodology, show significant variations of crustal thickness in that region. According to Assumpção et al. (1997), crustal thickness in southeastern Brazil varies from 37 to 47km. In the Paraná basin, they found an average crustal thickness of 43 ± 3km, whereas in Mantiqueira it is 41 ± 3km and in the Ribeira belt it is 39 ± 3km.
A recent three–dimensional S wave velocity structure study in southeastern Brazil, using a large data set of Rayleigh wave dispersion curves, has also generated a 3D Moho image for the region (Pacheco, 2003). It shows that Moho depth under RDJ seismic station is around 32 km. The objective of this paper is to use long period analog records of S waves recorded at station RDJ, to estimate crustal thickness under it. Information from amplitude and phase spectra of SH waves is applied to compute crustal thickness.
2. GEOTECTONIC SETTING
The continental part of the South American plate features strong geological and tectonic contrasts. Geologic history from the Precambrian to the present covers three major tectonic provinces: Andean Cordillera, Patagonian platform and South American platform. The platforms are tectonically stable and the Cordillera is tectonically active. According to Almeida et al. (1981), the South American platform is divided into four large cratonic areas (Figure 1). The first craton is the Guyana shield, which is geologically constituted of a thin post–Paleozoic cover over metamorphosed and igneous rocks of Precambrian age (Figure 1). The central and eastern parts of the Guyana block are composed of granulites and gneisses with ages varying from 3700 to 3400 ma. The second cratonic area is the central Brazilian shield, covered by Phanerozoic sedimentary rocks and associated basalts with thicknesses of a few hundred meters (Figure 1). The Tocantins sector of this province, located between the Amazonian and São Francisco cratons, shows three different structural regions. Rocks older than 2600 ma are normally found in the central part of the province. The Tapajós province, or Guaporé craton, is composed of Precambrian rocks covered by remnants of Phanerozoic deposits (Almeida et al., 1981). A few isolated radiometric determinations have suggested that a large part of the Xingu complex is older than 2500 ma.
The third cratonic area is the Atlantic shield, characterized by a cover of various ages with granitic–gneissic complexes exposed in some places (Figure 1). The northern part of this province is the Borborema province, which coincides with the Nordeste fold belt. The Mantiqueira province, where Rio de Janeiro is located, is almost entirely formed by coastal mountains. Finally, the Rio de La Plata craton represents the southern part of the Brazilian territory, plus Uruguay and northern Argentina (Figure 1). This craton is mostly covered by Phanerozoic sediments and features an extensive association of granites, granodiarites and migmatites with metasedimentary troughs. Radiometric determinations in the basement of this province indicate that the cratonic area was consolidated at the end of the Transamazonian cycle (Almeida et al., 1981).
Surrounding the cratonic cores are four great intracratonic basins: Amazonian, Parnaíba, Paraná and Chaco (Figure 1). The Amazonian basin is located between the Guyana and central Brazilian shields and it contains Paleozoic marine deposits from Early Silurian to Permian age (Figure 2). The Parnaíba basin is located entirely in the northern part of the Brazilian territory. It has an almost circular shape with elevations commonly less than 600 m (Figure 2). The subsidence of this province began in Early Silurian or probably in Late Ordovician, after erosion of the Precambrian basement rocks. According to Almeida et al. (1981), the region was affected by several episodes of marine and continental sedimentation with ages ranging from Early Devonian to Early Permian. The Paraná basin is situated mainly in the southern part of the Brazilian territory, but it also extends into Paraguay, Uruguay and Argentina (Figure 2). According to Almeida et al. (1981), the oldest sediments of the province are of Silurian age and are found in Paraguay. The evolution of the basin is marked by episodes of marine (Devonian and Carboniferous) and continental (Permian) sedimentation. A sedimentary cover of about 4.2 km thickness was deposited during the more recent periods of sedimentation (Almeida et al., 1981). During the separation of South America from Africa, in the Late Jurassic, the province was extensively covered by continental sediments of 0.4 km thickness with basaltic flows of up to 1.5 km thickness in north–central Paraná province (Almeida et al., 1981). The Chaco basin occupies the southern and southwestern parts of the South American platform (Figure 1). According to Almeida (1969), this province is almost entirely covered by a few hundred meters of Cenozoic sediments. In its deeper parts, the sedimentary cover reaches up to 3.2 km thickness. The older sediments in the Chaco basin are probably from Early Silurian or Early Devonian and the youngest sediments are of Quaternary age.
RDJ station is located in Mantiqueira province (Figure 3). It is dominated by a large mountain range, which spreads along the entire coastal area of southeastern Brazil. In northern Mantiqueira province there are three fold systems which originated in the Brasiliano Cycle, separated by two massifs following a NE–SW direction. In the massifs, the pre–Brasiliano basement is exposed as Middle and Early Precambrian covers. Several small basins are found within the fold systems and its margins are filled with molasses and acidic to intermediate lavas with a thickness of around 5 km (Almeida et al., 1981).
3. METHODOLOGY
When a wave arrives at an interface between two media of different elastic properties, it gives rise to reflected and refracted waves. The number of reflected and refracted waves depends on the incident wave or the media (Båth, 1973). If the incident wave is an SH wave and if the media are solid, a reflected SH wave and refracted SH wave are generated. The energy associated with SH is not converted to another kind of wave and may be used to estimate the crustal thickness H beneath RDJ seismic station (Figure 4). We use SH waves of earthquakes at large distances from the seismic station. According to Ibrahim (1969), the propagation of SH waves in a stratified medium can be used to investigate the amplitude relationship between an incident plane wave at the Mohorovicic discontinuity and its corresponding reflected and refracted waves. He showed that the amplitude spectrum, either for a single–layer or double–layer model, contains a series of maxima and minima, which are related to constructive and destructive interference in the crust. A minimum of the theoretical amplitude spectrum coincides with a zero of the theoretical phase spectrum, and a straight line is obtained when the frequencies related to those particular points in the spectra are plotted against an integer corresponding to the number of the minimum.
For a single layer overlying an infinite half–space, the maxima and minima in the amplitude spectrum are due to resonance effects in the crust (Ibrahim, 1969) and their loci are given by
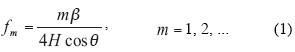
where f is the spectral frequency, m is the order number of the minimum in the amplitude spectrum, β is the shear wave velocity of the layer of thickness H, and θ is the angle of incidence at the base of the crust beneath RDJ station (Figure 4).
3.1. Computation of amplitude and phase spectra
Let h(kT) and  be a discrete S wave record observed at RDJ seismic station and its Discrete Fourier Transform, respectively. We may write (Brigham, 1988)
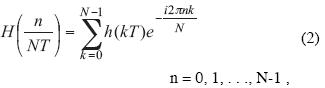
where n and k are integers, T is the sampling interval, N is the total number of points of the discrete S wave record and i is the imaginary number.
As is a complex quantity, the amplitude spectrum is given by
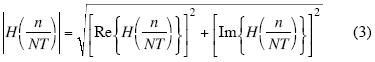
and the phase spectrum is
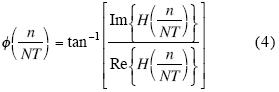
where Im{ } and Re{ } stand for the imaginary and real parts. The computation of the amplitude and phase spectra, through equations (3) and (4), provides the terms f and m of equation (1).
3.2. Determination of the incidence angle
Consider the propagation of an S wave from source F to station RDJ (Figure 5). If an initial angle α is considered at the source, we may use Snell's law to compute the incidence angle θ at RDJ seismic station through the following expression
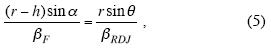
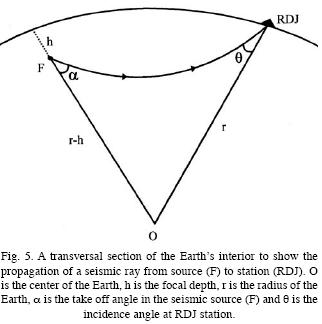
where r is the Earth's radius, h is the focal depth, and βF and βRDJ are the shear wave velocities at the source and beneath RDJ station, as defined by the Earth model used in the computations.
3.3. Shear wave velocity beneath RDJ station
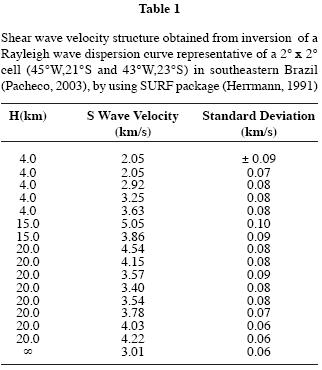
In order to compute the crustal thickness under RDJ station from equation (1) we need an average shear wave velocity value for the crust beneath the seismic station. In practice, this value is obtained from global Earth models, which represent average values on a large scale. However, we may use data from the three–dimensional S wave velocity structure of the southeastern Brazilian lithosphere (Pacheco, 2003). We are using the estimated shear wave velocity structure of the cell that contains RDJ station (Table 1). The Rayleigh wave dispersion inversion results for this cell is shown in Figure 6. Observed and theoretical Rayleigh wave dispersion curves match quite well over the period range analysed (Figure 6a). However, the estimated shear wave velocity structure is well resolved only in the upper 50 km. The resolving kernels for the layers below 50 km are broad and undefined. For depths below 180 km, both final and starting models are similar (Figure 6b). A high S wave velocity layer in the intermediate and/or lower parts of the crust is observed and well resolved by the dispersion data (Figure 6b). If we remove this anomalous layer the estimated model is still a consistent model for the region. Because of this layer, we make the computation of crustal thickness for two different situations, i. e., by considering the high velocity zone as a lower crustal layer and by considering the high velocity zone as an intermediate crustal layer. In practice, it means to calculate an average S wave velocity value by using the upper six or seven layers of the estimated shear wave velocity model (Table 1). The details and results of this procedure will be discussed in section 5.
4. DATA PROCESSING
The principal data for this study are the analog seismograms obtained at RDJ seismic station from 1978 to 1984 (Perez et al., 1984; Bueno et al., 1987). Thus, the first step was the selection of seismic events where the S phase was clearly recorded in the horizontal components of the motion. We looked for phases IS (sharply recorded) in the RDJ station bulletins (Perez et al., 1984; Bueno et al., 1987).
A total of sixty five earthquakes were initially selected to be used in the present study. The next step was an analysis of the seismograms' conditions, i. e., to verify time marks, signal's amplitude, absence of components, etc. Thirty–two earthquakes were eliminated from the initial sample due to amplitudes or absence of horizontal components. The remaining thirty three earthquakes were selected for the present study (Table 2). The analog seismograms, corres ponding to the horizontal components of the motion (N–S and E–W), were converted from analog to digital. An example of long period analog records is displayed in Figure 7.
A time window of three minutes in the horizontal analog seismograms, corresponding to S wave arrival, was digitized at irregular intervals and a linear interpolation was used to produce a regular discrete signal with a sampling interval of 1s. The digital signal was corrected for linear trend and the horizontal components was rotated to obtain both radial and transversal components of the motion. The Discrete Fourier Transform was applied to the transverse components of the motion (SH waves), so that both amplitude and phase spectra were obtained from equations (3) and (4).
Equation (5) was computationally implemented to calculate an incidence angle at RDJ seismic station. The Earth model used in the incidence's angle computation was IASP91 (Kennett and Engdahl, 1991). The estimated angles of incidence at the base of the crust under RDJ station are displayed in Table 2.
5. DISCUSSION AND INTERPRETATION
Amplitude and phase spectra of the earthquakes listed in Table 2 were computed, through equations (3) and (4), and carefully analyzed to identify where the minimum of the amplitude spectrum coincides with the zero of the phase spectrum. Three seismic events presented the expected behaviour in both amplitude and phase spectra. The spectral information about these seismic events is displayed in Figures 8–10. All amplitude spectra show clearly a high signal/noise ratio and, in all cases, the seismic signal is concentrated in the frequency range below 0.1 Hz. Furthermore, signal energy is approximately six times larger than noise energy.
Theoretically, we are looking for SH waves arising vertically at the base of the crust and, therefore, their incidence angles should be small. Table 2 indicates that the angles of the three seismic events (Figures 8–10) are in the group of the lowest incidence angles. Most other earthquakes did not present systematically coincidence of amplitude and phase spectra. Table 2 shows that, in general, the incidence angles are higher than 20 degrees. There are only eight earthquakes (Table 2) with incidence angle smaller than 20 degrees. Table 2 shows that these seismic events have epicentral distances ranging from 75 to 92 degrees. In general, they have shallow focal depth (from 10 to 33 km), but the lowest incidence angle was for an earthquake with focal depth of 98 km and epicentral distance around 90° (seismic event # 12). Apparently, focal depth is not relevant.
Seismic events 11 and 22 (Table 2) displayed a coincidence between amplitude minimum and zero of the phase spectrum (Figures 8 and 9). Earthquake number 23 (Table 2) presented an approximate coincidence of both amplitude and phase spectra (Figure 10). In Figures 8–10, the arrows are in the frequency band from DC to 0.1 Hz, which is the band related to the long period seismic signal.
The four parameters f, m, β and θ (equation 1), and the corresponding crustal thickness for the best amplitude and phase spectra are shown in Table 3. We are using two different average shear wave velocities beneath RDJ station, but the difference between both average values is not relevant ( 3% – Table 1) and will not affect significantly the crustal thickness estimates. The difference is from 0.9 to 1.1 km, less than 3% in crustal thickness under RDJ station (Table 3).
Results for events 22 and 23 are consistent and agree with a typical continent–ocean transition zone (Laske et al. 2000). Estimated crustal thickness from seismic event # 11 (Table 3) is slightly different from those found for seismic events # 22 and 23, but is still reasonable for the region under investigation.
Our assumption that crustal structure beneath RDJ seismic station can be represented by one layer over an infinite half–space (Figure 4), implies that the incidence angle of SH waves does not change inside the crust. However, a recent surface wave tomographic study in southeastern Brazil (Pacheco, 2003) has pointed out the presence of a high S wave velocity layer in the intermediate and/or lower parts of the crust around RDJ station (Figure 6). If this layer exists, it may affect the incidence angle of a SH wave and its corresponding spectral content. This might account for the variations in amplitude and phase spectra of the four earthquakes displayed in Table 2 (seismic events 12, 24, 29 and 32). These earthquakes have general characteristics similar to those used in the crustal thickness determination (seismic events 11, 22 and 23), but their spectra did not show the expected coincidence.
A map with the geographical location of all earthquakes displayed in Table 2 is shown in Figure 11. The data are reasonably well distributed azimuthally, but seismic events 11, 22 and 23 (Table 2) used in the crustal thickness estimate are concentrated in a very narrow azimuthal range. The seismic events with coincidence in amplitude and phase spectra (seismic events 11 and 22 – Table 2) have almost the same back–azimuth in relation to RDJ station. The seismic event with approximate coincidence in both amplitude and phase spectra (seismic event 23— Table 2) has a back–azimuth slightly different from seismic events 11 and 22. Furthermore, it coincides (or it is very close) with those earthquakes whose general characteristics are similar to the seismic events 11 and 22 (seismic events 24, 29 and 32 – Table 2), but their amplitude and phase spectra did not present any coincidence. These observations suggest that the likely high S wave velocity layer is not uniformly distributed azimuthally. In conclusion, the existence of a high S wave velocity layer inside the Earth's crust beneath RDJ station, such as observed by surface wave tomography in southeastern Brazil (Pacheco, 2003) and presented in Figure 6, could explain the lack of coincidence in both amplitude and phase spectra of seismic events 12, 24, 29 and 32 (Table 2). The same idea can be applied to explain the approximate coincidence of seismic event 23 (Table 2) and also for explaining the differences in the crustal thicknesses obtained with seismic events 11, 22 and 23 (Table 3). From all estimates of Table 3, an average value of 32.9 km, with a standard deviation of 2.6 km, is obtained for the crustal thickness under RDJ seismic station.
6. CONCLUSIONS
Amplitude and phase spectra of long period S waves were used to estimate crustal thickness under RDJ seismic station. Three earthquakes with shallow focal depths (10–33 km) and epicentral distances ranging from 83 to 88 degrees provided the best estimates of crustal thickness. The hypocentral parameters of those seismic events are in agreement with the theoretical assumption that incidence's angle at base of the crust (beneath the station) must be small, i. e., vertical incidence. The estimated crustal thickness under RDJ station is 32.9 ± 2.6 km. This value is compatible with a continent–ocean transition zone, where RDJ station is located. Our estimate is also compatible with recent surface wave studies (Pacheco, 2003) and crustal thickness determinations (Assumpção et al., 2002) in the area, and it supports the idea that crustal thickness is thinning towards sea.
ACKNOWLEDGEMENTS
One of the authors (FDC) would like to thank Conselho Nacional de Desenvolvimento Científico e Tecnológico (CNPq) for providing financial support for the development of this research (process # : 105473/98–7), while he took part in the Programa Institucional de Bolsas de Iniciação Científica (PIBIC) of the MCT/Observatório Nacional. The author JLS also thanks MCT/Observatório Nacional for all support. The authors also thank both anonymous reviewers for the construtive comments and Constantino de Mello Motta for helping with several figures. The Generic Mapping Tools package (Wessel and Smith, 1998) was also used to generate one figure.
Bibliography
ALMEIDA, F. F. M., 1969. Diferenciação tectônica da plataforma brasileira. In: Anais do 23° Congresso Brasileiro de Geologia, Salvador, Socieda de Brasileira de Geologia, 29–46. [ Links ]
ALMEIDA, F. F. M., B. B. DE BRITO NEVES and R. A. FUCK, 1981. Brazilian structural provinces: na Introduction. Earth–Sci. Rev., 17, 1–29. [ Links ]
AL–AMRI, A. M. S., 1998. The crustal structure of the western Arabian platform from the spectral analysis of long–period P–wave amplitude ratios. Tectonophysics 290, 271–283. [ Links ]
ASSUMPÇÃO, M., D. JAMES and A. SNOKE, 1997. Crustal thicknesses in SE Brazilian shield with receiver function : isostatic compensation by density variations in the lithospheric mantle. 5th International Congress of the Brazilian Geophysical Society, Expanded Abstracts, 895–897. [ Links ]
ASSUMPÇÃO, M., D. JAMES and A. SNOKE, 2002. Crustal thicknesses in SE Brazilian shield by receiver function analysis: Implications for isostatic compensation. J. Geophys. Res. 107, NO. B1, 10.1029/ 2001JB000422. [ Links ]
BAKUN, W. H., 1971. Crustal model parameter from P–wave spectra. Bull. Seism. Soc. Am. 61, 913–935. [ Links ]
BÅTH, M., 1973. Introduction to Seismology, Birkhäuser Verlag, Basel and Stuttgart, 395pp. [ Links ]
BRIGHAM, E. O., 1988. The Fast Fourier Transform and its applications, Prentice–Hall Inc., New Jersey, 448pp. [ Links ]
BUENO, A., R. AKEHO and H. TEIXEIRA, 1987. Boletim sismológico: período 1982 – 1984. Publicação Especial do Observatório Nacional, 118pp. [ Links ]
HERRMANN, R. B., 1991. Computer programs in Seismology. Saint Louis University, MO. [ Links ]
IBRAHIM, A.–B. K., 1969. Determination of crustal thickness from spectral behavior of SH waves. Bul. Seism. Soc. Am. 59, 1247–1258. [ Links ]
KENNETT, B. L. N. and E. R. ENGDAHL, 1991. Traveltimes for global earthquake location and phase identification. Geophys. J. Int. 105, 429–465. [ Links ]
LASKE, G. G., G. MASTERS and C. REIF, 2000. CRUST2.0: A new global crustal model at 2° x 2°. http://mahi.ucsd.edu/Gabi/rem.dir/crust/crust2.html [ Links ]
LEONG, L. S., 1975. Crustal structure of the Baltic shield beneath Umea, Sweden, from the spectral behavior of long–period P waves. Bull. Seism. Soc. Am. 65, 113–126. [ Links ]
PACHECO, R. P., 2003. Imageamento tridimensional da onda S na litosfera do sudeste brasileiro e adjacências. Ph.D. thesis, MCT/Observatório Nacional, Rio de Janeiro, 495 pp (In Portuguese). [ Links ]
PEREZ, A. B., R. AKEHO, C. A. MANSO and J. L. SOUZA, 1984. Boletim sismológico: período 1978 – 1981. Publicação Especial do Observatório Nacional, 206pp. [ Links ]
SOUZA, J. L. DE, 1988. Estrutura da crosta terrestre na região do escudo Atlântico Brasileiro. M.Sc. dissertation. CNPq/Observatório Nacional, Rio de Janeiro, 195pp (In Portuguese). [ Links ]
SOUZA, J. L. DE, 1991. Crustal and upper mantle structures of the Brazilian coast. Pure and Appl. Geophys. 136, 604–624. [ Links ]
SOUZA, J. L. DE, 1995. Shear wave velocity in the southeastern Brazilian continental shelf. Geophys. J. Int. 122, 691–702. [ Links ]
SOUZA, J. L. DE, 1996a. S wave velocity in the south Atlantic oceanic lithosphere. An. Acad. Bras. Ci. 68, 41–63. [ Links ]
SOUZA, J. L. DE, 1996b. Shear wave velocities beneath the eastern part of Brazil. Geofís. Int., 35, 301–314. [ Links ]
SOUZA, J. L. DE, 1996c. Crustal structure of the southeastern Brazilian continental margin from surface wave dispersion. Geofís. Int., 35, 285–300. [ Links ]
WESSEL, P. and W. H. F. SMITH, 1998. New, improved version of the Generic Mapping Tools released, EOS Trans. Am. Geophys. U. 79, 579. [ Links ]

