




 nueva página del texto (beta)
 Inglés (pdf)
 Artículo en XML
 Referencias del artículo
 Traducción automática
 Enviar artículo por email
 Citado por SciELO
  Similares en
SciELO
Similares en
SciELO 
 Permalink

Organisations generally invest capital in acquiring industrial warehouses, machinery, research laboratories, offices, and other similar long-lived assets, as well as hiring personnel to manage, oversee the production process, and make purchases of raw materials, while also extending credit to their customers. Shareholders can provide financial resources through capital exhibitions, the generation and retention of profits or through the contracting of debt.
Assessing the return on capital invested in tangible and intangible resources is often complicated. ROIC is a financial metric that helps evaluate the return on capital invested by a company. (Damodaran, 2008). When seeking to measure the efficiency of capital invested, if the ROIC exceeds the cost of capital, the company is generating value.
ROIC is a key profitability metric in corporate finance that measures a company's efficiency in allocating its capital to profitable investments. ROI has been widely used in the financial literature by renowned researchers, advisors, and professionals, including Ben-David, Graham, and Harvey (2013); Furman and Orszag (2015); Koller (1994); and Koller, Goedhart, and Wessels (2017). In addition, Wall Street analysts have declared and promoted ROIC as the most crucial metric in finance (Benoit, 2016), catalogued as a key factor in capital allocation.
ROIC Advantage
The advantage of ROIC is that it measures investment capital as something more than physical capital (fixed assets and investments); research conducted by Doidge et al. (2018) shows that, over time, investment in total assets decreases in relation to investment in intangible assets. In addition, unlike traditional measures, ROIC examines the return on total capital invested and clearly shows whether a company is creating value for its shareholders.
In the evaluation of financial profitability, most traditional measures such as return on equity (ROE) and return on assets (ROA) are considered, which have limitations when measuring the value generated by companies in the long term from equity, these ratios have limitations when measuring the value generated by companies in the long term from equity These indicators take into account the net profits of the income statement and the balance sheet, but do not report on the total capital invested.
Calculation of ROIC
In the article "Return on Invested Capital: How to Calculate ROIC and Handle Common Issues", written by Michael J. Mauboussin and Dan Callahan, the terms of ROIC are defined and explained in a clear and precise way. They also show that this metric is calculated with the following formula:
NOPAT = EBITA - cash taxes
Earnings Before Interest and Taxes (EBIT)* (1-Taxes) represents Net Operating Profit After Taxes (NOPAT), but before the financing cost income generated by investments made in operations. Therefore, the NOPAT is the return generated by the capital invested.
The authors state that understanding how a company generates its returns can guide the assessment of its sustainability, and knowing how a company generates an attractive ROIC can inform the analysis of its competitive strategy. The origin of the returns and the rationale of the plan were provided by breaking down the previous formula into NOPAT Margin and Turnover of Invested Capital.
Interpretation
Return on invested capital (ROIC) is typically used with two approaches:
Investments. In making asset allocation decisions. If different investment opportunities carry the same risk, the company should always invest in the proposition that offers the highest ROIC.
ROIC Vs WACC. When comparing the ROIC with the Weighted Average Cost of Capital (WACC) of the investment. If the return on the ROIC exceeds the expected return (WACC), the investment should be made.
Valuation multiples. If two companies are similar, but one has a higher ROIC, the company with a higher ROIC should, in theory, trade at higher valuation multiples, for example: (Share Price / Earnings Per Share) = P/E; (Total Enterprise Value)/(Earnings before interest, taxes, depreciation, and amortisation) = TEV /EBITDA, etc.
Proposals
In decision-making, the following is suggested:
If a company achieves a high ROIC thanks to a high NOPAT margin, the analysis should focus on differentiation.
If the company's high performance comes from a high turnover rate of invested capital, it is essential to analyse cost leadership.
Few companies have high NOPAT margins and high turnover rates of invested capital. Generally, these companies have advantages reinforced by economies of scale. Economic and financial indicators are helpful tools that benefit organisations by facilitating timely and appropriate decision-making about their corporate and financial strategies. Next, the evolution of key economic and financial indicators in the Mexican environment is described to facilitate informed decision-making related to personal and business strategies in an integrated manner.
1. NATIONAL CONSUMER PRICE INDEX (INPC)
Born in 1995, it reflects changes in consumer prices, measuring the general increase in prices in the country. It is calculated on a fortnightly basis by the Bank of Mexico and INEGI (2021). INPC is published in the Official Gazette of the Federation on the 10th and 25th of each month. The reference period is the second half of July 2018.
Table 1 Accumulated inflation in the year (Base: 2nd half of July 2018=100 with data provided by Banco de México)
| Period | 2014 | 2015 | 2016 | 2017 | 2018 | 2019 | 2020 | 2021 | 2022 | 2023 | 2024 | 2025 |
|---|---|---|---|---|---|---|---|---|---|---|---|---|
| January | 0.90 | -0.09 | 0.38 | 1.70 | 0.53 | 0.09 | 0.48 | 0.86 | 0.59 | 0.76 | 0.89 | 0.29 |
| February | 1.15 | 0.09 | 0.82 | 2.29 | 0.91 | 0.06 | 0.90 | 1.50 | 1.43 | 1.24 | 0.99 | 0.56 |
| March | 1.43 | 0.51 | 0.97 | 2.92 | 1.24 | 0.44 | 0.85 | 2.34 | 2.43 | 1.51 | 1.28 | 0.88 |
| April | 1.24 | 0.25 | 0.65 | 3.04 | 0.90 | 0.50 | -0.17 | 2.67 | 2.98 | 1.49 | 1.48 | 1.21 |
| May | 0.91 | -0.26 | 0.20 | 2.92 | 0.73 | 0.21 | 0.22 | 2.88 | 3.17 | 1.27 | 1.29 | 2.05 |
| June | 1.09 | -0.09 | 0.31 | 3.18 | 1.12 | 0.27 | 0.76 | 3.43 | 4.04 | 1.37 | 1.68 | 1.78 |
| July | 1.42 | 0.06 | 0.57 | 3.57 | 1.66 | 0.65 | 1.43 | 4.04 | 4.81 | 1.86 | 2.74 | 1.50 |
| August | 1.73 | 0.27 | 0.86 | 4.08 | 2.26 | 0.63 | 1.82 | 4.24 | 5.54 | 2.42 | 2.75 | |
| September | 2.18 | 0.27 | 1.47 | 4.41 | 2.69 | 0.89 | 2.06 | 4.88 | 6.19 | 2.88 | 2.80 | |
| October | 2.74 | 1.16 | 2.09 | 5.06 | 3.22 | 1.44 | 2.68 | 5.76 | 6.79 | 3.27 | 3.37 | |
| November | 3.57 | 1.71 | 2.89 | 6.15 | 4.10 | 2.26 | 2.76 | 6.97 | 7.41 | 3.93 | 3.06 | |
| December | 4.08 | 2.13 | 3.36 | 6.77 | 4.83 | 2.83 | 3.15 | 7.35 | 7.82 | 4.66 | 4.21 |
Source: Own elaboration (INEGI, 2025). Route: Indicadores económicos de coyuntura > Índices de precios >
Índice nacional de precios al consumidor. Base segunda quincena de julio de 2018=100 > Mensual > Índice >Índice general
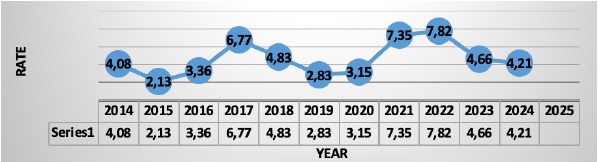
Source: Own elaboration (INEGI, 2025). Route: Indicadores económicos de coyuntura > Índices de precios > Índice nacional de precios al consumidor. Base segunda quincena de julio de 2018=100 > Mensual > Índice > Índice general
Graph 1 Inflation in Mexico (2014-2024 accumulated at the end of the year)
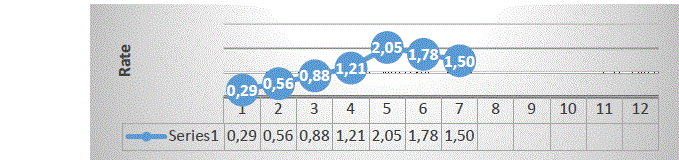
2. THE PRICE AND QUOTATION INDEX OF THE MEXICAN STOCK EXCHANGE (IPC)
Represents the change in the values traded on the Mexican Stock Exchange concerning the previous day to determine the percentage of rise or fall of the most representative shares of the companies listed therein.
Table 2 The Price and Quotation Index of the Mexican Stock Exchange (Base: October 1978, 0.78=100)
| Period | 2014 | 2015 | 2016 | 2017 | 2018 | 2019 | 2020 | 2021 | 2022 | 2023 | 2024 | 2025 |
|---|---|---|---|---|---|---|---|---|---|---|---|---|
| January | 40,879 | 40,951 | 43,631 | 47,001 | 50,456 | 43,988 | 44,862 | 42,986 | 51,331 | 54,564 | 57,373 | 51,210 |
| February | 38,783 | 44,190 | 43,715 | 46,857 | 47,438 | 42,824 | 41,324 | 44,593 | 53,401 | 52,758 | 55,414 | 52,326 |
| March | 40,462 | 43,725 | 45,881 | 48,542 | 46,125 | 43,281 | 34,554 | 47,246 | 56,537 | 53,904 | 57,369 | 52,484 |
| April | 40,712 | 44,582 | 45,785 | 49,261 | 48,354 | 44,597 | 36,470 | 48,010 | 51,418 | 55,121 | 56,728 | 56,259 |
| May | 41,363 | 44,704 | 45,459 | 48,788 | 44,663 | 42,749 | 36,122 | 50,886 | 51,753 | 52,736 | 55,179 | 57,842 |
| June | 42,737 | 45,054 | 45,966 | 49,857 | 47,663 | 43,161 | 37,716 | 50,290 | 47,524 | 53,526 | 52,440 | 57,451 |
| July | 43,818 | 44,753 | 46,661 | 51,012 | 49,698 | 40,863 | 37,020 | 50,868 | 48,144 | 54,819 | 53,094 | 57,398 |
| August | 45,628 | 43,722 | 47,541 | 51,210 | 49,548 | 42,623 | 36,841 | 53,305 | 44,919 | 53,021 | 51,986 | 58,709 |
| September | 44,986 | 42,633 | 47,246 | 50,346 | 49,504 | 43,011 | 37,459 | 51,386 | 44,627 | 50,875 | 52,477 | |
| October | 45,028 | 44,543 | 48,009 | 48,626 | 43,943 | 43,337 | 36,988 | 51,310 | 49,922 | 49,062 | 50,661 | |
| November | 44,190 | 43,419 | 45,286 | 47,092 | 41,733 | 42,820 | 41,779 | 49,699 | 51,685 | 54,060 | 49,813 | |
| December | 43,146 | 42,998 | 45,643 | 49,354 | 41,640 | 43,541 | 44,067 | 53,272 | 48,464 | 57,386 | 49513 |
Source: Own elaboration (BANXICO, 2025).
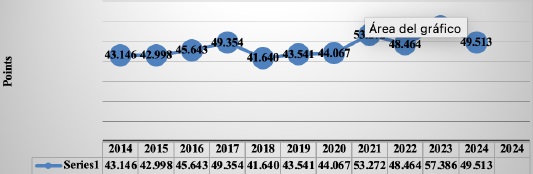
Source: Own elaboration (BANXICO, 2025). https://www.banxico.org.mx/SieInternet/consultarDirectorioInternetAction.do?sector=7&accion=consultarCu adro&idCuadro=CF57&locale=es
Graph 3 The Price and Quotation Index of the Mexican Stock Exchange, 2014 - 2024 (Score at the end of each year
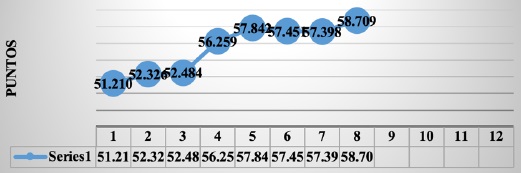
Source: Own elaboration (BANXICO, 2025). https://www.banxico.org.mx/SieInternet/consultarDirectorioInternetAction.do?sector=7&accion=consultarCuadro&idCuadro=CF57&locale=es
Graph 4 The Price and Quotation Index of the Mexican Stock Exchange, January-August 2025 (Score at the end of each month)
3. EXCHANGE RATE
It is the value of the Mexican peso in relation to the dollar, calculated using the daily average of the five most important banks in the country, which reflects the spot price (cash) negotiated between banks. It is highly related to Inflation, the interest rate, and the Mexican Stock Exchange.
Table 3 Exchange rate (National currency per US dollar, parity at the end of each period)
| Period | 2014 | 2015 | 2016 | 2017 | 2018 | 2019 | 2020 | 2021 | 2022 | 2023 | 2024 | 2025 |
|---|---|---|---|---|---|---|---|---|---|---|---|---|
| January | 13.37 | 14.69 | 18.45 | 21.02 | 18.62 | 19.04 | 18.91 | 20.22 | 20.74 | 18.79 | 17.16 | 20.61 |
| February | 13.30 | 14.92 | 18.17 | 19.83 | 18.65 | 19.26 | 19.78 | 20.94 | 20.65 | 18.40 | 17.06 | 20.51 |
| March | 13.08 | 15.15 | 17.40 | 18.81 | 18.33 | 19.38 | 23.48 | 20.44 | 19.99 | 18.11 | 16.53 | 20.44 |
| April | 13.14 | 15.22 | 19.40 | 19.11 | 18.86 | 19.01 | 23.93 | 20.18 | 20.57 | 18.07 | 17.09 | 19.61 |
| May | 12.87 | 15.36 | 18.45 | 18.51 | 19.75 | 19.64 | 22.18 | 19.92 | 19.69 | 17.56 | 17.01 | 19.33 |
| June | 13.03 | 15.57 | 18.91 | 17.90 | 20.06 | 19.21 | 23.09 | 19.91 | 20.13 | 17.07 | 18.24 | 18.89 |
| July | 13.06 | 16.21 | 18.86 | 17.69 | 18.55 | 19.99 | 22.20 | 19.85 | 20.34 | 16.73 | 18.59 | 18.76 |
| August | 13.08 | 16.89 | 18.58 | 17.88 | 19.07 | 20.07 | 21.89 | 20.06 | 20.09 | 16.84 | 19.60 | 18.65 |
| September | 13.45 | 17.01 | 19.50 | 18.13 | 18.90 | 19.68 | 22.14 | 20.56 | 20.09 | 17.62 | 19.64 | |
| October | 13.42 | 16.45 | 18.84 | 19.15 | 19.80 | 19.16 | 21.25 | 20.53 | 19.82 | 18.08 | 20.04 | |
| November | 13.72 | 16.55 | 20.55 | 18.58 | 20.41 | 19.61 | 20.14 | 21.45 | 19.40 | 17.14 | 20.32 | |
| December | 14.72 | 17.21 | 20.73 | 19.79 | 19.68 | 18.87 | 19.91 | 20.47 | 19.47 | 16.89 | 20.79 |
NOTE: Exchange rate fixed by the Banco de México, used for settling obligations denominated in foreign currency. Quote at the end.
Source: Own elaboration (BANXICO, 2025). https://www.banxico.org.mx/SieInternet/consultarDirectorioInternetAction.do?sector=6&accion=consultarCuadro&idCuadro=CF102&locale=es
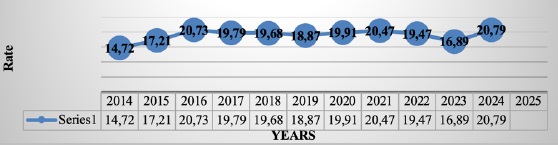
Source: Own elaboration (BANXICO, 2025). https://www.banxico.org.mx/SieInternet/consultarDirectorioInternetAction.do?sector=7&accion=consultarCuadro&idCuadro=CF57&locale=es
Graph 5 Exchange rate (National currency per US dollar, 2014-2024, FIX parity at the end of each year)
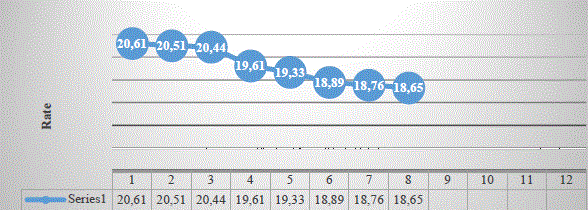
Source: Own elaboration (BANXICO, 2025). https://www.banxico.org.mx/SieInternet/consultarDirectorioInternetAction.do?sector=6&accion=consultarCuadro&idCuadro=CF102&locale=es
Graph 6 Exchange rate (National currency per US dollar, January-August 2025, FIX parity at the end of each month)
4. EQUILIBRIUM INTERBANK INTEREST RATE (TIIE)
On March 23, 1995, the Bank of Mexico, to establish an interbank interest rate that better reflects market conditions, released the Interbank Equilibrium Interest Rate through the Official Gazette of the Federation.
Table 4 Equilibrium interbank interest rate (28-day quote)
| Period | 2014 | 2015 | 2016 | 2017 | 2018 | 2019 | 2020 | 2021 | 2022 | 2023 | 2024 | 2025 |
|---|---|---|---|---|---|---|---|---|---|---|---|---|
| January | 3.78 | 3.29 | 3.56 | 6.15 | 7.66 | 8.59 | 7.50 | 4.47 | 5.72 | 10.82 | 11.50 | 10.28 |
| February | 3.79 | 3.29 | 4.05 | 6.61 | 7.83 | 8.54 | 7.29 | 4.36 | 6.02 | 11.27 | 11.50 | 9.88 |
| March | 3.81 | 3.30 | 4.07 | 6.68 | 7.85 | 8.51 | 6.74 | 4.28 | 6.33 | 11.43 | 11.44 | 9.74 |
| April | 3.80 | 3.30 | 4.07 | 6.89 | 7.85 | 8.50 | 6.25 | 4.28 | 6.73 | 11.54 | 11.25 | 9.28 |
| May | 3.79 | 3.30 | 4.10 | 7.15 | 7.86 | 8.51 | 5.74 | 4.29 | 7.01 | 11.51 | 11.24 | 9.05 |
| June | 3.31 | 3.30 | 4.11 | 7.36 | 8.10 | 8.49 | 5.28 | 4.32 | 7.42 | 11.49 | 11.24 | 8.74 |
| July | 3.31 | 3.31 | 4.59 | 7.38 | 8.11 | 8.47 | 5.19 | 4.52 | 8.04 | 11.51 | 11.25 | 8.26 |
| August | 3.30 | 3.33 | 4.60 | 7.38 | 8.10 | 8.26 | 4.76 | 4.65 | 8.50 | 11.51 | 11.08 | 8.09 |
| September | 3.29 | 3.33 | 4.67 | 7.38 | 8.12 | 8.04 | 4.55 | 4.75 | 8.89 | 11.50 | 11.08 | |
| October | 3.28 | 3.30 | 5.11 | 7.38 | 8.15 | 7.97 | 4.51 | 4.98 | 9.56 | 11.50 | 10.95 | |
| November | 3.31 | 3.32 | 5.57 | 7.39 | 8.34 | 7.78 | 4.48 | 5.13 | 10.00 | 11.50 | 10.74 | |
| December | 3.31 | 3.55 | 6.11 | 7.62 | 8.60 | 7.55 | 4.49 | 5.72 | 10.53 | 11.50 | 10.38 |
Source: Own elaboration (BANXICO, 2025). https://www.banxico.org.mx/SieInternet/consultarDirectorioInternetAction.do?sector=18&accion=c onsultarCuadro&idCuadro=CF101&locale=es
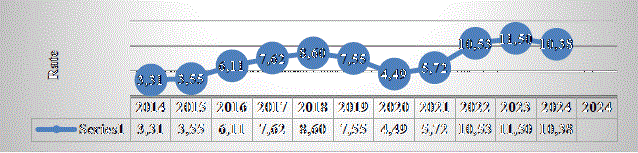
Source: Own elaboration (BANXICO, 2025). https://www.banxico.org.mx/SieInternet/consultarDirectorioInternetAction.do?sector=18&accion=consultarCuadro&idCuadro=CF101&locale=es
Graph 7 Equilibrium interbank interest rate, 2014- 2024 (at the end of each year)
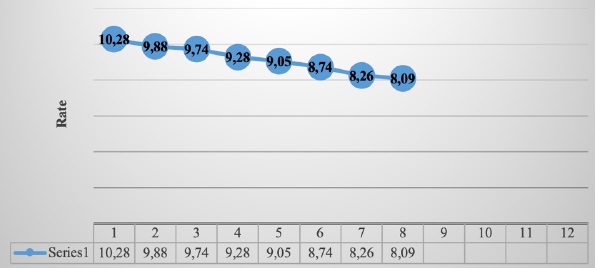
Source: Own elaboration (BANXICO, 2025) https://www.banxico.org.mx/SieInternet/consultarDirectorioInternetAction.do?sector=18&accion=consultarCuadro&idCuadro=CF101&locale=es
Graph 8 Equilibrium interbank interest rate, January-August 2025 (28-day quote)
5. CETES RATE OF RETURN
Table 5 CETES rate of return (28-day)
| Period | 2014 | 2015 | 2016 | 2017 | 2018 | 2019 | 2020 | 2021 | 2022 | 2023 | 2024 | 2024 |
|---|---|---|---|---|---|---|---|---|---|---|---|---|
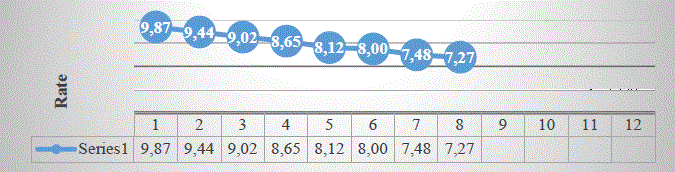
| January | 3.14 | 2.67 | 3.08 | 5.83 | 7.25 | 7.95 | 7.04 | 4.22 | 5.50 | 10.80 | 11.28 | 9.87 |
| February | 3.16 | 2.81 | 3.36 | 6.06 | 7.40 | 7.93 | 6.91 | 4.02 | 5.94 | 11.04 | 11.00 | 9.44 |
| March | 3.17 | 3.04 | 3.80 | 6.32 | 7.47 | 8.02 | 6.59 | 4.08 | 6.52 | 11.34 | 10.90 | 9.02 |
| April | 3.23 | 2.97 | 3.74 | 6.50 | 7.46 | 7.78 | 5.84 | 4.06 | 6.68 | 11.27 | 11.04 | 8.65 |
| May | 3.28 | 2.98 | 3.81 | 6.56 | 7.51 | 8.07 | 5.38 | 4.07 | 6.90 | 11.25 | 11.03 | 8.12 |
| June | 3.02 | 2.96 | 3.81 | 6.82 | 7.64 | 8.18 | 4.85 | 4.03 | 7.56 | 11.02 | 10.88 | 8.00 |
| July | 2.83 | 2.99 | 4.21 | 6.99 | 7.73 | 8.15 | 4.63 | 4.35 | 8.05 | 11.09 | 10.87 | 7.48 |
| August | 2.77 | 3.04 | 4.24 | 6.94 | 7.73 | 7.87 | 4.50 | 4.49 | 8.35 | 11.07 | 10.65 | 7.27 |
| September | 2.83 | 3.10 | 4.28 | 6.99 | 7.69 | 7.61 | 4.25 | 4.69 | 9.25 | 11.05 | 10.35 | |
| October | 2.90 | 3.02 | 4.69 | 7.03 | 7.69 | 7.62 | 4.22 | 4.93 | 9.00 | 11.26 | 10.20 | |
| November | 2.85 | 3.02 | 5.15 | 7.02 | 7.83 | 7.46 | 4.28 | 5.05 | 9.70 | 11.78 | 9.95 | |
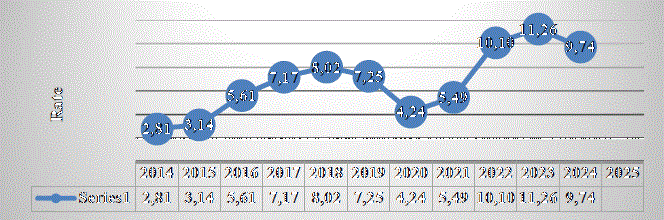
| December | 2.81 | 3.14 | 5.61 | 7.17 | 8.02 | 7.25 | 4.24 | 5.49 | 10.10 | 11.26 | 9.74 |
Source: Own elaboration (BANXICO, 2025). https://www.banxico.org.mx/SieInternet/consultarDirectorioInternetAction.do?sector=22&accion=consultarCuadro&idCuadro=CF107&locale=es
Source: Own elaboration (BANXICO, 2025). https://www.banxico.org.mx/SieInternet/consultarDirectorioInternetAction.do?sector=7&accion=consultarCuadro&idCuadro=CF57&locale=es
Graph 9 CETES rate of return 2014- 2024 (at the end of each year)
Source: Own elaboration (BANXICO, 2025). https://www.banxico.org.mx/SieInternet/consultarDirectorioInternetAction.do?sector=7&accion=consultarCuadro&idCuadro=CF57&locale=es
Graph 10 CETES rate of return, January-August 2025 (at the end of each month)
6. INVESTMENT UNITS (UDIS)
The UDI is a unit of account of constant real value to denominate credit titles. It does not apply to checks, commercial contracts, or other commercial transactions.
Table 6 Investment units (value concerning pesos)
| Period | 2014 | 2015 | 2016 | 2017 | 2018 | 2019 | 2020 | 2021 | 2022 | 2023 | 2024 | 2025 |
|---|---|---|---|---|---|---|---|---|---|---|---|---|
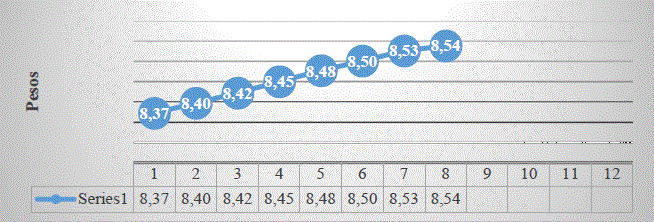
| January | 5.10 | 5.29 | 5.41 | 5.62 | 5.97 | 6.25 | 6.44 | 6.64 | 7.12 | 7.69 | 8.06 | 8.37 |
| February | 5.13 | 5.29 | 5.43 | 5.69 | 6.00 | 6.25 | 6.46 | 6.70 | 7.18 | 7.74 | 8.11 | 8.40 |
| March | 5.15 | 5.30 | 5.44 | 5.71 | 6.02 | 6.26 | 6.49 | 6.75 | 7.24 | 7.77 | 8.11 | 8.42 |
| April | 5.15 | 5.32 | 5.45 | 5.75 | 6.03 | 6.28 | 6.43 | 6.79 | 7.31 | 7.78 | 8.13 | 8.45 |
| May | 5.13 | 5.29 | 5.42 | 5.75 | 6.01 | 6.27 | 6.42 | 6.81 | 7.33 | 7.78 | 8.15 | 8.48 |
| June | 5.13 | 5.28 | 5.42 | 5.75 | 6.01 | 6.26 | 6.44 | 6.83 | 7.36 | 7.77 | 8.13 | 8.50 |
| July | 5.14 | 5.28 | 5.42 | 5.76 | 6.04 | 6.27 | 6.49 | 6.87 | 7.43 | 7.79 | 8.20 | 8.53 |
| August | 5.16 | 5.29 | 5.44 | 5.79 | 6.07 | 6.29 | 6.52 | 6.90 | 7.47 | 7.83 | 8.25 | 8.54 |
| Sep. | 5.18 | 5.31 | 5.45 | 5.82 | 6.11 | 6.29 | 6.55 | 6.92 | 7.53 | 7.87 | 8.25 | |
| Oct. | 5.20 | 5.33 | 5.49 | 5.84 | 6.13 | 6.31 | 6.57 | 6.97 | 7.57 | 7.90 | 8.26 | |
| Nov. | 5.23 | 5.36 | 5.53 | 5.89 | 6.17 | 6.35 | 6.60 | 7.04 | 7.62 | 7.94 | 8.32 | |
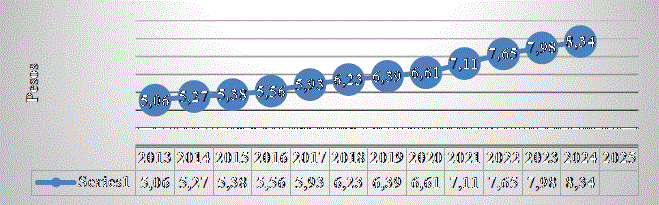
| Dec. | 5.27 | 5.38 | 5.56 | 5.93 | 6.23 | 6.39 | 6.61 | 7.11 | 7.65 | 7.98 | 8.34 |
Source: Own elaboration (BANXICO, 2025). https://www.banxico.org.mx/SieInternet/consultarDirectorioInternetAction.do?accion=consultarCuadro&idCuadro=CP150&locale=es
Source: Own elaboration (BANXICO, 2025). https://www.banxico.org.mx/SieInternet/consultarDirectorioInternetAction.do?sector=7&accion=consultarCuadro&idCuadro=CF57&locale=es
Graph 11 Investment units 2014-2024 (At the end of the year)
Source: Own elaboration (BANXICO, 2025). https://www.banxico.org.mx/SieInternet/consultarDirectorioInternetAction.do?sector=7&accion=consultarCuadro&idCuadro=CF57&locale=es
Graph 12 Investment units, January-August 2025
CONCLUSION
ROIC provides key insights into the return and efficient utilisation of a company's capital investment, enabling you to:
Improve investment and growth strategy.
Optimise capital structure and reduce costs.
Compare the company's performance to that of its competitors.
Prevent financial errors that can compromise the business's stability.
ROIC, like any other valuation metric, is just a tool; it can reveal profitability, strategic or business plan discrepancies, but the metric does not prove anything on its own. It is suggested to complement and strengthen decision-making with additional indicators, valuation multiples, or scenario analysis to decide which companies, Tangible or intangible projects, or assets to invest in.

