




 texto en
 Inglés (pdf)
 Artículo en XML
 Referencias del artículo

 Traducción automática
 Enviar artículo por email
 Citado por SciELO
 Similares en
SciELO

 Permalink


Introduction
As the world's population increases, the pressure on natural resources grows. This implies an increase in deforestation, due to the opening of agricultural and urban areas (Chughtai et al., 2021); consequently, the intensive development of these activities has generated significant changes in land use (Leija-Loredo & Pavón, 2017). Land cover and land use change (LCLUC) have an impact on ecosystem fragmentation, extinction of local fauna and flora (Leija-Loredo & Pavón, 2017), food security, and soil and water degradation (Perović et al., 2018); therefore, understanding LCLUC dynamics allows for better planning, management, and conservation of ecosystems.
Geographic Information Systems (GIS) and Land Cover and Land Use Change (LCLUC) analysis techniques (Dixon & Uddameri, 2015) are valuable tools for detecting changes in land use. Land use maps, produced by the Instituto Nacional de Estadística y Geografía (INEGI) and integrated into GIS, allow for spatial comparisons of land use categories over time, enabling empirical estimates of conditional change probabilities (Partida-Sedas et al., 2017). LCLUC analysis can help to identify key drivers of change and explores the processes behind them, this by calculating change matrices and maps from an initial year to a final year (Chughtai et al., 2021). Additionally, LCLUC analysis highlights areas suitable for conservation initiatives, restoration efforts, and the implementation of sustainable management policies (Toledo-Aceves et al., 2022), including the establishment of voluntarily protected areas for ecosystem conservation and sustainable use (Ochoa-Ochoa et al., 2021).
Due to the lack of application of LCLUC techniques in the Otomí-Tepehua region, this study aimed to analyze land-use change dynamics at a micro-watershed scale over a full period (1993-2018) and two subintervals (A: 1993-2007 and B: 2007-2018). The hypothesis is that forest loss is driven by the expansion of agricultural activities. Analyzing at the micro-watershed level allows for the identification of specific actions for the conservation and management of natural resources (Pande, 2020).
Materials and Methods
The study micro-watershed, covering an area of 151.60 km², is located between 20° 26' - 20° 18' N and 98° 07' - 98° 18' W (Figure 1), in the northeastern part of the state of Hidalgo, within the Otomí-Tepehua region. It is bounded by the municipalities of Tenango de Doria (48.78 %), San Bartolo Tutotepec (46.21 %), and Huehuetla (5.01 %). The micro-watershed is part of the Tuxpan river hydrological watershed (RH27D) and falls within the Pantepec river sub-watershed (RH27Dd) (INEGI, 2021). The study area was delineated using the Watershed Water Flow Simulator (SIATL in Spanish) version 2.0, which is based on INEGI's 1:50 000 scale hydrographic network (INEGI, 2021).
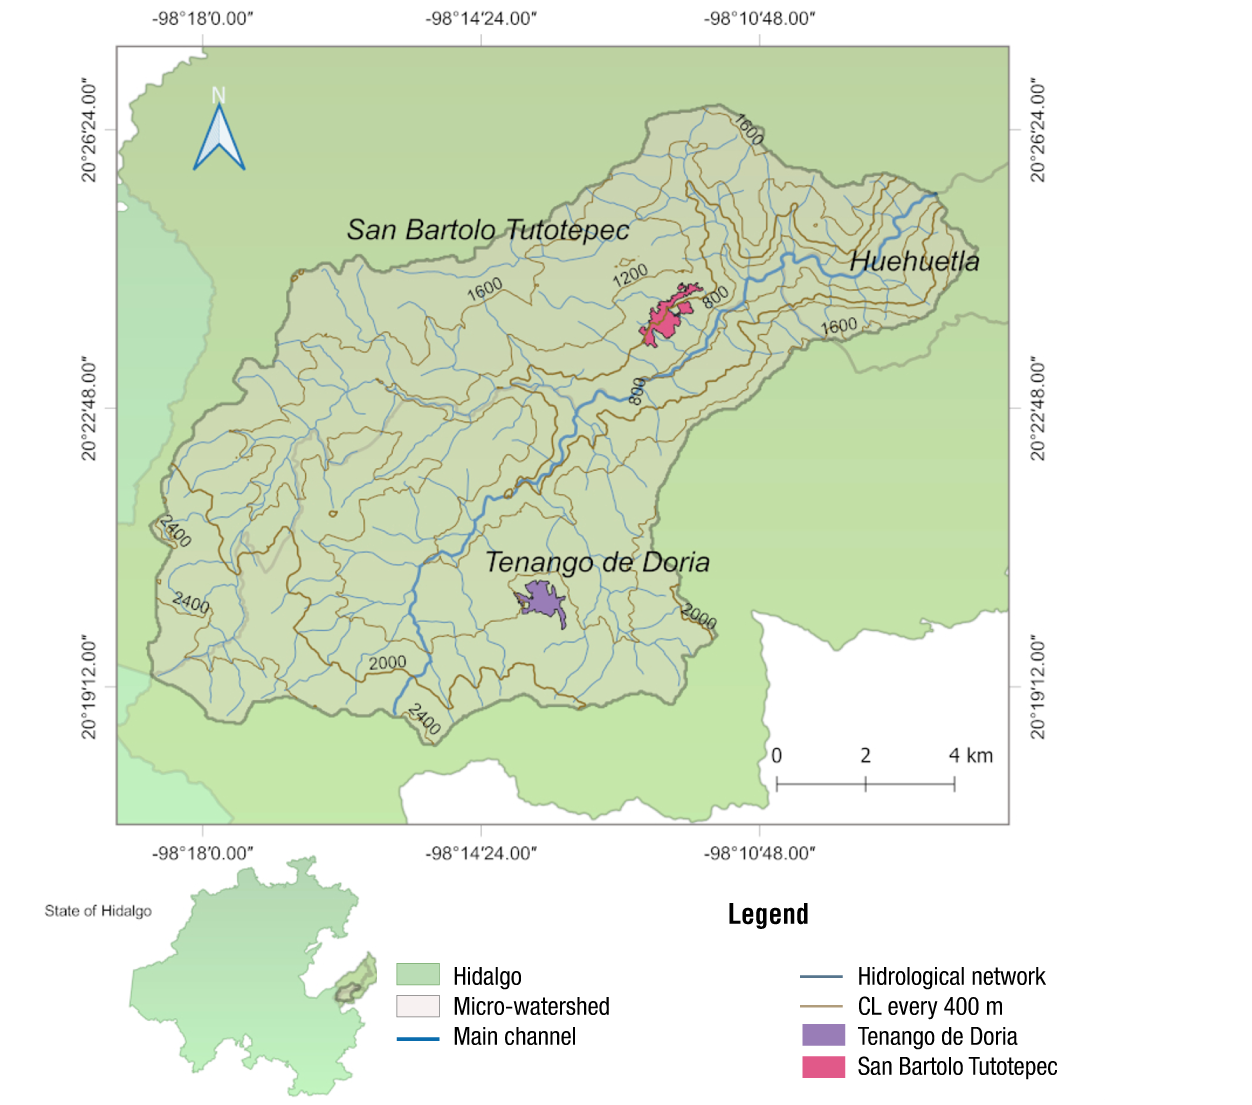
Figure 1 Micro-watershed of the Pantepec river, Hidalgo, Mexico. Compiled by the authors with data from INEGI (2021). CL: Contour lines.
The micro-watershed is located at elevations of 600 to 2 600 m with rainfall of 1 200 to 2 000 mm and temperatures of 12 to 18 °C. The predominant climates are cold C(E)(m), humid temperate C(m) and C(fm), and humid semihumid (A)C(fm) (INEGI, 2006, 2007). The topography corresponds to high mountains with steep slopes (99.97 %) located in the Sierra Madre Oriental (INEGI, 2001a). The predominant vegetation types are coniferous forest, cloud forest and evergreen rainforest that interact with agricultural, grassland and urban areas (INEGI, 2018).
Vector data for the LCLUC analysis were obtained from series II (1993), IV (2007) and VII (2018); the scale of all cartographic sources was 1:250 000 (INEGI, 2001b, 2009, 2018). Because series II and IV show no urban area, the urban area was delimited with historical images from Google Earth Pro (https://www.google.com/intl/es/earth/about/versions/). In QGIS 2.18.10 (QGIS.org, 2019) an unsupervised classification was made to homologize the vegetation types of the three INEGI series, from which seven categories were obtained: cultivated grassland, rainfed agriculture, pine forest, cloud forest (CF), evergreen rainforest (ER), induced grassland and urban area (Figure 2). In series VII, the vegetation cover of pine-oak forest (PQF) was identified, which spatially corresponds to the same polygon labeled as coniferous forest in series IV, so it was considered within the pine forest category. This was done to avoid discrepancies between labels and to make a minimum adaptation to INEGI cartography for the unsupervised classification.
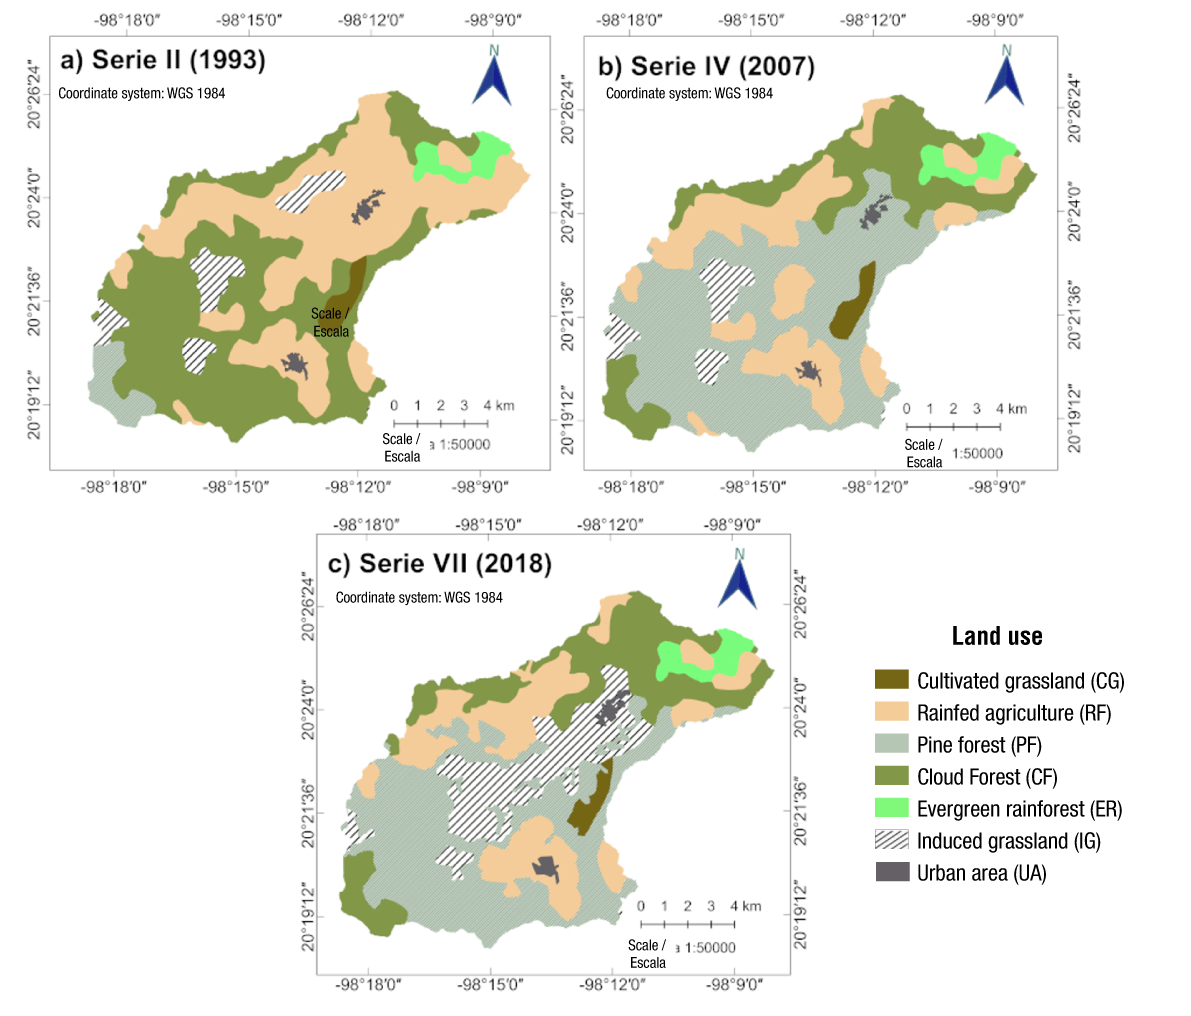
Figure 2 Land use classification in the Pantepec river micro-watershed, Hidalgo. Compiled by the author using data from INEGI (2001b, 2009, 2018).
The vector data overlay was carried out with QGIS 2.18.10 (QGIS.org, 2019), where the change of polygon classification from CF series II to pine forest in series IV was highlighted (Figure 2). To eliminate the possibility that these changes were driven by conversion to forestry production, data from the statistical and geographic yearbook of Hidalgo (INEGI, 2017) and the 2011 reforestation records from the Comisión Nacional Forestal (CONAFOR, 2011) were analyzed.
Acquisition of maps in Raster Format and execution of MOLUSCE
In QGIS 2.18.10, the land cover and land use maps from INEGI (shapefiles) were categorized and projected to the geographic coordinate system WGS84 UTM zone 14N. Subsequently, they were converted to raster format with a spatial resolution of 30 m. Due to the pixel size of the raster map, a difference of 0.05 % in the total area of rainfed agriculture and CF was identified in subintervals A and B (year 2007), and a difference of 0.07 % for pine forest. In the total interval compared to subinterval B, there were differences of 0.05 % and 0.12 % for pine forest and CF, respectively.
In the LCLUC analysis, MOLUSCE (Modules for Land Use Change Evaluation) from QGIS 2.18.10 was used, a tool that calculates the area and percentage of changes while identifying their locations. Using the cross-tabulation module, MOLUSCE estimates transition statistics by quantifying how many pixels changed from an initial year to a final year. The algorithmic area analysis module then computes the change map in raster format for each period, assigning an integer value to each pixel that indicates its transition (Asia Air Survey & NextGIS, 2013; GISLAB, 2014).
Dynamics of Land Cover and Land Use Change
MOLUSCE facilitated the calculation of the change matrix using the general matrix (Table 1), where each notation P ij represents the proportion of the area transitioning from category i to category j and the diagonal shows the persistence of the categories j (P jj ). The total of the columns P i+ provides the proportion or total area of category i in year one (the sum of the values j of P ij ), while the total of the rows P +j , represents the sum of all i of P ij for year two (Gutiérrez et al., 2016; Pontius et al., 2004).
The exchange (Int) between categories, gain (G j ), loss (L i ), total change (C t ) and net change (C n ) were calculated using the following equations:
Table 1 General matrix for analyzing the dynamics of land cover and land use change, adapted from Pontius et al. (2004).
| Year 2 | Total 1 | |||||
|---|---|---|---|---|---|---|
| Cat1 | Cat2 | Cat3 | Cat4 | |||
| Year 1 | Cat1 | P11 | P12 | P13 | P1j | P1+ |
| Cat2 | P21 | P22 | P23 | P2j | P2+ | |
| Cat3 | P31 | P32 | P33 | P3j | P3+ | |
| Cat4 | Pi1 | Pi2 | Pi3 | Pij | Pi+ | |
| Total 2 | P+1 | P+2 | P+3 | P+j | 1 | |
P +j = total area of category j in year two; P jj = persistence; P i+ = Total area of category i for year one.
Rate of change estimation
For each analysis interval, the rate of change was calculated using the equation defined by the FAO (Food and Agriculture Organization, 1996):
where,
Fc = area (ha) for the initial year (Fc 1 ) and final year (Fc 2 )
t = duration of the period under evaluation.
Results
General behavior of land use in the micro-watershed
The micro-watershed is dominated by cloud forest, rainfed agriculture and pine forest (Table 2). The presence of the seven vegetation type categories has been dynamic in each period: in 1993, the CF represented 45.79 %; in 2007, 19.79 %; and in 2018, 20.24 %. Rainfed agriculture has been another of the land covers dominating the landscape with 39.34 % in 1993, and 23.58 and 21.55 % in the last two years of analysis. The vegetation covers that increased in area from 1993 to 2018 were induced grassland from 6.04 % to 15.17 %, and pine forest from 3.39 % to 37.60 %. Moreover, cultivated grassland, ER and urban area showed no significant changes (Table 2).
Table 2 Land use and land cover per category (1993-2018) in a micro-watershed of the Pantepec river, Hidalgo, Mexico.
| Category | 1993 | 2007 | 2018 | |||
|---|---|---|---|---|---|---|
| ha | % | ha | % | ha | % | |
| Cultivated grassland | 272.88 | 1.80 | 272.61 | 1.80 | 235.89 | 1.56 |
| Rainfed agriculture | 5 964.75 | 39.34 | 3 575.34 | 23.58 | 3 267.09 | 21.55 |
| Pine forest | 513.81 | 3.39 | 7 098.39 | 46.83 | 5 706.81 | 37.60 |
| Cloud forest | 6 941.43 | 45.79 | 3 000.6 | 19.79 | 3 069.72 | 20.24 |
| Evergreen rainforest | 427.68 | 2.82 | 429.66 | 2.83 | 429.66 | 2.83 |
| Induced grassland | 916.20 | 6.04 | 660.15 | 4.35 | 2 300.49 | 15.17 |
| Urban area | 123.75 | 0.82 | 123.75 | 0.82 | 158.85 | 1.05 |
Dynamics of land cover and land use change
The dynamics of change from 1993 to 2018 were evaluated with a general matrix shown in Table 3. The highest rate of change corresponded to pine forest with 10.10 %, starting in 1993 with 513.81 ha and ending with 5 700.24 ha; the highest contribution in this change was identified from CF with 5 029.56 ha. The following change rates present values of 3.75 % for induced grassland, going from 916.20 to 2 300.49 ha; where the main contributions were rainfed agriculture (1 371.78 ha) and CF (465.30 ha). The other outstanding value corresponds to a loss rate of -3.21 % for CF, which started in 1993 with 6 941.43 ha and ended with 3 068.28 ha. The vegetation covers cultivated grassland, ER, and the urban area are the ones with the lowest rates of change, both positive and negative (Table 3).
Table 3 Matrix of change per category (1993-2018) in a micro-watershed of the Pantepec river, Hidalgo, Mexico.
| Category | 2018 | Total 1 (ha) | Rate of change (%) | |||||||
|---|---|---|---|---|---|---|---|---|---|---|
| CG | RA | PF | CF | ER | IG | UA | ||||
| 1993 | CG | 228.87 | 0.00 | 44.01 | 0.00 | 0.00 | 0.00 | 0.00 | 272.88 | -0.58 |
| RA | 0.90 | 2 565.45 | 422.28 | 1 561.23 | 6.21 | 1 371.78 | 36.90 | 5 964.75 | -2.38 | |
| PF | 0.00 | 0.00 | 11.61 | 502.20 | 0.00 | 0.00 | 0.00 | 513.81 | 10.10 | |
| CF | 6.12 | 438.39 | 5 029.56 | 995.67 | 6.39 | 465.30 | 0.00 | 6 941.43 | -3.21 | |
| ER | 0.00 | 7.83 | 0.00 | 2.79 | 417.06 | 0.00 | 0.00 | 427.68 | 0.02 | |
| IG | 0.00 | 255.42 | 192.78 | 6.39 | 0.00 | 461.61 | 0.00 | 916.20 | 3.75 | |
| UA | 0.00 | 0.00 | 0.00 | 0.00 | 0.00 | 1.80 | 121.95 | 123.75 | 1.00 | |
| Total 2 (ha) | 235.89 | 3 267.09 | 5 700.24 | 3 068.28 | 429.66 | 2 300.49 | 158.85 | 15 160.50 | ||
Cultivated grassland (CG), rainfed agriculture (RA), pine forest (PF), cloud forest (CF), evergreen rainforest (ER), induced grassland (IG) and urban area (UA).
Table 4 indicates that, over a span of 25 years, the categories with more loss than gain were cultivated grassland, rainfed agriculture, and cloud forest. The largest total change of 8 018.37 ha corresponded to CF with a loss (85.70 %) greater than the gain (29.90 %) (Figure 3a). Conversely, the vegetation types with more gain than loss were pine forest and induced grassland, where total change was mostly defined by the gains (5 688.63 ha and 1 838.88 ha, respectively). From 1993 to 2018, the area of induced grassland increased by 1 384.29 ha with an exchange of 909.18 ha, which was lower than the gains (1 838.88 ha). The vegetation types with the smallest losses were ER (2.48 %), with an exchange greater than both losses and gains, and the urban zone (1.50 %), which had a net change similar to the gains (Figure 3a).
Table 4 Dynamics of changes (1993-2018) of land use categories in a micro-watershed of the Pantepec river, Hidalgo, México.
| Category | Loss (ha) | Gain (ha) | Net change (ha) | Exchange (ha) | Total change | Rate of change (%) |
|---|---|---|---|---|---|---|
| Cultivated grassland | 44.01 | 7.02 | 36.99 | 14.04 | 51.03 | -0.58 |
| Rainfed agriculture | 3 399.30 | 701.64 | 2 697.66 | 1 403.28 | 4 100.94 | -2.38 |
| Pine forest | 502.20 | 5 688.63 | 5 186.43 | 1 004.40 | 6 190.83 | 10.10 |
| Cloud forest | 5 945.76 | 2 072.61 | 3 873.15 | 4 145.22 | 8 018.37 | -3.21 |
| Evergreen rainforest | 10.62 | 12.60 | 1.98 | 21.24 | 23.22 | 0.02 |
| Induced grassland | 454.59 | 1 838.88 | 1 384.29 | 909.18 | 2 293.47 | 3.75 |
| Urban area | 1.80 | 36.90 | 35.10 | 3.60 | 38.70 | 1.00 |
According to Table 5, in subinterval A (1993 to 2007), the vegetation types with the highest negative rate of change were CF (-5.81 %), rainfed agriculture (-3.59 %), and induced grassland (-2.31 %), indicating considerably higher losses than gains; in contrast, pine forest had higher gains (1 379.30 %) than losses (97.80 %). On the other hand, the loss and gain areas of cultivated pasture, ER, and urban area were similar and had rates of change either of zero or very close to this value (Figure 3b).
Table 5 Dynamics of changes (1993-2007) of land use categories in a micro-watershed of the Pantepec river, Hidalgo, Mexico.
| Category | Loss (ha) | Gain (ha) | Net change (ha) | Exchange (ha) | Total change (ha) | Rate of change (%) |
|---|---|---|---|---|---|---|
| Cultivated grassland | 10.80 | 10.53 | 0.27 | 21.06 | 21.33 | -0.01 |
| Rainfed agriculture | 2 723.76 | 334.35 | 2 389.41 | 668.70 | 3 058.11 | -3.59 |
| Pine forest | 502.38 | 7 086.96 | 6 584.58 | 1 004.76 | 7 589.34 | 20.63 |
| Cloud forest | 5 896.98 | 1 956.15 | 3 940.83 | 3 912.30 | 7 853.13 | -5.81 |
| Evergreen rainforest | 10.62 | 12.60 | 1.98 | 21.24 | 23.22 | 0.03 |
| Induced grassland | 281.52 | 25.47 | 256.05 | 50.94 | 306.99 | -2.31 |
| Urban area | 0.00 | 0.00 | 0.00 | 0.00 | 0.00 | 0.00 |
Finally, Table 6 indicates that induced grassland was the category with the highest gain (278.10 %) and positive rate of change (12.02 %) from 2007 to 2018. The gains of 1 835.91 ha and losses of 195.57 ha represent for this category a total change of 2 031.48 ha (Figure 3c). The vegetation types with a greater loss than gain were pine forest, cultivated grassland and rainfed agriculture with negative rates of change (-1.97, -1.31 and -0.82 % respectively). Similarly, the categories with greater gain than loss were induced grassland (12.02 %), urban area (2.30 %) and CF (0.20 %). In this period, the ER showed no changes in cover area (Figure 3c).
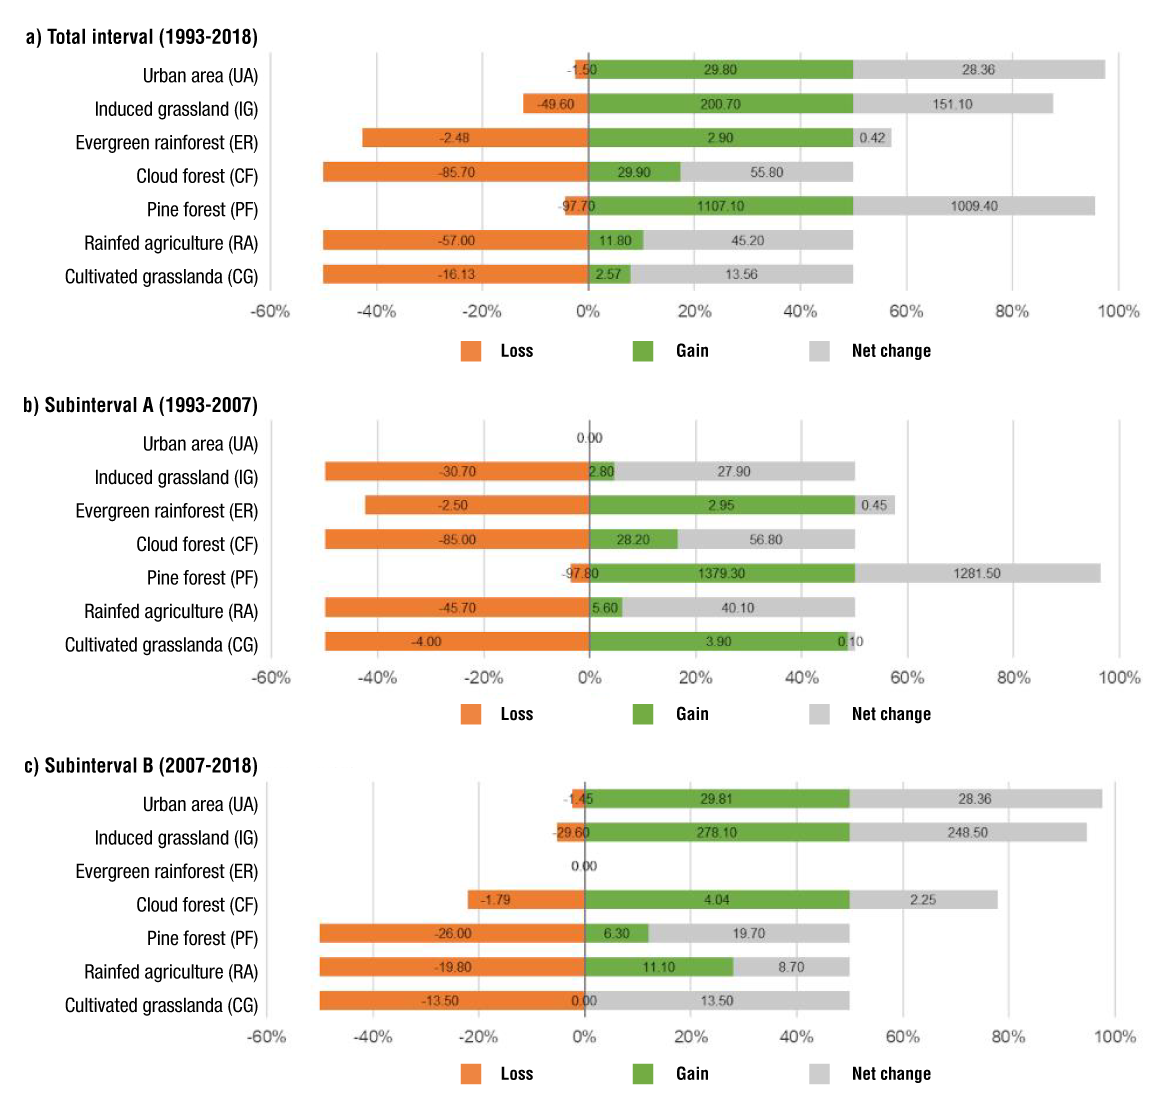
Figure 3 Dynamics of land use category changes in a micro-watershed of the Pantepec river, Hidalgo, Mexico.
Table 6 Dynamics of changes (2007-2018) of land use categories in a micro-watershed of the Pantepec river, Hidalgo, Mexico.
| Category | Loss(ha) | Gain (ha) | Net change (ha) | Exchange (ha) | Total change (ha) | Rate of change (%) |
|---|---|---|---|---|---|---|
| Cultivated grassland | 36.72 | 0.00 | 36.72 | 0.00 | 36.72 | -1.31 |
| Rainfed agriculture | 707.22 | 397.44 | 309.78 | 794.88 | 1 104.66 | -0.82 |
| Pine forest | 1 844.10 | 447.48 | 1 396.62 | 894.96 | 2 291.58 | -1.97 |
| Cloud forest | 53.64 | 121.32 | 67.68 | 107.28 | 174.96 | 0.20 |
| Evergreen rainforest | 0.00 | 0.00 | 0.00 | 0.00 | 0.00 | 0.00 |
| Induced grassland | 195.57 | 1 835.91 | 1 640.34 | 391.14 | 2 031.48 | 12.02 |
| Urban area | 1.80 | 36.90 | 35.10 | 3.60 | 38.70 | 2.30 |
Land use change and vegetation cover maps
The spatial distribution of LCLUC represented in Figure 4 facilitated to identify that, from 1993 to 2018, rainfed agriculture and CF had important transitions with induced grassland in the middle part of the micro-watershed; other relevant transitions were those of pine forest and CF to the south of the area. In the total interval, induced grassland, rainfed agriculture, cloud forest and pine forest had the lowest persistence values: 50.40 %, 43.01 %, 14.30 % and 2.30 %, respectively. Among these categories, rainfed agriculture, CF, and induced pastureland experienced the highest number of transitions. The CF area primarily interacts with pine forest, induced grassland, and rainfed agriculture.
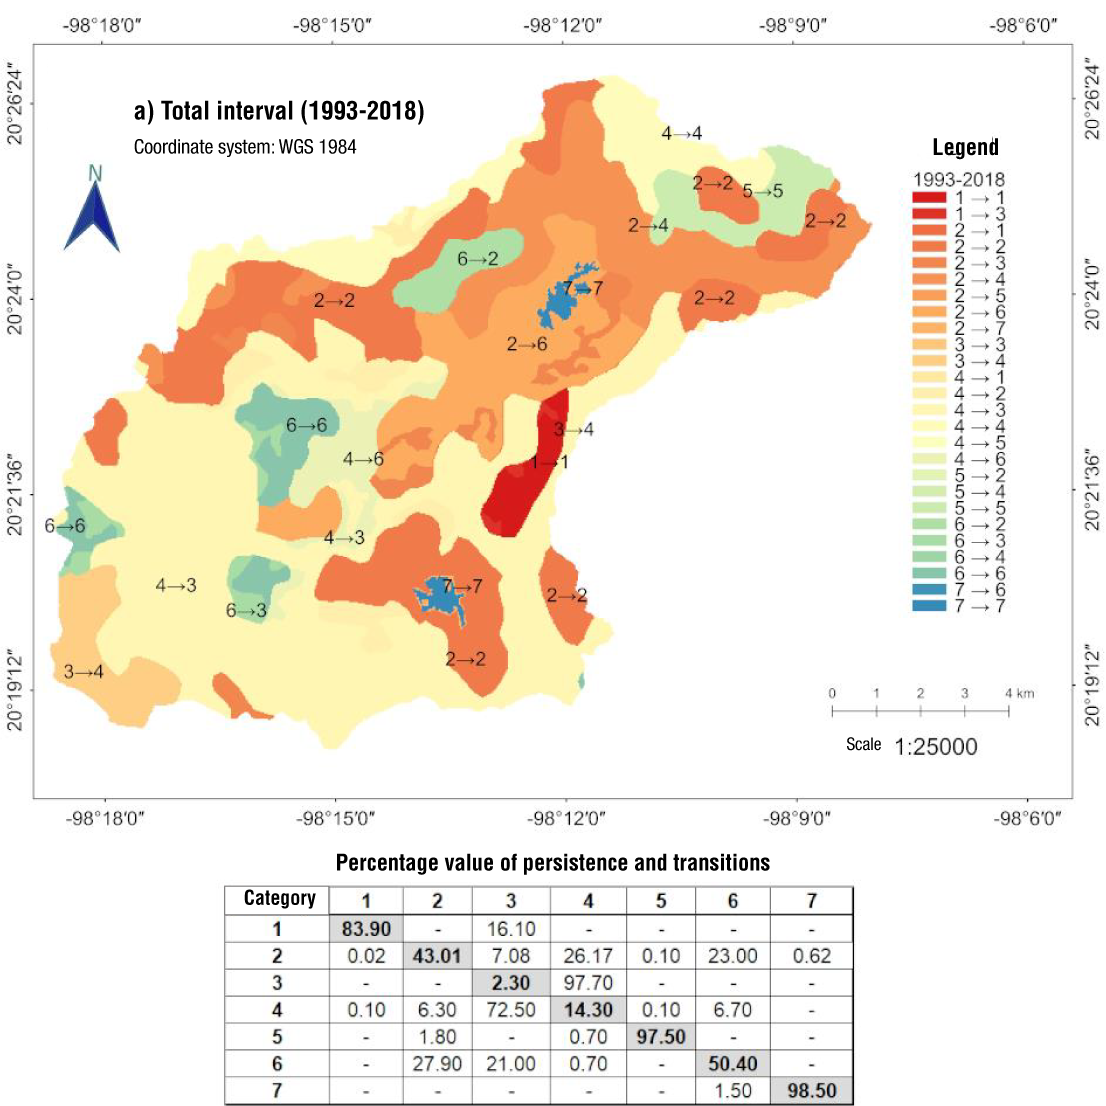
Figure 4 Map of change and percentage value of persistence and transitions for the period (1993-2018) in a micro-watershed of the Pantepec river, Hidalgo, Mexico. Categories: 1. Cultivated grassland, 2. Rainfed agriculture, 3. Pine forest, 4. Cloud forest, 5. Evergreen rainforest, 6. Induced grassland and 7. Urban area.
In subinterval A there were transitions from CF and rainfed agriculture with pine forest from the south to the middle part of the micro-watershed. These categories together with induced grassland had the highest dynamism, as well as the lowest percentage value of persistence (pine forest 2.22 %, CF 15 %, rainfed agriculture 54.34 % and induced grassland 69.27 %) (Figure 5). For subinterval B, the conversion of vegetation cover from pine forest and rainfed agriculture to induced grassland was observed in the middle part of the micro-watershed; therefore, the percentage values of persistence with the same land use lower than 80 % were observed in pine forest and induced grassland (Figure 6).
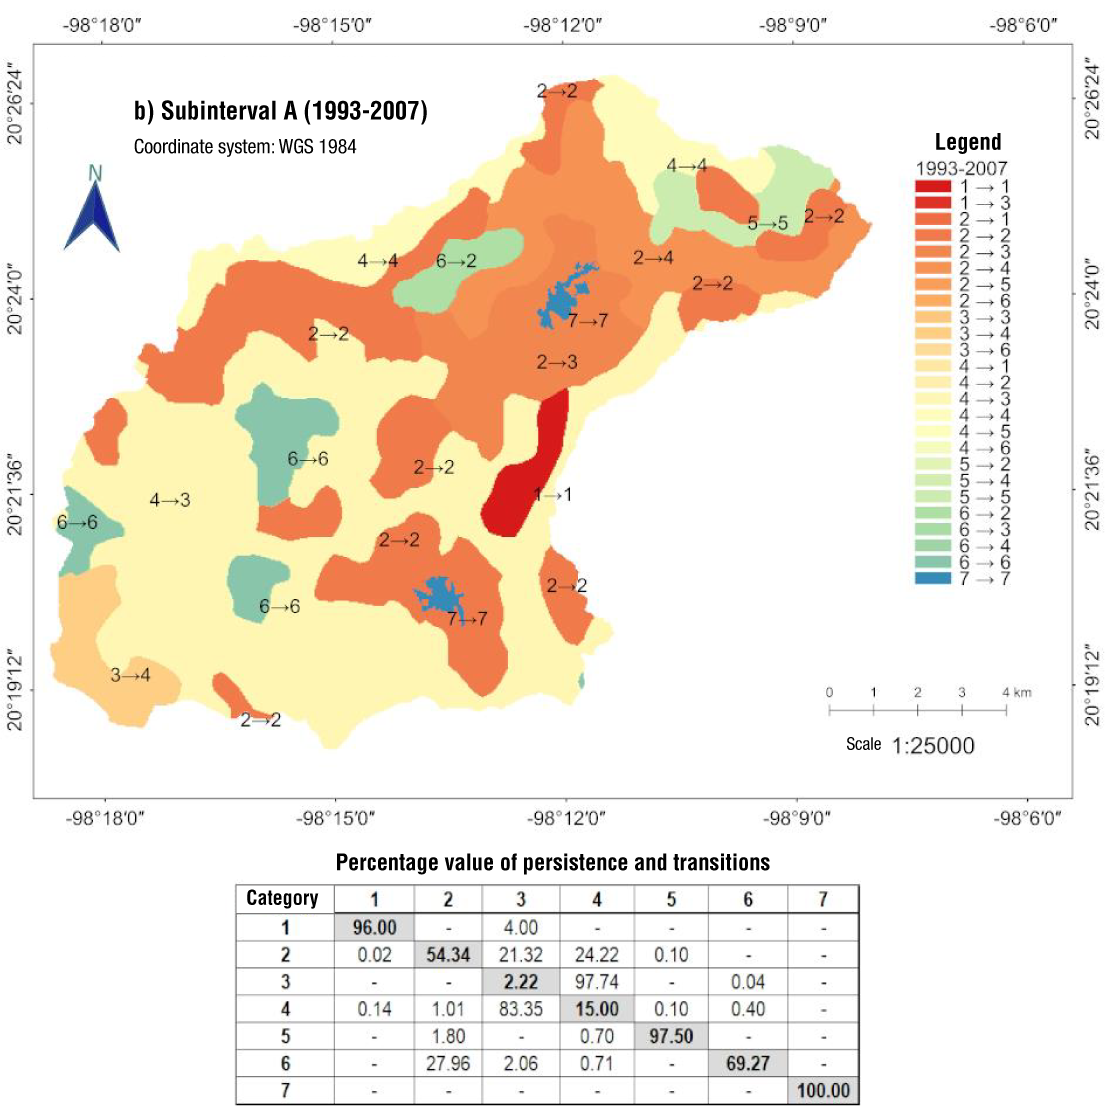
Figure 5 Map of change and percentage value of persistence and transitions for the period 1993-2007 in a micro-watershed of the Pantepec river, Hidalgo, Mexico. Categories: 1. Cultivated grassland, 2. Rainfed agriculture, 3. Pine forest, 4. Cloud forest, 5. Evergreen rainforest, 6. Induced grassland and 7. Urban area.
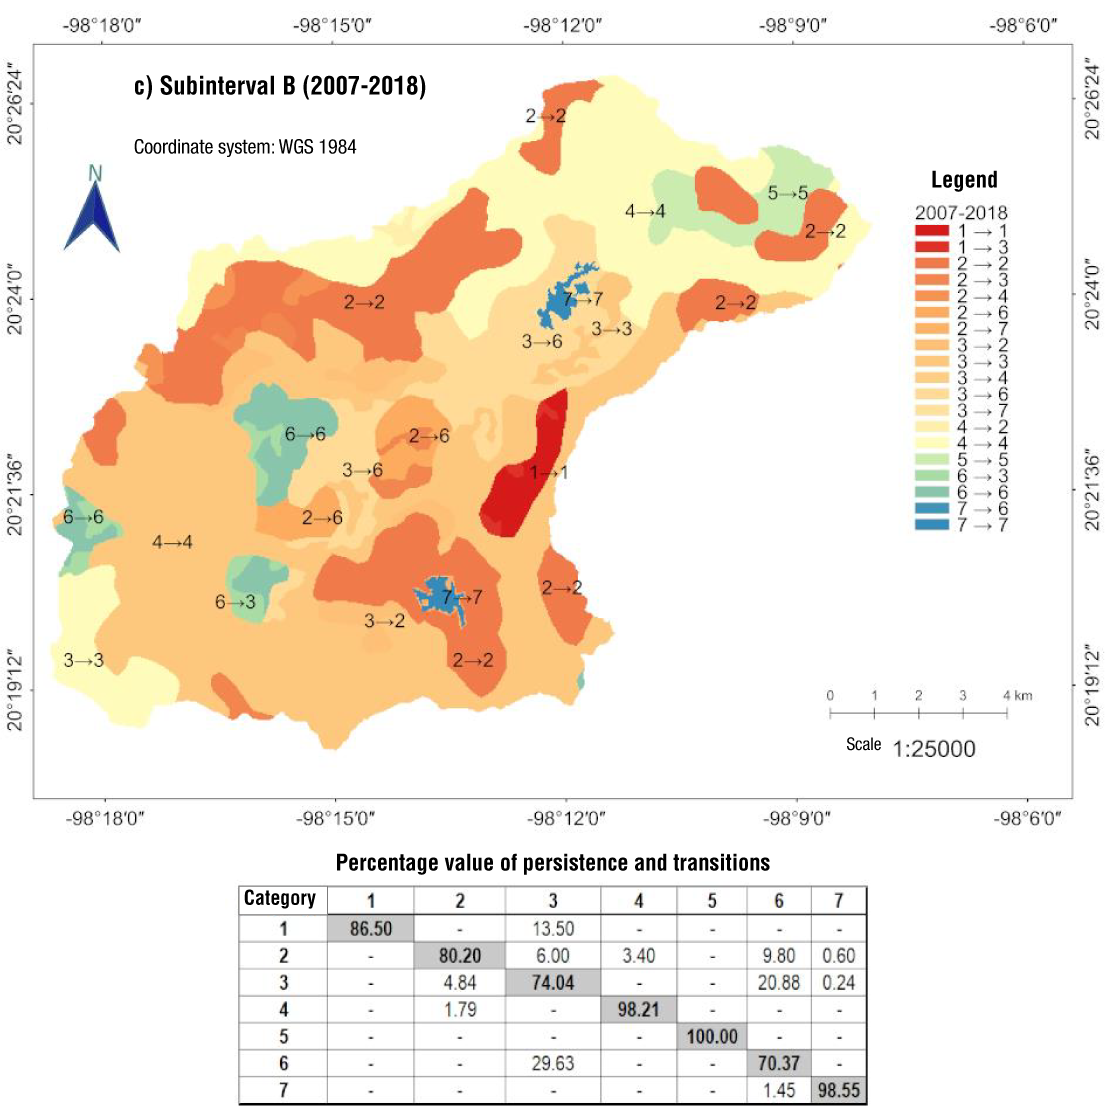
Figure 6 Map of change and percentage value of persistence and transitions for the period 2007-2018 in a micro-watershed of the Pantepec river, Hidalgo, Mexico. Categories: 1. Cultivated grassland, 2. Rainfed agriculture, 3. Pine forest, 4. Cloud forest, 5. Evergreen rainforest, 6. Induced grassland and 7. Urban area.
Discussion
General land use behavior in the micro-watershed
The analysis of LCLUC indicates that, in the 25 years of analysis, the areas of CF and pine forest were affected by rainfed agriculture and induced grassland. The decrease in rainfed agriculture and increase in induced grassland in the middle micro-watershed after 2007 (Figure 6) might have been driven by the opening of areas for grazing, responding to the need for forage in livestock production. Only for San Bartolo Tutotepec, beef production increased by 96.12 % from 2003 to 2014 (INEGI, 2004, 2017). Additionally, the reduction of natural cover in this municipality was identified by Leija et al. (2021), who reported that forage production was the main cause of a 36.40 % loss of forest cover over 29 years in a polygon of 8 052.00 ha. This confirms the effects on forests due to conversion to forage production, even though the micro-watershed only covers 46.21 % of the municipality of San Bartolo Tutotepec, highlighting the change in land use from forest to induced grassland as a potential threat. This situation involves, according to the intensive management of the induced grassland, impacts on biodiversity and the ecosystem services provided by the pine forest and CF. Consequently, the results demonstrate the vulnerability of forest vegetation cover in the micro-watershed due to land-use changes to agricultural activities.
A change of polygons from CF to pine forest (series II to IV) and later to PQF (categorized as pine forest for this analysis) in series VII (Figure 2) was identified during the homologation of the land use categories from the INEGI cartography, which is attributed to a change in the classification methodology by INEGI. This change could have been due to the generalization of the land use type, because the northeast of the micro-watershed is located in the municipality of Agua Blanca de Iturbide, which is among the top four timber producers of the state (INEGI, 2004, 2017). The total timber production volume of 17 222 m3 log (year 2016) for this municipality compared to the figures for San Bartolo Tutotepec and Tenango de Doria, with timber production of 4 002 and 383 m3 log, respectively, allows pointing out that forest land use is lower in the micro-watershed (INEGI, 2017). Furthermore, a major reforestation effort that could have caused the transition from CF to pine forest is ruled out, since by 2011 only 299 ha were reforested in the municipalities of San Bartolo Tutotepec and Tenango de Doria (CONAFOR, 2011). Therefore, due to changes in the recategorization of forest polygons in the INEGI cartography, there is no evidence of the 1 107.10 % gain for the pine forest category.
Furthermore, before 2007, the sparse coverage of pine forest in the micro-watershed was verified with the vegetation type map of the Otomí-Tepehua region by Villavicencio and Pérez (2005) with data from 2004. In QGIS 2.18.10, this map was overlaid with the micro-watershed under study, and it was identified that 30 % of the area was covered by CF, 5 % by PQF, and 2 % by pine forest to the south of the micro-watershed. This highlights the lack of pine forest and PQF coverage and the greater existence of CF in the study area. In light of the points outlined in this section, it is important to consider that the reliability of INEGI's cartography for identifying vegetation cover should be assessed using detailed reference information for the year of analysis, along with field verification for more recent dates.
Spatial dynamics and location of land cover and land use changes
Between 1993 and 2018, rainfed agriculture and induced grassland were identified as the most unstable anthropogenic activities (Figure 4), with the lowest persistence rates (43.01 % and 50.40 %, respectively). In this context, aside from forest cover, induced grassland showed the largest increase (200.70 %) with a change rate of 3.75 %, while rainfed agriculture had the greatest decline (57 %) with a negative change rate of -2.38 % over the 25-year period (Table 3; Figure 3a). These changes led to the conversion of 1 838.88 ha of rainfed agriculture, cloud forest, and urban areas into induced grassland in the middle micro-watershed, while 701.64 ha of CF, ER, and induced grassland changed into rainfed agriculture from the mid to lower micro-watershed (Figure 4).
The expansion of rainfed agriculture and induced grassland in forested areas in the middle part of the micro-watershed was also observed in sub-intervals A and B. Although in subinterval B, induced grassland gained importance over rainfed agriculture and showed the lowest percentage value of persistence (70.37 %) (Figure 6), the LCLUC dynamics indicate that the highest conversions with forest occurred during subinterval A, where rainfed agriculture and induced grassland persisted 54.34 and 69.27 %, respectively (Figure 5).
When considering the total forest area without differentiating between CF and pine forest, annual rates of change of 0.03, 0.16 and -0.12 % were calculated for the total interval (1993-2018) and subintervals A (1993-2007) and B (2007-2018), respectively. The annual rate of change for subinterval B (-0.12 %) is higher than that reported for the forest category in the Huasteca region (-0.04 %; Leija-Loredo & Pavón, 2017) and west-central Veracruz (-0.01 %; Partida-Sedas et al., 2017), as well as that estimated at the national level (-0.01 %; FAO, 2021). The annual rate of change of 0.06 % reported for forest in the middle zone of San Luis Potosí (Miranda-Aragón et al., 2013) is higher than that obtained in the micro-watershed for the total interval (0.03 %) and lower than that of subinterval A (0.16 %). Regarding this, several authors agree that the main drivers of LCLUC are the opening of agricultural and grazing areas (grassland), coupled with urban growth (Badillo-Saldaña et al., 2016; Cao et al., 2020; Chughtai et al., 2021). Consequently, the adverse conditions generated by these drivers of change reduce the population of flora and fauna. This decline is related to intensive management that directly influences the quantity and quality of the available resources (Badillo-Saldaña et al., 2016; Cao et al., 2020).
The above suggests that the threshold of anthropogenic disturbance that ecosystems support depends on the degree of intensity of agricultural activities (Vite et al., 2013). In the case of CF, changes in natural vegetation cover will reduce biodiversity and the quality of ecosystem services (Jiménez & Peterson, 2019). Regarding the Otomí-Tepehua region, the effects of LCLUC on CF have been pointed out by Castelán-Lorenzo and Navarrete-González (2022), who proposed that a 2 °C increase in temperature would generate a shift in the moisture condensation zone, which could lead to the disappearance of species. In this regard, the LCLUC in the micro-watershed represents a threat to the continuity of endangered endemic species, such as the Mexican beech (Fagus grandifolia subsp. mexicana) and the Veracruz quail (Dendrortyx barbatus) (Secretaría de Medio Ambiente y Recursos Naturales [SEMARNAT], 2010). The above highlights that in the upper and lower parts of the micro-watershed, there are areas susceptible to conservation and protection initiatives with cloud forest and evergreen rainforest, sites that are included in the state ecological land-use planning as conservation zones (Poder Ejecutivo, 2022). This suggests the possibility of implementing conservation and species protection areas for sustainable management that aligns with municipal and local regulations, such as the municipal protected natural area of CF called "Medio Monte", which encompasses 156.63 ha in San Bartolo Tutotepec (SEMARNAT, 2020).
The potential of LCLUC analysis, using an unsupervised classification approach along with INEGI's land use cartography and the MOLUSCE tool, lies in obtaining an initial approximation to identify the main drivers of change affecting natural cover. It also facilitates the spatial visualization of regions where LCLUC is reduced. However, these analyses still pose several challenges related to data source uncertainty, methodologies, and the complexity of environmental evolution (Feng et al., 2023). Therefore, for the micro-watershed under study, historical research using satellite images and field verification of recent vegetation cover types is required to enhance the LCLUC analysis.
Conclusions
Over the 25 years of analysis, the dynamics of land cover and land use change (LCLUC) reflect the significance of agricultural activities, which cover 38.28 % of the micro-watershed, resulting in impacts on forest cover (57.84 %). The proposed hypothesis is validated, as agricultural activities represent the most significant anthropogenic influence affecting natural cover due to the opening of areas for grazing and rainfed agriculture, mainly near San Bartolo Tutotepec. The most substantial conversions occurred in the first decade (1993-2007), even though during subinterval B (2007-2018), induced grassland experienced the largest gain (278.10 %). It is recommended to implement reforestation and conservation programs for cloud forest, focusing on areas at high risk of LCLUC, and to promote sustainable agricultural and livestock practices that mitigate environmental impact and foster the recovery of ecosystem services.

