texto en
  Inglés (pdf)
 Artículo en XML
 Referencias del artículo
 Enviar artículo por email
 Citado por SciELO
  Similares en
SciELO
Similares en
SciELO 
 Permalink
Introduction
Natural Protected Areas (NPA) are a policy instrument aimed at promoting biodiversity conservation and ecosystem services (Jiménez et al., 2014; Miranda et al., 2016; Tesfaw et al., 2018). Currently, over 15 % of the Earth's surface is under some form of protection, and there is an ongoing effort to increase this land cover (Shah et al., 2021). Studies in many countries have demonstrated that the establishment of PNA has led to a decrease in deforestation processes (Andam et al., 2008; Blankespoor et al., 2017). According to the Comisión Nacional de Áreas Naturales Protegidas (CONANP, 2024), Mexico has 226 PNA covering 93 807 804 ha, of which 23 013 380 ha correspond to land area, representing 11.71 % of the national land area.
Although Mexico has prioritized its natural protected areas (NPA), this has not been consistently reflected in the allocation of budgets for their management. For example, in the period 2012-2018 there was a largest increase in PNA (71.8 % of the current surface area) in history, but the allocated budget was reduced by approximately 7.7 % adjusted for inflation (CONANP, 2018; Errejón et al., 2019). Therefore, it is possible to deduce that insufficient funding is one of the factors that significantly influence limited conservation outcomes.
In Mexico, the effectiveness of natural protected areas (NPA) as a tool for stopping deforestation and conserving natural resources has been studied (Blackman et al., 2015; Figueroa et al., 2011). On the other hand, biological diversity and its importance associated with PNA, as well as changes in vegetation and land use, have also been studied (Ellis et al., 2017; Monjardín-Armenta et al., 2017; Neri-Suárez, 2018).
Changes in land use and vegetation within PNA are crucial for designing and implementing effective management and conservation plans (Von et al., 2020). However, some PNA in Mexico have not received sufficient attention, with limited research conducted in these areas. These NPAs include the Forest Protected Area of the rivers (San Ildefonso, Ñado, Aculco and Arrollo Zarco) in southern Querétaro (FPARSQ), located on the border with Estado de México, which was declared a protected area in 1941 (Secretaría de Agricultura y Fomento, 1941). The FPARSQ is significant in the region due to its irrigation works and aquifer recharge, which manifest as seasonal and permanent springs. Small streams flow through its ravines during the rainy season, which are stored in reservoirs to ensure the prosperity of local agriculture (Gutiérrez et al., 2015; Murillo & Orozco, 2016). Another notable feature of the area is the presence of dryland farming, specifically maize, a staple of the Hñahñu (Otomí) culture that resides there (Aguilar Sánchez & Lara Aguazul, 2021). Therefore, the objective of this study was to analyze the changes and trends in land use and vegetation in the FPARSQ for the periods 1997-2009 and 2009-2016, using geographic information systems (GIS) and fieldwork methodologies.
Materials and Methods
Study area
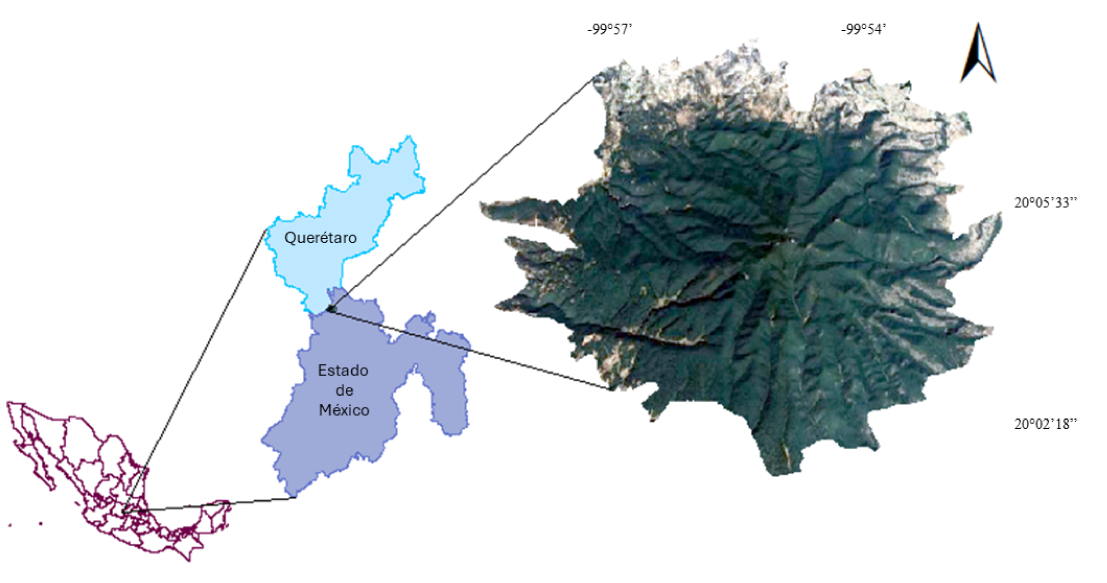
The study area is the FPARSQ, situated at the border of Estado de México and Querétaro, encompassing the municipalities of Amealco, Aculco, and Arroyo Zarco. It is bounded by coordinates 20° 6' 14.70" N - 99° 56' 13.79" W and is situated at an elevation of 2 622 meters (Google Earth, 2021; Figure 1). The nearest locality is San Ildefonso Tultepec, with a total population of 3 632 residents, of which 40 % belong to the Otomí indigenous group: 1 891 women (799 of whom speak an indigenous language) and 1 741 men (692 of whom speak an indigenous language) (Instituto Nacional de Estadística y Geografía [INEGI], 2020).
Cartography, Land Use, and vegetation types
Cartography and land use/vegetation data layers (LuV) from Mexico were used, including data from 1968-1986 (Series I) published in 1997, 2007-2008 (Series IV) published in 2009, and Series VI published in 2017 but with 2016 information. All series were used at a 1:250,000 scale. The data source for all series was the Comisión Nacional para el Conocimiento y uso de la Biodiversidad (CONABIO, 2021).
The study area, encompassing the FPARSQ, was delineated using Google Earth (kml format) and converted to vector shapefile format using ArcGIS v. 10.7.1 (ESRI, 2011). All subsequent processes were carried out using this GIS due to its practicality, consistent use, and broad acceptance in the country.
Estimating changes in land use and vegetation types
Based on the area of each land use (ha and %), extracted from the cartography, three maps for the years 1997, 2009, and 2016 were created. The study considered two periods: 1) 1997-2009 and 2) 2009-2016. The rate of change in land use was calculated using the following formula from the FAO (Food and Agriculture Organization of the United Nations, 1996):
where,
cr = change of rate (%)
a 1 = area at the initial date
S 2 = area at the final date
n = Difference in years between the initial and final dates.
For both periods, the corresponding maps were overlapped, and cross-tabulation value matrices were obtained as proposed by Pontius et al. (2004) (Appendix 1).
Classification of Land Use Changes
Land use and vegetation (LuV) changes were classified into four categories based on the criteria set by Palacio-Prieto et al. (2004) and the transition matrix (Appendix 2) (Pontius et al., 2004):
a) No Change: Areas where the land use remained the same in the final year as in the initial year, represented along the main diagonal.
b) Deforested or Degraded Forest Loss: The first category refers to changes from tree-based land uses (forests and rainforests) to cultivated areas, induced pastureland, and croplands. Degraded forest loss includes the loss of non-tree vegetation cover (such as other types of vegetation, hydrophytic vegetation, scrubland, and natural grasslands) due to conversion to induced and cultivated grasslands, crops, and other land covers.
c) Replacement Vegetation: Areas that were previously used for agricultural activities (such as croplands or induced and cultivated grasslands) and are now covered by forest, rainforest, scrubland, hydrophytic vegetation, or natural grasslands.
d) Productive Activity: Amount of area in land uses where productive human activities (induced pastureland or agriculture) are observed.
Trends in Land Use and Vegetation Changes
A discrete-time Markov chain is a sequence of random variable
Possible Causes of Land Use Changes
Field surveys were conducted to identify potential causes of land use changes in affected areas. Georeferenced control points from these sites were extracted and loaded onto a Garmin Etrex 30 GPS device. The data obtained from the cartography were then verified on-site.
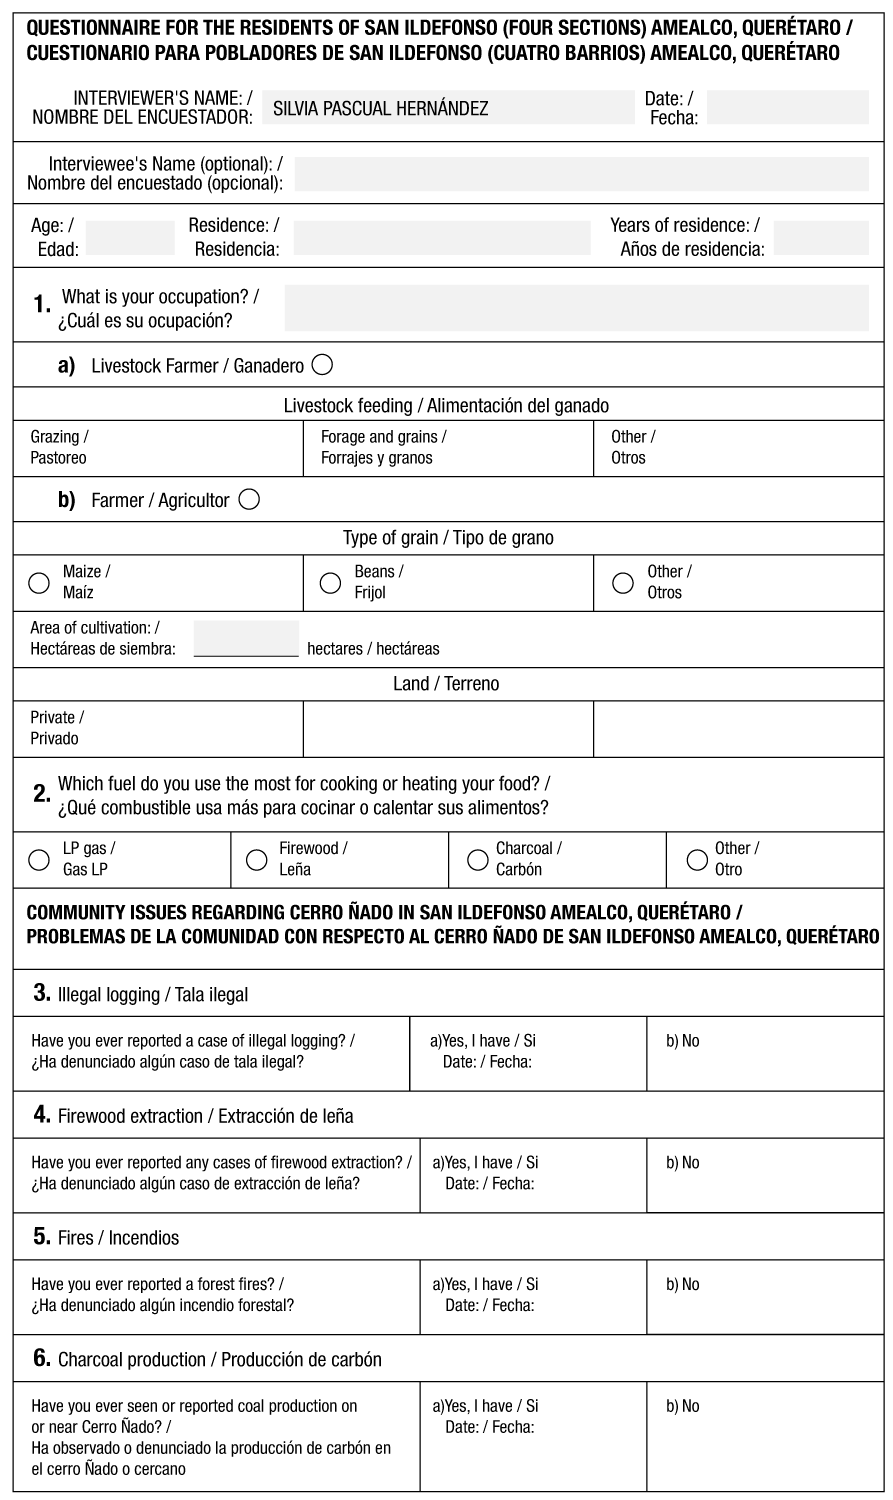
To identify socioeconomic factors as potential causes of these changes, a survey was designed, including closed-ended questions about productive activities related to forestry and other aspects of the population's perceptions (Appendix 3). The sample size for the application of the survey was determined with the following formula (León et al., 2016):
where,
n = sample size sought
N = population size
Z = statistical parameter depending on the confidence level (p = 0.05)
e = maximum accepted estimation error
p = probability of occurrence of the studied event (success)
q (1-p) = probability that the event studied will not happen.
According to the Population and Housing Census of INEGI (2020), the municipality of Amealco de Bonfil contains 46 localities, including San Ildefonso Tultepec, which has 10 neighborhoods totaling 864 households. Nearby localities affected by the sites include San Ildefonso Centro, Cuisillo, Xajay (Texquedo, Llano Largo), and Bothe, which collectively comprise 125 households. Based on the calculated sample size, 94 surveys were applied.
Additionally, data from the Comisión Nacional Forestal (CONAFOR, 2020) were reviewed, and a literature review of forest fires in the FPARSQ from 2009 to 2016 was conducted.
Results and Discussion
Land use, changes and trends in the period 1997-2009
At the beginning of the studied period, in 1997, the following land uses and vegetation types were identified: oak forest, oak-pine forest, pine-oak forest, agricultural use, secondary shrubby vegetation of pine-oak forest, induced pastureland, secondary shrubby vegetation of oak forest, and induced pastureland with erosion. It should be noted that oak forests covered 77 % of the studied area. Table 1 shows the results for this period.
Table 1 Net changes in land use and vegetation (LuV) area in the Forest Protected Area of the southern rivers of Querétaro for the period 1997-2009.
| LuV | 1997 | 2009 | Difference | |||
|---|---|---|---|---|---|---|
| (ha) | % | (ha) | % | (ha) | % | |
| Oak forest | 6 180 | 77 | 5 222 | 65 | -958 | -12 |
| Pine-oak forest1 | 575 | 7 | 631 | 8 | 56 | 1 |
| Pine-oak forest2 | 472 | 6 | 0 | 0 | -472 | -6 |
| Agriculture | 433 | 5 | 383 | 5 | -50 | 0 |
| SSv/PQF | 161 | 2 | 127 | 2 | -34 | 0 |
| Induced pastureland | 122 | 2 | 635 | 8 | 513 | 6 |
| SSv/QF | 21 | 0 | 763 | 10 | 742 | 10 |
| Pine forest | ND | 0 | 216 | 3 | 216 | 3 |
| IPWE | 14 | ND | 0 | ND | 0 | 0 |
1According to INEGI (1997), 2According to Leopold (1950). SSv/PQF: Secondary shrubby vegetation of pine-oak forest; SSv/QF: Secondary shrubby vegetation of oak forest; IPWE: Induced pastureland with erosion; ND: no data.
Table 2 shows the LuV change transition matrix. According to Farfán et al. (2016), the matrix is an asymmetrical arrangement table: the horizontal axis represents the land use categories from the first date, and the vertical axis represents the categories from the second date. The diagonal of the matrix shows the area of each land use category that remained unchanged during the considered period. On the other hand, the rest of the cells show the area that experienced a change to some other type of category. In the second-to-last column of the matrix, the total areas of all categories from time 1 are shown. The second-to-last row presents the total sum for the land uses from time 2. An additional column has been added to the matrix to represent the losses of each LuV category. Additionally, an extra row has been added to show the gains.
Table 2 Land use and vegetation (LUV, ha) change transition matrix in the Forest Protected Area of the southern rivers of Querétaro for the periods 1997-2009 and 2009-2016.
| 2009 | ||||||||||||
|---|---|---|---|---|---|---|---|---|---|---|---|---|
| LuV | PI | IPWE | A | SSv/PQF | SSv/QF | PQF | PF | QPF | QF | Total | Losses | |
| 1997 | PI | 74 | -- | 2 | -- | 7 | -- | -- | 40 | 0 | 123 | 49 |
| IPWE | 11 | -- | 3 | -- | -- | -- | -- | -- | 0 | 14 | 14 | |
| A | 17 | -- | 280 | -- | 13 | -- | 30 | 23 | 69 | 433 | 153 | |
| SSv/PQF | 37 | -- | 6 | 111 | 0 | -- | -- | -- | 7 | 161 | 50 | |
| SSv/QF | -- | -- | 4 | 9 | 8 | -- | -- | -- | -- | 21 | 13 | |
| PQF | 14 | -- | 2 | 7 | 402 | -- | -- | -- | 47 | 472 | 472 | |
| PF | -- | -- | -- | -- | -- | -- | -- | -- | -- | 0 | 0 | |
| QPF | 3 | -- | 45 | -- | 7 | -- | -- | 517 | 3 | 575 | 58 | |
| QF | 480 | -- | 42 | -- | 326 | -- | 186 | 52 | 5 095 | 6 180 | 1 085 | |
| Total | 635 | 0 | 383 | 127 | 763 | 0 | 216 | 631 | 5 222 | 7 978 | ||
| Increase | 562 | 0 | 103 | 16 | 755 | 0 | 216 | 115 | 127 | |||
| 2016 | ||||||||||||
| 2009 | PI | 173 | -- | 152 | 0 | 46 | -- | 4 | 0 | 261 | 635 | 463 |
| IPWE | -- | -- | -- | -- | -- | -- | -- | -- | -- | 0 | 0 | |
| A | 0 | -- | 179 | 0 | 0 | -- | 39 | 71 | 94 | 383 | 204 | |
| SSv/PQF | -- | -- | 64 | 63 | 0 | -- | -- | -- | 0 | 127 | 64 | |
| SSv/QF | 28 | -- | 47 | -- | 687 | -- | -- | 1 | 1 | 763 | 77 | |
| PQF | -- | -- | -- | -- | -- | -- | -- | -- | -- | 0 | 0 | |
| PF | -- | -- | 0 | -- | -- | -- | 215 | -- | 1 | 216 | 1 | |
| QPF | -- | -- | 15 | -- | -- | -- | -- | 617 | 0 | 631 | 15 | |
| QF | 41 | -- | 5 | -- | 375 | -- | 1 | 2 | 4 798 | 5 222 | 425 | |
| Total | 242 | 0 | 461 | 63 | 1 109 | 0 | 259 | 690 | 5 154 | 7 978 | ||
| Increase | 69 | 0 | 282 | 0 | 422 | 0 | 44 | 74 | 357 | |||
IP: induced pastureland; IPWE: induced pastureland with erosion; A: agriculture; SSv/PQF: shrub secondary vegetation of pine-oak forest; SSv/QF: shrub secondary vegetation of oak forest; QPF: oak-pine forest (according to INEGI, 1997); PF: pine forest; PQF: pine-oak forest (according to Leopold, 1950) and QF: oak forest (González Medrano, 2003).
Tables 1 and 2 highlight the change in pine-oak forest, which lost 472 ha, of which, according to the transition matrix, the majority (402 ha) changed to secondary shrubby oak forest vegetation (SSv/QF). Additionally, the oak forest was reduced by 12 %, equivalent to a loss of 958 ha, with transitions to induced pastureland (480 ha) and secondary vegetation (326 ha). Regarding land uses that recorded substantial increases in occupied area, SSv/QF stands out with 9 % (742 ha) and induced pastureland with 6 % (513 ha).
For the period 1997-2009, Table 3 shows the trends in LuV using a probability matrix. According to the results, the LuV with the highest probability of remaining are oak-pine forest, oak forest, induced pastureland and agriculture with 90, 80, 60, 60 and 60 %, respectively. The secondary vegetation of oak forest has the lowest probability of remaining (40 %). On the other hand, pine-oak forest has a high probability (90 %) of migrating to shrub secondary vegetation of oak forest.
Table 3 Matrix of land use and vegetation (LuV) change probabilities in the Protected Forest Zone of the southern rivers of Queretaro for the period 1997-2009.
| LuV | IPWE | A | SSv/PQF | SSv/QF | PQF | PF | PQF | QF |
|---|---|---|---|---|---|---|---|---|
| IP | 0.0 | 0.0 | 0.0 | 0.1 | 0.0 | 0.0 | 0.3 | 0.0 |
| IPWE | 0.0 | 0.2 | 0.0 | 0.0 | 0.0 | 0.0 | 0.0 | 0.0 |
| A | 0.0 | 0.6 | 0.0 | 0.0 | 0.0 | 0.1 | 0.1 | 0.2 |
| SSv/PQF | 0.0 | 0.0 | 0.7 | 0.0 | 0.0 | 0.0 | 0.0 | 0.0 |
| SSv/QF | 0.0 | 0.2 | 0.4 | 0.4 | 0.0 | 0.0 | 0.0 | 0.0 |
| PQF | 0.0 | 0.0 | 0.0 | 0.9 | 0.0 | 0.0 | 0.0 | 0.1 |
| QF | 0.0 | 0.0 | 0.0 | 0.0 | 0.0 | 0.0 | 0.0 | 0.0 |
| PQF | 0.0 | 0.1 | 0.0 | 0.0 | 0.0 | 0.0 | 0.9 | 0.0 |
| QF | 0.0 | 0.0 | 0.0 | 0.1 | 0.0 | 0.0 | 0.0 | 0.8 |
IP: induced pastureland; IPWE: induced pastureland with erosion; A: agriculture; SSv/PQF: shrub secondary vegetation of pine-oak forest; SSv/QF: shrub secondary vegetation of oak forest; QPF: oak-pine forest (according to INEGI, 1997); PF: pine forest; PQF: pine-oak forest (according to Leopold, 1950) and QF: oak forest (González Medrano, 2003).
Land uses, changes and trend for the period 2009-2016
Table 4 shows the dynamics of LuV for the period 2009-2016. Among the changes observed, the loss of 394 ha of induced pastureland, representing 5 %, stands out. Also, the oak forest had losses that were mainly occupied by secondary vegetation (375 ha) and induced pastureland (40 ha), so in net terms the loss was 68 ha.
Table 4 Net changes in land use and vegetation in the Forest Protected Areas of the southern rivers of Querétaro for the period 2009-2016.
| LuV | 2009 | 2016 | Difference | |||
|---|---|---|---|---|---|---|
| ha | % | ha | % | ha | % | |
| Oak forest | 5 222 | 65 | 5 154 | 65 | -68 | 0 |
| Oak-pine forest1 | 631 | 8 | 690 | 9 | 59 | 1 |
| Pine-oak forest2 | 0 | ND | 0 | ND | 0 | 0 |
| Agriculture | 383 | 5 | 461 | 6 | 78 | 1 |
| SSv/PQF | 127 | 2 | 63 | 1 | -64 | -1 |
| Induced pastureland | 635 | 8 | 242 | 3 | -394 | -5 |
| SSv/QF | 763 | 10 | 1 109 | 14 | 345 | 4 |
| Pine forest | 216 | 3 | 259 | 3 | 43 | 0 |
| IPWE | 0 | ND | 0 | 0 | 0 | 0 |
1According to INEGI (1997); 2according to Leopold (1950). SSv/QF: shrub secondary vegetation of pine-oak forest; SSv/QF: shrub secondary vegetation of oak forest; IPWE: Induced pastureland with erosion; ND: no data.
Table 5 shows that in the 1997-2009 period, 76 % of the area remained unchanged; however, forest loss was about 631 ha, representing 8 % of the total area. In the 2009-2016 period, the area that remained unchanged stands out, which increased slightly by 5 % compared to the previous period, from 6 085 ha to 6 516 ha. The forest loss is 432 ha less than the loss observed in the period 1997-2009. Also, there was a decrease of 117 ha in replacement vegetation compared to the previous period.
Table 5 Dynamics of land use change in the Forest Protected Area of the southern rivers of Querétaro for the periods 1997-2009 and 2009-2016.
| Type of change | 1997-2009 | 2009-2016 | ||
|---|---|---|---|---|
| ha | % | ha | % | |
| No change | 6 085 | 76 | 6 516 | 82 |
| Replacement vegetation | 1 229 | 15 | 1 111 | 14 |
| Forest loss | 631 | 8 | 199 | 2 |
| Productive activity | 33 | 1 | 152 | 2 |
| Total | 7 978 | 100 | 7 978 | 100 |
Table 6 shows the probability matrix for the period 2009-2016. The land uses with the highest probability of remaining over time are pine forest, oak-pine forest and oak forest with 100, 100 and 90 %, respectively. Agriculture recorded 50 % probability of remaining and the other 50 % could change to oak-pine forest (20 %) or oak forest (20 %) and pine forest (10 %).
Table 6 Probability matrix of land use and vegetation (LuV) change in the Forest Protected Area of the southern rivers of Querétaro for the period 2009-2016.
| LuV | IP | IPWE | A | SSv/PQF | SSv/QF | PQF | PF | QPF | QF |
|---|---|---|---|---|---|---|---|---|---|
| IP | 0.3 | 0.0 | 0.2 | 0.0 | 0.1 | 0.0 | 0.0 | 0.0 | 0.4 |
| IPWE | 0.0 | 0.0 | 0.0 | 0.0 | 0.0 | 0.0 | 0.0 | 0.0 | 0.0 |
| A | 0.0 | 0.0 | 0.5 | 0.0 | 0.0 | 0.0 | 0.1 | 0.2 | 0.2 |
| SSv/PQF | 0.0 | 0.0 | 0.5 | 0.5 | 0.0 | 0.0 | 0.0 | 0.0 | 0.0 |
| SSv/QF | 0.0 | 0.0 | 0.1 | 0.0 | 0.9 | 0.0 | 0.0 | 0.0 | 0.0 |
| PQF | 0.0 | 0.0 | 0.0 | 0.0 | 0.0 | 0.0 | 0.0 | 0.0 | 0.0 |
| PF | 0.0 | 0.0 | 0.0 | 0.0 | 0.0 | 0.0 | 1.0 | 0.0 | 0.0 |
| QPF | 0.0 | 0.0 | 0.0 | 0.0 | 0.0 | 0.0 | 0.0 | 1.0 | 0.0 |
| QF | 0.0 | 0.0 | 0.0 | 0.0 | 0.1 | 0.0 | 0.0 | 0.0 | 0.9 |
IP: induced pastureland; IPWE: induced pastureland with erosion; A: agriculture; SSv/PQF: shrub secondary vegetation of pine-oak forest; SSv/QF: shrub secondary vegetation of oak forest; QPF: oak-pine forest (according to INEGI, 1997); PF: pine forest; PQF: pine-oak forest (according to Leopold, 1950) and QF: oak forest (González Medrano, 2003).
In general, during the 20 years analyzed, three important results can be distinguished in the FPARSQ: 1) the land uses and vegetation (LuV) with tree cover that lost the most surface area in net terms were oak forest with 1 026 ha (16 %) and pine-oak forest, whose 472 ha disappeared from the FPARSQ (100 %); 2) secondary shrub vegetation/oak forest increased from 21 ha to 1 088 ha, representing an increase of over 5 000 %; 3) regarding LuV associated with productive activities, induced pastureland grew by 119 ha (98 %) and agriculture increased by 128 ha (6 %).
Studies related to natural protected areas (NPA) provide different kinds of results. For example, Rioja-Nieto et al. (2015) found no clear evidence supporting the conservation objectives of the PNA. Blackman et al. (2015) concluded that PNA do not have clear protection effects on the clearings occurring in them. On the other hand, Morales-Hernández et al. (2016), in their study of the Bahía de Banderas PNA, found that there is a process of change and replacement of land cover and uses mainly associated with agriculture at the expense of forests and rainforests.
Mexico has lost large areas of its ecosystems in recent decades; by 1976, the original total coverage in Mexico had been reduced by 38 %, and by 1993 it only covered 54 % (Challenger et al., 2009). A significant portion of these areas belong to rural communities; their land use changes affect biodiversity and reduce vital ecosystem services (De Alba et al., 2020). Under these circumstances, the identification and characterization of vegetation units have been of great importance, and GIS have been widely used in their analysis (Flores et al., 2020). GIS generates data using remote sensors that allow for the integration of forest cover information.
Causes of Land Use Change
Figure 2 shows the analyzed dynamics from 1997 to 2016 and the identified sites with some impact on the cover, which were visited to corroborate the land use change.
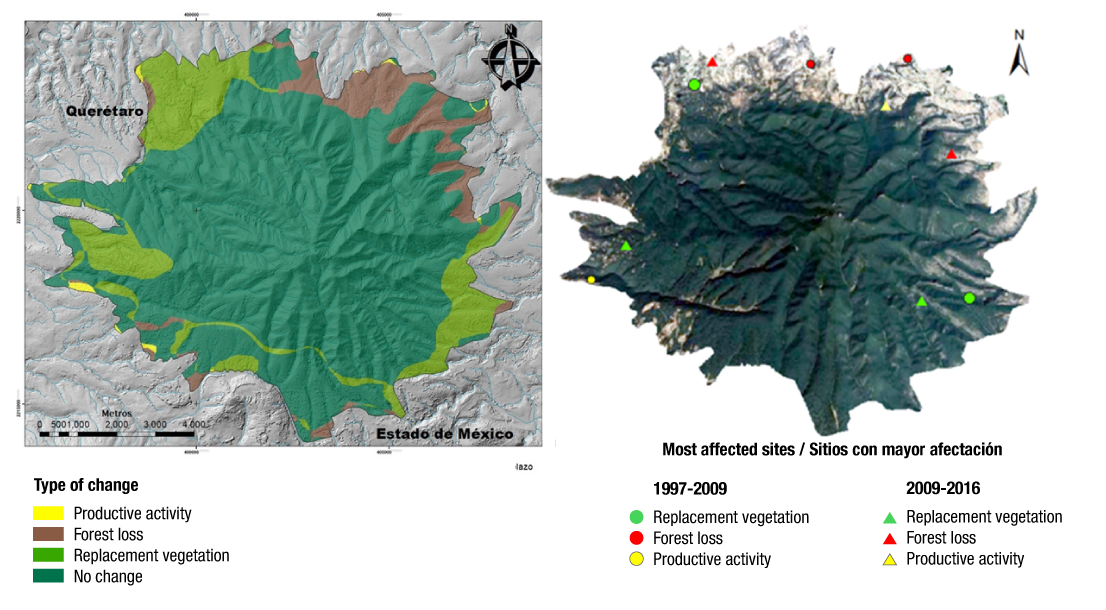
Source: Compiled by the authors based on data from INEGI (1997, 2016).
Figure 2 Dynamics of change (left) and main affected sites (right) in the Forest Protected Area of the southern rivers of Querétaro.
A preliminary study was conducted using a survey applied to a sample of 94 households from five localities in the region, aimed at identifying people's perceptions regarding the dynamics of change of LuV. This survey, applied on November 2021, indicated that 67 % stay at home, 11 % are involved in agriculture, 10 % are engaged in artisanal activities, and the rest in other activities. Regarding the energy used for cooking, the responses indicate that 32 % use liquefied petroleum gas (LPG), 30 % use firewood, and 38 % use both LPG and firewood; respondents stated that the firewood is extracted from nearby forests.
Regarding the residents' perception of the possible causes of the impacts, 90 % identify illegal logging as the main problem, which is associated with charcoal production and the extraction of firewood for domestic use. Charcoal production carries a high risk of causing fires. CONAFOR reports that between 2009 and 2016, a fire affected nearly 30 hectares of vegetation in the study area.
The conditions and trends of biodiversity change, as indicated by Morales-Hernández et al. (2016), are rooted in social, economic, and political factors known as root causes. These factors often lead to changes in land cover and land use, overexploitation of organisms, introduction of invasive exotic species, anthropogenic climate change, and the addition of polluting products. Consequently, regarding the causes of vegetation changes, it is common for frequently reported factors to include anthropogenic activities and the high content of woody material that is vulnerable to forest fires. Another contributing factor is the expansion of agriculture and livestock farming, which leads to the extension of infrastructure (Ellis et al., 2017; Monjardín-Armenta et al., 2017).
GIS methodologies have frequently been used in the study of natural protected areas (NPA) in the country. For example, Neri-Suárez (2018) evaluated conservation gaps (known as gap analysis) in vegetation types relative to PNAs in Guerrero, Mexico. Additionally, Chico et al. (2015) assessed land use changes using orthophotos from 1994, 1999, and 2007 in the Insurgente Miguel Hidalgo y Costilla National Park, also known as La Marquesa, in Mexico City. Rioja-Nieto et al. (2015) evaluated the effects of management in El Palmar State Reserve on the Yucatán Peninsula using remote sensing techniques based on hierarchical analysis of habitat characteristics. A similar case, but applying geospatial modeling of agroecological and forestry variables, was conducted by Villegas-Martínez (2021) in the Otomí-Mexica Park in Estado de México.
Conclusions
From 1997 to 2016, changes in land use and vegetation in the Forest Protected Area of the southern rivers of Querétaro show losses in oak forest and the disappearance of pine-oak forest, while shrub secondary vegetation/oak forest, grassland and agriculture increased. The trends showed that the pine-oak forest had a high probability of migrating or being replaced by the shrubby secondary vegetation of oak forest, while the oak forest, despite the losses, had a high probability of remaining. Therefore, it is expected that, as the shrub secondary vegetation increases, the tree vegetation will also gradually increase. The possible causes of change are of anthropogenic origin, such as deforestation (agriculture), illegal logging (charcoal production, cutting and firewood extraction) and forest fires, according to the most frequent answers to the survey. This study only shows the analysis from 1997 to 2016, so this dynamic is expected to be different in the last eight years.