


Servicios Personalizados
Revista
Articulo
 texto en
  Inglés (pdf)
 Artículo en XML
 Referencias del artículo
 Enviar artículo por email
Indicadores
-
 Citado por SciELO
 -
 Accesos
Links relacionados
-
 Similares en
SciELO
Similares en
SciELO
Compartir

 Permalink
Revista mexicana de ciencias forestales
versión impresa ISSN 2007-1132
Rev. mex. de cienc. forestales vol.8 no.39 México ene./feb. 2017
Articles
Aboveground biomass dynamics after a reforestation program in San Luis Potosí State
1Programa de Doctorado. Facultad de Ciencias Forestales. Universidad Autónoma de Nuevo León. México.
2Universidad Autónoma de Nuevo León, Facultad de Ciencias Forestales. México.
3 Campo Experimental Centro Altos de Jalisco. Instituto Nacional de Investigaciones Forestales, Agrícolas y Pecuarias - INIFAP. México.
4 Ingeniería Geomática. Facultad de Ingeniería. Universidad Autónoma de San Luis Potosí. México.
5 Programa de Doctorado. Facultad de Ciencias Forestales. Universidad Autónoma de Nuevo León. México.
The impact of the reforestation program implemented by Conafor in the Forest Management Region 2404 was determined. In order to carry out this analysis, the difference in the amount of above ground biomass existing in 2000, 2010 and 2015 was calculated. To calculate the biomass, a model was developed that relates satellite image information to that obtained in field samples. Landsat 5 TM images were used for the years 2000 and 2010 and Landsat 8 OLI for 2015. In these images, the normalized difference vegetation index (NDVI) was generated. Subsequently, the amount of biomass of the species recorded in 44 sample clusters of the National Forest and Soils Inventory was estimated using allometric equations. To determine the relationship between the data obtained between the two methods., the Pearson correlation coefficient (0.69, 0.65 and 0.64, for 2000, 2010 and 2015, respectively) was calculated. With these data, three types of models were tested: linear, exponential and second order polynomial for each year, selecting the polynomial to model the biomass in the three years. With the application of the model in the mosaics of images, it was obtained that from 2000 to 2015 there was an important increase both in the amount of biomass and in the area with vegetation. It is concluded that the reforestation program has had a positive impact on the region.
Key words: Spatial analyst; aboveground biomass; allometric equations; Landsat images; normalized difference vegetation index; forest national inventory
Se determinó el impacto del programa de reforestación ejecutado por la Comisión Nacional Forestal en la Unidad de Manejo Forestal 2404. Para realizar este análisis se calculó la diferencia en la cantidad de biomasa aérea existente en el año 2000, 2010 y el 2015. Para la biomasa se desarrolló un modelo que relaciona la información de imágenes de satélite con la obtenida en campo. Se utilizaron imágenes Landsat 5 TM para los años 2000 y 2010 y Landsat 8 OLI para 2015. En ellas se generó el Índice de vegetación de diferencia normalizada (NDVI). Posteriormente se estimó la cantidad de biomasa de las especies registradas en 44 conglomerados del Inventario Nacional Forestal y de Suelos empleando ecuaciones alométricas. Para determinar la relación entre los datos obtenidos entre ambos métodos se calculó el coeficiente de correlación de Pearson (0.69, 0.65 y 0.64, para 2000, 2010 y 2015, respectivamente). Con estos datos se probaron tres tipos de modelos: lineal, exponencial y polinomial de segundo orden para cada año, seleccionando el modelo polinomial para modelar la biomasa en los tres años. Con la aplicación del modelo en los mosaicos de imágenes en los tres periodos, se obtuvo que de 2000 a 2015 hubo un incremento importante tanto en la cantidad de biomasa como en el área con vegetación. Se concluye que el programa de reforestación si ha tenido impacto positivo en la zona de estudio.
Palabras clave: Análisis espacial; biomasa aérea; ecuaciones alométricas; imágenes Landsat; índice de vegetación diferencial normalizado; inventario nacional forestal
Introduction
Natural resources have been used to meet the needs of societies throughout the history of mankind, which has led to their overexploitation and eventual deterioration of extensive territories, which implies, in many cases, the unavoidable loss of biodiversity genetics. Reforestation, as a remediation strategy, is a continuous ecological restoration activity in Mexico.
With the creation of the Comisión Nacional Forestal (National Forestry Commission) (Conafor) in 2003, programs have been designed with the aim to exploit, conserve and restore forest resources through the granting of financial support to producers. The Forest Management Units (UMAFORES) were established on the basis of Article 12 of the General Law of Sustainable Forest Development, which considers the need to delimit the entire country under this scheme of ordination, with the purpose of exercising proper planning of activities and efficient management of forest resources.
A reforestation program aims to promote the revegetation of deforested areas by increasing the amount of biomass. In order to assess its relevance, several strategies are proposed, one of which involves considering the success of reforestation directly through the forest inventory of the supported areas, with the limitation of costs in time and resources, as well as logistics, as there are access difficulties. Another way of estimating this aspect is to evaluate indirectly, through the analysis of materials from remote sensing, before and after reforestation.
Calculating the amount of biomass through satellite imagery has favored the analysis of forest cover at different scales thanks to the wide range of spatial resolutions offered by sensors installed in satellites (Dube and Mutanga, 2015; Scottá and da Fonseca, 2015; Valdez et al., 2006; Yin et al., 2015). Landsat satellite imagery has been used repeatedly for the estimation of forest variables (Barasa et al., 2010, Günlü et al., 2014, Xu and Guo, 2014).
The methods used for the estimation of biomass by satellite imagery include supervised classification (Luong et al., 2015, Perumal and Bhaskaran, 2010), unsupervised classification (Bharatkar and Patel, 2013, Wang et al., 2015), as well as the generation of the Normalized Difference Vegetation Index (NDVI) (Ji et al., 2012, Sall et al., 2013), which generates a numerical value indicating the vigor of vegetation by means of the relation between the amount of energy reflected in the near infrared and the one absorbed by vegetation in the of the red part (Tun et al., 2008), which indicates the existing biomass in an indirect way, With the field information it is necessary to validate it by calculating the amount of biomass of the plants present in the field, using allometric equations (Aguilar et al., 2012; Balderas and Lovett, 2013; Vahedi et al., 2014).
The results of the calculation of the biomass in the field and the generated with the algorithm of the NDVI have served as the basis for the development of mathematical models that allow to relate this information (Aguirre et al., 2012; Karlson et al., 2015; Lu et al., 2012); once statistically validated, are used to estimate the aboveground biomass by extrapolating the values obtained from the image process to an area or region.
The verification of the results is done by comparing the data obtained by remote perception with respect to those calculated in the field (Cabral and Zamyatin, 2009; Seebach et al., 2011). To analyze the dynamics of forest cover in a given period, the difference in the amount of biomass between two or more dates is estimated.
Assuming that reforestation actions should have a positive regional effect on biomass growth, the objective was to assess the impact of the reforestation program implemented in 2010 in the region covered by UMAFOR 2404.
Materials and Methods
The study area is located in the state of San Luis Potosí, located in the north central part of Mexico and comprises the administrative region of UMAFOR 2404. In this analysis, the properties that were supported in the reforestation program by the Mexican government in 2010, which are located between the coordinates 255 550 E, 2 509 507 N and 379 230 E, 2 382 393 N (Figure 1) and they have an area of 553 284 ha were given particular interest.

The climate varies between very dry (Bw) and subhumid temperate (Cw) (García, 1981). There are nine types of vegetation in the area, three of which correspond to temperate forests with pure pine and oak masses, as well as mixed forests of both genera, shrubs formed by shrub oaks, shrub communities of Prosopis spp. and Acacia spp., submontane scrubland, desert scrubland, halophyte vegetation and grasslands (Rzedowski, 1965).
According to the Sistema Nacional de Información Forestal (National Forestry Information System), in 2010, support was given for the reforestation of an area of 2 893 ha for UMAFOR 2404, of which 97 % was used for reforestation with plants obtained by vegetative propagation and 3 % to plants coming from seed.
Nine Landsat images corresponding to the orbit / line 27/45, 28/44 and 28/45, of the years 2000, 2010 and 2015 were used; the first formed the baseline of comparison (Table 1). Landsat 5 TM images were downloaded from http://glcfapp.glcf.umd.edu:8080/esdi/ and those of 2015, from http://earthexplorer.usgs.gov/. Images were processed by the Imagine 201 Erdas TM program (ERDAS, 2010) and were geometrically fixed to make their register and thus allow their comparison.
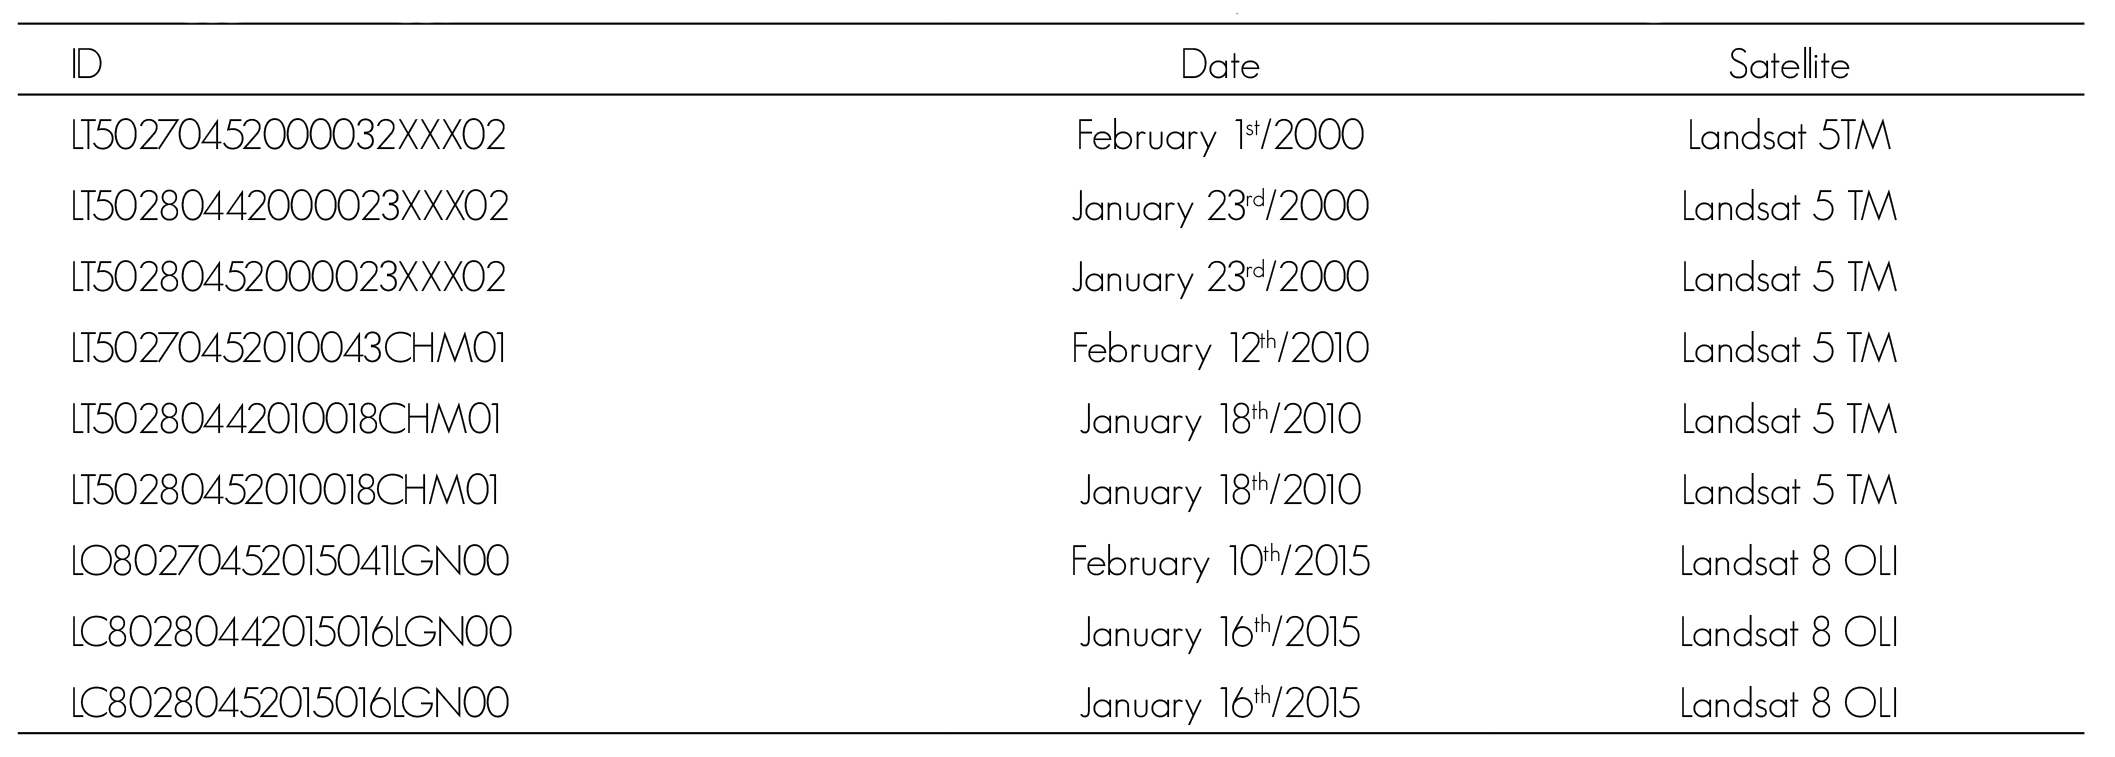
Table 1 Characteristics of the Landsat satellite images used for temporal analysis of biomass in forest plantations.
To reduce the volume of data, subpictures were created that cover only the selected areas. A digital cover in vector format was used that contained the limits of the farms with works of reforestation in 2010 provided by Conafor. The resulting subimages were applied the NDVI generation algorithm with the following relation:

Where:
NDVI |
= Normalized Difference Vegetation Index |
R |
= Reflectivity of the red region |
IRC |
= Reflectivity of the infrared region |
For the creation and validation of the model, the information recorded at the Inventario Nacional Forestal y de Suelos (INFyS) (National Forest and Soil Inventory (INFyS)) sampling sites from 2005 to 2007 was taken; data from the adult woodland record collected in 55 conglomerates were used, 44 for the development of the models and 1 for their validation (Figure 3). In order to calculate the aboveground biomass (trunk, branches and foliage) allometric equations were developed at the genus level or, if they exist at the species level, which have as input the values of the diameter and height variables, which were generated by several authors (Návar, 2009; Rodríguez et al., 2006; Rodríguez et al., 2007; Rojas et al., 2015) for similar regions. The total biomass value per unit area was obtained with the sum of the total aboveground biomass of the trees recorded by conglomerate and extrapolated to values per hectare.
In order to establish these prediction models, the estimated biomass information for the 44 field sampled clusters was estimated with the NDVI values for each date, and a sample of 25 pixels was taken from the images corresponding to the values of the conglomerate.
An analysis was performed to determine the degree of correlation between the field data and those obtained from the satellite images, for which the Pearson correlation index “r” was calculated.
With the results obtained in the previous processes, linear, exponential and polynomial prediction models were developed.
In order to choose the model, the values of the root mean square error (RMSE) statistics and the R2 coefficient of determination were considered.
To compare the variance in the three-year estimates, a variance analysis (ANOVA) was performed with a 95 % confidence interval (α = 0.05).
Once the prediction models were selected, they were applied to each of the images from which came a digital chart with the amount of biomass per unit area for the study area. The total biomass value of the selected area was obtained with the sum of the total aboveground biomass per unit area.
Results and Discussion
The distribution of the vegetation index defined by the NDVI values is shown in Figure 2. The gray tones represent eight ranges of vegetation cover, the most obscure ones refer to the low numbers and the clear ones to the high ones.
As in the actual study, Alatorre et al. (2014) found a tendency of increase in the NDVI numbers from the same sensor in Chihuahua State in a multitemporal analysis (1986-2011).

The spatial distribution of the sampling clusters used in both, modeling (dot) as in validation (triangle) are shown in Figure 3. In them, 28 genera and 66 tree species were recorded: Quercus with 22 species was the best represented, followed by Pinus with nine species; Acacia, Arbutus, Crataegus, Juglans, Juniperus, Prunusa and Yucca with two species; Acer, Arctostaphylos, Buddleia, Carya, Casimiroa, Eysenhardtia, Fraxinus, Gochnatia, Jacaranda, Lysiloma, Nolina, Persea, Pithecellobium, Platanus, Prosopis, Pyrus, Rhus, Stenocereus and Zanthoxylum with one species.

Figure 3 Spatial distribution of the clusters of the Inventario Nacional Forestal y de Suelos (Conafor, 2007) in the study área
In order to determine the correspondence between the estimated field data and those obtained from the satellite image processing, the Pearson correlation index was calculated, resulting in values of 0.69, 0.65 and 0.64 for 2000, 2010 and 2015, respectively, which indicate a high correlation. In working similar problems, Gunawardena et al. (2015) in Sri Lanka and Zhu and Liu (2015) in Peru made similar correlations by imaging the sensors that were used in the present study.
From the aerial biomass prediction models developed with the NDVI values and the field estimates, the polynomial type showed the best determination coefficients (R2) and Mean Squared Error values (Table 2); in them the adjusted models are shown, as well as the values of R2 and RMSE for each one.

The polynomial model was selected for three years. In all cases, the selected model yielded the highest value of R2 and the lowest RMSE. As far as the R2 values are concerned, those calculated in this work are inferior to those presented by Ruiz et al. (2014), who recorded values between 0.9765 and 0.9914 in the aboveground biomass calculation for Quercus laurina Bonpl. and Quercus crassifolia Bonpl. in a pine-oak forest in Oaxaca State.
Also, the RMSE of the present study is smaller than that described by Martínez et al. (2016), whose values are distributed in a range of 0.68 to 0.99 for biomass by allometric equations for tree components (stem, branches and leaves) in the state of Durango. Those in the present study are similar to the lower value reported by Powell et al. (2013), which was 22 Mg ha-1, and the maximum 221 Mg ha-1, which surpasses it. In contrast, the own results exceed most of those determined by Main et al. (2011), who calculated 10.22 and 12.64 Mg ha-1 in two models, while a third model showed a value of 40.64 Mg ha-1. It is important to consider that non-linear models can overestimate calculated values (Aguirre et al., 2012).
The selected models were applied to the image containing the NDVI values for the corresponding year to estimate the amount of biomass. Only the positive NDVI numbers representing surface biomass were taken. Figure 4 shows images of biomass estimation maps in the three years. The values presented in this study are similar to those of Aguirre et al. (2012), who reached productions between 5 and 150 Mg ha-1 per unit area in this study area depending on their vegetation cover.
In the images it can be observed that the increase of the biomass has occurred in different zones. For example, in 2000 the highest amounts are concentrated to the center and northwest; in 2010, to the center, east and southeast; and in 2015, in the center-south and northwest.

With the resulting values from the calculation of biomass and through the polynomial model the variance for each one of the years was analyzed (Table 3).

According to the information in Table 4, there was no significant difference between the values of the variance for the three years, which reinforces that the value of F was lower than the critical value in them. These results surpass those of Trigueros et al. (2014), who registered a value of 2.712 in the calculation of normal diameter, height and basal area; however, there was agreement with this analysis, since the values of F were below the critical value in the three periods.
Total aboveground biomass for each of the analyzed years is shown in Table 4.

From 2000 to 2015 there was a considerable increase in the amount of biomass (423 %); From 2000 to 2010 was 234 %. In addition, the average biomass per ha had a similar behavior when going from 0.26 to 1.10 Mg ha-1. These values are lower than those reported by Velásquez et al. (2012), who calculated an average annual increase of 2.9 Mg ha-1 in a region of the Colombian Andes. Also, the biomass results per hectare of the present study were lower than those of Restrepo et al. (2016), who record an average of 4 Mg ha-1 in a forest of Colombia.
Finally, the Pearson correlation coefficient was calculated in the clusters used for validation, which showed 0.69, 0.66 and 0.73 for 2000, 2010 and 2015, respectively. These values indicate a high correlation.
Conclusions
From the total estimated values, there was a 423 % increase in the amount of biomass, from 2000 to 2015, which reveals that the reforestation program has had the expected effects from its original design.
The models that more accurately estimated the biomass were chosen based on the values of R2 and RMSE, but the values obtained with the nonlinear models could be overestimated given their own characteristics
Acknowledgements
The authors wish to express their regards to the Gerencia Estatal in the state of San Luis Potosí and to the Gerencia de Inventario Nacional Forestal y Geomática of the Comisión Nacional Forestal for having provided the basic information in order to carry out the actual study
REFERENCES
Aguilar, R., A. Ghilardi, E. Vega, M. Skutsch and K. Oyama. 2012. Sprouting productivity and allometric relationships of two oak species managed for traditional charcoal making in central Mexico. Biomass and Bioenergy 36: 192 - 207. doi:10.1016/j.biombioe.2011.10.029. [ Links ]
Aguirre S., C. A., E. J. Treviño G., O. A. Aguirre C., J. Jiménez P., M. A. González T., J. R., Valdez L., L. Miranda A. and A. I. Aguirre S. 2012. Construction of aboveground biomass models with remote sensing technology in the intertropical zone in Mexico. Journal of Geographical Science 22(4): 669 - 680. doi: 10.1007/s11442-012-0955-9. [ Links ]
Alatorre, L. C., S. Miramontes B., A. K. García P., R. Díaz C. y L. C. Bravo. 2014. Evolución de la dinámica vegetal mediante una serie de imágenes Landsat TM (1986 - 2011): región central de Chihuahua, México. Cuadernos de Investigación Geográfica 40 (2): 449 - 476. doi: 10.18172/cig.2510. [ Links ]
Balderas T., A. and J. C. Lovett. 2013. Using basal area to estimate aboveground carbon stocks in forests: La Primavera Biosphere’s Reserve, Mexico. Forestry 86: 267 - 281. doi: 10.1093/forestry/cps084. [ Links ]
Barasa, B., M. G. J. Majaliwa, S. Lwasa, J. Obando and Y. Bamutaze. 2010. Estimation of the aboveground biomass in the trans-boundary River Sio Sub-catchment in Uganda. Journal of Applied Sciences and Environmental Management 14 (2): 87 - 90. doi: 10.4314/jasem. v14i2.57869. [ Links ]
Bharatkar, P. S. and R. Patel. 2013. Assessment of various block truncation coding based remote sensing image classification techniques. International Journal of Remote Sensing and GIS 2 (1): 52 - 60. [ Links ]
Cabral, P. and A. Zamyatin. 2009. Markov processes in modeling land use and land cover changes in Sintra-Cascais, Portugal. Dyna 76(158): 191 - 198. [ Links ]
Dube, T. and O. Mutanga. 2015. Evaluating the utility of the medium-spatial resolution Landsat 8 multispectral sensor in quantifying aboveground biomass in uMgeni catchment, South Africa. ISPRS Journal of Photogrammetry and Remote Sensing 101: 36 - 46. doi:10.1016/j.isprsjprs.2014.11.001. [ Links ]
ERDAS. 2010. ERDAS Imagine 2011. Products and Services. 11.0.4 ed. ERDAS Incorporated. Norcross, GA, USA. n/p. [ Links ]
García, E. 1981. Modificaciones al sistema de clasificación climática de Köeppen para adaptarlo a las condiciones de la República Mexicana. Offset Larios. México, D. F., México. 246 p. [ Links ]
Gunawardena, A. R., S. P. Nissanka, N. D. K Dayawansa and T. T. Fernando. 2015. Estimation of above ground biomass in Horton Plains National Park, Sri Lanka using Optical, Thermal and RADAR Remote Sensing Data. Tropical Agricultural Research 26 (4): 608 - 623. [ Links ]
Günlü, A., I. Ercanli, E. Z. Baskent and G. Çakir. 2014. Estimating aboveground biomass using Landsat TM imagery: A case study of Anatolian Crimean pine forests in Turkey. Annals of Forest Research 57(2): 289-298. doi: 10.15287/afr.2014.278. [ Links ]
Ji, L., B. K. Wylie, D. R. Nossov, B. Peterson, M. P. Waldrop, J. W. McFarland, J. Rover and T. N. Hollingsworth. 2012. Estimating aboveground biomass in interior Alaska with Landsat data and field measurements. International Journal of Applied Earth Observation and Geoinformation 18: 451 - 461. doi: 10.1016/j.jag.2012.03.019. [ Links ]
Karlson, M., M. Ostwald, H. Reese, J. Sanou, B. Tankoano and E. Mattsson. 2015. Mapping tree canopy cover and aboveground biomass in Sudano-Sahelian woodlands using Landsat 8 and Random Forest. Remote Sensing 7: 10017 - 10041. doi: 10.3390/rs70810017. [ Links ]
Lu, D., Q. Chen, G. Wang, E. Moran, M. Batistella, M. Zhang, G. L.Vaglio and D. Saah. 2012. Aboveground forest biomass estimation with Landsat and LiDAR Data and Uncertainty Analysis of the estimates. International Journal of Forestry Research 16 p. doi: 10.1155/2012/436537. [ Links ]
Luong, N. V., R. Tateishi, N. T. Hoan and T. T. Tu. 2015. Forest change and its effect on biomass in Yok Don National Park in Central Highlands of Vietnam using ground data and geospatial techniques. Advances in Remote Sensing 4: 108 - 118. doi: 10.4236/ars.2015.42010. [ Links ]
Main K., M., G. G. Moisen, S. P. Healey, W. S. Keeton, E. A. Freeman and P. Hostert. 2011. Evaluating the remote sensing and inventory-based estimation of biomass in the Western Carpathians. Remote Sensing 3: 1427 - 1446. doi: 10.3390/rs3071427. [ Links ]
Martínez S., D., S. Solís G., F. J. Hernández y J. J. Graciano L. 2016. Ecuaciones para estimar biomasa aérea y subterránea en áreas reforestadas de Pinus cooperi Blanco en Durango, México. Foresta Veracruzana 18 (1): 25 - 32. [ Links ]
Návar, J. 2009. Biomass component equations for Latin American species and groups of species. Annals of Forest Science 66 (2): 1- 21. doi: 10.1051/forest/2009001. [ Links ]
Perumal, K. and R. Bhaskaran. 2010. Supervised classification performance of multispectral images. Journal of Computing 2 (2): 124 - 129. [ Links ]
Powell, S. L., W. B. Cohen, R. E. Kennedy, S. P. Healey and C. Huang. 2013. Observation of trends in biomass loss as a result of disturbance in the conterminous U.S.: 1986-2004. Ecosystems 142 - 157. doi: 10.1007/s10021-013-9713-9. [ Links ]
Restrepo, I. C., A. M. Aldana y P. R. Stevenson. 2016. Dinámica de los bosques en diferentes escenarios de tala selectiva en el Magdalena medio (Colombia). Colombia Forestal 19 (2): 71 - 83. [ Links ]
Rodríguez L., R., J. Jiménez P., O. Aguirre C. y E. J. Treviño G. 2006. Estimación del carbono almacenado en un bosque de niebla en Tamaulipas, México. Ciencia UANL. 9(2): 179 - 187. [ Links ]
Rodríguez L., R., J. Jiménez P., O. Aguirre C. y E. Jurado I. 2007. Ecuaciones alométricas para estimar biomasa aérea en especies de encino y pino en Iturbide, NL. Revista Ciencia Forestal en México. 32 (101): 39 - 56. [ Links ]
Rojas G., F., B. H. J. de Jong, P. Martínez Z. and F. Paz P. 2015. Database of 478 allometric equations to estimate biomass for Mexican trees and forests. Annals of Forest Science. 30pp. doi: 10.1007/s13595- 015-0456-y. [ Links ]
Ruiz A., F., J. I. Valdez H., F. Manzano M., G. Rodríguez O., A. Romero M. y M. E. Fuentes L. 2014. Ecuaciones de biomasa aérea para Quercus laurina y Q. crassifolia en Oaxaca. Madera y Bosques 20 (2): 33 - 48. [ Links ]
Rzedowski, J. 1965. Vegetación del estado de San Luis Potosí. Acta Científica Potosina 5:5-291. [ Links ]
Sall, B., M. W. Jenkins and J. Pushnik. 2013. Retrospective analysis of two Northern California wild-land fires via Landsat five satellite imagery and Normalized Difference Vegetation Index (NDVI). Open Journal of Ecology 3 (4): 311 - 323. doi: 10.4236/oje.2013.34036. [ Links ]
Scottá, F. C. and E. L. da Fonseca. 2015. Multiscale Trend Analysis for Pampa Grasslands Using Ground Data and Vegetation Sensor Imagery. Sensors 15: 17666-17692. doi: 10.3390/s150717666. [ Links ]
Seebach, L. M., P. Strobl, J. San Miguel A., J. Gallego and A. Bastrp B. 2011. Comparative analysis of harmonized forest area estimates for European countries. Forestry. 84 (3): 285 - 299. doi: 10.1093/ forestry/cpr013. [ Links ]
Trigueros B., A. G., R. Villavicencio G. y A. L. Santiago P. 2014. Mortalidad y reclutamiento de árboles en un bosque templado de pino-encino en Jalisco. Revista Mexicana de Ciencias Forestales. 5 (24): 160 - 183. [ Links ]
Tun D., F. J., H. Vester, R. Durán G. y B. Schmook. 2008. Estructura arbórea y variabilidad temporal del NDVI en los bajos inundables de la Península de Yucatán, México. Polibotánica 25: 69 - 90. [ Links ]
Vahedi, A. A., A. Mataji, S. Babayi K., J. Eshaghi R., S. M Hodjati and A. Djomo. 2014. Allometric equations for predicting aboveground biomass of beech-hornbeam stands in the Hyrcanian forests of Iran. Journal of Forest Science 60 (6): 236 - 247. [ Links ]
Valdez L., J. R., M. J. González G y H. M. de los Santos P. 2006. Estimación de cobertura arbórea mediante imágenes satelitales multiespectrales de alta resolución. Agrociencia 40 (3): 383 - 394. [ Links ]
Velásquez R., J. O., N. L. Maniguaje y A. J. Duque. 2012. Diversidad y dinámica de un bosque subandino de altitud en la región norte de los Andes colombianos. Revista de Biología Tropical 60 (2): 943 - 952. [ Links ]
Wang, C., J. Johnston, D. Vail, J. Dickinson and D. Putnam. 2015. High-Precision Land-Cover-Land-Use GIS Mapping and Land Availability and Suitability Analysis for Grass Biomass Production in the Aroostook River Valley, Maine, USA. Land 4: 231 - 254. doi: 10.3390/ land4010231. [ Links ]
Xu, D. and X. Guo. 2014. Compare NDVI extracted from Landsat 8 imagery with that from Landsat 7 imagery. American Journal of Remote Sensing 2(2): 10 -14. doi: 10.11648/j.ajrs.20140202.11. [ Links ]
Yin, G., Y. Zhang, Y. Sun, T. Wang, Z. Zeng and S. Piao. 2015. MODIS Based Estimation of Forest Aboveground Biomass in China. PLoS One 10 (6): 13 p. doi: 10.1371/journal.pone.0130143. [ Links ]
Zhu, X. and D. Liu. 2015. Improving forest aboveground biomass estimation using seasonal Landsat NDVI time-series. ISPRS Journal of Photogrammetry and Remote Sensing 102: 222 - 231. doi: 10.1016/j. isprsjprs.2014.08.014 [ Links ]
Received: October 25, 2016; Accepted: December 10, 2016
 Este es un artículo publicado en acceso abierto bajo una licencia Creative Commons
