


Servicios Personalizados
Revista
Articulo
 texto en
  Inglés (pdf)
 Artículo en XML
 Referencias del artículo
 Enviar artículo por email
Indicadores
-
 Citado por SciELO
 -
 Accesos
Links relacionados
-
 Similares en
SciELO
Similares en
SciELO
Compartir

 Permalink
Revista mexicana de ciencias agrícolas
versión impresa ISSN 2007-0934
Rev. Mex. Cienc. Agríc vol.10 no.6 Texcoco sep. 2019 Epub 02-Oct-2020
https://doi.org/10.29312/remexca.v10i6.1688
Articles
Cold hours decrease as a result of climate change in Mexico
1Campo Experimental Zacatecas-INIFAP. Carretera Zacatecas-Fresnillo km 24.5, Calera, Zacatecas. CP. 98500. Tel. 01(800) 0882222, ext. 82306. (casas.israel@inifap.gob.mx).
2Campo Experimental Costa de Hermosillo-INIFAP. Pascual Encinas Félix núm. 72, Col. La Manga, Hermosillo, Sonora. CP. 83220. Tel. 01(800) 0882222, ext. 81322. (grageda.jose@inifap.gob.mx).
3Centro Universitario de Ciencias Biológicas y Agropecuarias-Universidad de Guadalajara. Camino Ing. Ramón Padilla Sánchez núm. 2100, Predio Las Agujas, Nextipac, Zapopan, Jalisco. CP. 45510. (arielcajeme@hotmail.com).
4Campo Experimental Pabellón-INIFAP. Carretera Aguascalientes-Zacatecas km 32.5, Pabellón de Arteaga, Aguascalientes. CP. 20660. Tel. 01(800) 0882222, ext. 82525. (rodriguez.victor@inifap.gob.mx).
5Campo Experimental Centro-Altos de Jalisco -INIFAP. Carretera Tepatitlán-Lagos de Moreno km 8, Tepatitlán de Morelos, Jalisco. CP. 47600. Tel. 01(800) 0882222, ext. 84503. (delamora.celia@inifap.gob.mx).
In Mexico, deciduous fruit trees are grown in the center and north of the country where the temperature, at the end of autumn and during winter, is low enough for defoliation of trees to occur and lethargy occur during winter. Global warming, as an effect of climate change, has the potential to reduce the cold available in the winter and affect the production of deciduous fruit trees. The objective of this work was to know the effect of climate change, on the accumulation of cold hours in the winter period. A historical analysis was carried out on the variation of the number of cold hours (HF) and a similar analysis in the climatic scenarios 2030, 2050 and 2070 in the 4.5 and 8.5 CPR. Both the historical analysis and the scenarios were the effects of climate change, which will be unfavorable for the cultivation of fruit trees with a temperate climate. Global warming will cause a decrease in the surface with accumulation of 600 to 800 HF of 11.7, 25.8 and 33% in climatic scenarios 2030, 2050 and 2070 of 4.5 CPR, respectively and up to 99.5% of the surface with accumulation of 800 to 900 HF in the 2070 climate of 8.5 CPR. On the other hand, the area with little accumulation of HF (50 to 200) will increase 11.5, 29.3 and 36.4% in the 2030, 2050 and 2070 climatic scenarios of the 4.5 CPR, respectively. The cultivation of deciduous fruit trees in the future will be limited by the decrease in HF, mainly in areas with greater accumulation of cold, in the same way can be affected the crops of the autumn-winter cycle such as cereals.
Keywords: CPR; deciduous fruit trees; global warming; historical trend
En México los frutales caducifolios se cultivan en el centro y norte del país donde la temperatura, al final del otoño y durante el invierno, es baja para que ocurra una defoliación de los árboles y presenten un letargo durante el invierno. El calentamiento global, como efecto del cambio climático, tiene el potencial de reducir el frío disponible en el invierno y afectar la producción de los árboles frutales caducifolios. El objetivo de este trabajo fue conocer el efecto del cambio climático, sobre la acumulación de horas frío en el periodo de invierno. Se realizó un análisis histórico sobre la variación del número de horas frío (HF) y un análisis similar en los escenarios climáticos 2030, 2050 y 2070 en los RCP 4.5 y 8.5. Tanto en el análisis histórico como en los escenarios se encontraron efectos del cambio climático, el cual será desfavorable para los frutales de clima templado. El calentamiento global provocará una disminución de la superficie con acumulación de 600 a 800 HF de 11.7, 25.8 y 33% en los escenarios climáticos 2030, 2050 y 2070 del RCP 4.5, respectivamente y hasta 99.5% la superficie con acumulación de 800 a 900 HF en el clima 2070 del RCP 8.5. En cambio, la superficie con poca acumulación de HF (50 a 200) aumentará 11.5, 29.3 y 36.4% en los escenarios climáticos 2030, 2050 y 2070 del RCP 4.5, respectivamente. Los frutales caducifolios en el futuro se verán limitado por la disminución de HF, en las áreas con mayor acumulación de frío, de igual manera pueden ser afectados los cereales de otoño-invierno.
Palabras clave: calentamiento global; frutales caducifolios; tendencia histórica; RCP
Introduction
In Mexico, deciduous fruit trees are grown in the center and north of the country where the temperature, at the end of autumn and during winter, is low enough for defoliation of trees to occur and lethargy occur during winter. Once the trees reach lethargy, the accumulation of cold begins during the winter, which is indispensable for flowering in the spring and beginning of a new vegetative and reproductive cycle. This particularity of deciduous fruit trees has forced us to look for ecological niches that allow the proper development of crops such as apricots, plums, peaches, apple trees and vines, among others (Martínez, 2012; Zegbe et al., 2016).
Global warming has the potential to reduce the cold available in the winter and affect the production of deciduous fruit trees. Several researchers have predicted the decrease in the accumulation of cold hours in various regions of the world, in future climatic scenarios, using general circulation models or other methodologies (Jindal and Mankotia, 2004; Baldocchi and Wong 2008; Luedeling et al., 2009a; Yu et al., 2010; Luedeling et al., 2011; Medina-García et al., 2011).
Currently, climate change represents one of the main problems facing agriculture, due to the alterations it causes in weather patterns (IPCC, 2014) due to the increase in the atmospheric concentration of greenhouse gases (GHG). Based on, scenarios that do not assume climate policies to reduce greenhouse gas emissions, the global average temperature is expected to rise between 2 and 5 °C by the end of this century (IPCC, 2014), this directly affects the agroclimatology related to the management of agricultural activities (Ruiz-Corral et al., 2016).
The temperature of the agricultural areas of Mexico has been increasing significantly since the nineties of the last century (Ruiz et al., 2010; Zarazua-Villaseñor et al., 2011a), this increase in temperature brings modifications in agroclimatic variables (Zarazua-Villaseñor et al., 2011b) such as the accumulation of cold in the winter period (Medina-García et al., 2011; Santillán-Espinoza et al., 2011).
The action exerted by the low temperatures is not always harmful, because the deciduous species require a period of cooling necessary for the optimal development of both vegetative and reproductive buds (Warmund and Krumme, 2005; Luedeling et al., 2009a). However, in subtropical climates the lack of cold in the winter causes an erratic and irregular sprouting, with the consequent reduction in the quantity and quality of the fruit (Ramírez et al., 2011; Medina-García et al., 2014), this indicates that the cold requirement in deciduous fruit species is a decisive factor in adapting these species to their environment.
The conventional method (Weinberger, 1950) is the most widely used cold quantification method, contemplating the daily sum of hours at which the temperature is between 0 and 7.2 °C during the autumn and winter (Pérez et al., 2008; Okie and Blackburn, 2011). With this method the cold requirements of various fruit trees have been established, relating the accumulation of cold hours with the regular sprouting of the tree. This is a standard value that is still used.
In order to achieve adequate planning of agricultural development in the short and medium term in a region, it is necessary to estimate in future climatic scenarios, the availability of agroclimatic resources, including the accumulation of cold, to have enough information and to design and implement adaptation measures that avoid or minimize as much as possible the negative impacts of climate change (Medina-García et al., 2014).
Materials and methods
Data from the weather stations of the National Meteorological Service of the Mexican Republic were used. 2 854 stations with more than 20 years and more than 90% of data in the period from 1961 to 2010 distributed throughout the country were selected. With the daily maximum and minimum temperature data, hourly data (Snyder, 1985) were obtained from the entire historical series of station data. With these data, the number of hours in which the temperature was between 0 and 7.2 °C, on each day, corresponding to the cold hours (HF) according to Weinberger (1950) was estimated. The HF number was added for each of the months of the winter season (November to February) for each of the years of the series of each season.
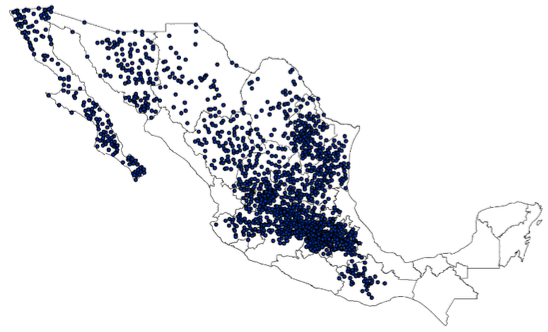
For the analysis of historical trends of HF, only stations with accumulation of at least 50 HF in the entire winter period on average throughout the series were selected, resulting in 1688 stations that met this requirement (Figure 1). Historical trends were analyzed for each month and for the entire winter period using 20-year moving averages. To corroborate the trends of the moving averages, the non-parametric Mann-Kendal test (Mann, 1945; Kendall, 1975) was used, since it is considered the most appropriate for the analysis of trends in weather time series (Miro et al., 2009; Ahmed et al., 2014; de Melo et al., 2015) and was complemented by the Sen estimate of the slope of the trend (Sen, 1968) for this the Makesens macro was used, developed at the Finish Meteorological Institute (Salmi et al., 2002).
To generate maps with the number of HF from the average monthly minimum temperature, models were obtained for each month taking as an independent variable the average minimum temperature and as a dependent variable the accumulated HF in the corresponding month, using the 2 854 stations initially selected. One of the most observed growth patterns in natural populations is known as logistic growth and is represented with a sigmoid curve.
In this model there is an establishment phase in which population growth is relatively slow, followed by an acceleration phase, then the growth rate becomes slower and finally stabilizes (Ibarra and Rodríguez, 2010). When plotting the HF data, a logistic behavior was observed, so different sigmoid models were tested to adjust the data.
To estimate the effect of climate change on the number of HF, an assembly model was integrated based on the median value of 11 general circulation models (MCGs) reduced in scale and calibrated (Walton et al., 2013) and belonging to CMIP5 (Intercomparison of coupled models phase 5) reported in the 5th installment of the IPCC: (BCC-CSM1-1, CCSM4, GISS-E2-R, HadGEM2-AO, HadGEM2-ES, IPSL-CM5A-LR, MIROC-ESM-CHEM , MIROC-ESM, MIROC5, MRI-CGCM3, NorESM1-M), which were obtained from information from the WorldClim Global Change data portal.
The assembly was generated under two representative routes of concentration (CPR) of greenhouse gases, that is, an intermediate emission CPR (4.5) was used which is consistent with a future with relatively ambitious emission reduction and a high emission CPR (8.5), which is consistent with a future without policy changes to reduce emissions (Van Vuuren et al., 2011).
The monthly values of the assembly of the 11 monthly average minimum temperature models of the years 2021 to 2080 were used, for the scenarios 2021-2040, 2041-2060 and 2061-2080, hereinafter referred to as climates or years 2030, 2050 and 2070 respectively. The same variable was taken as the base or reference climate in the 1961-2010 period of the INIFAP climate information system (Ruiz-Corral et al., 2016). Thematic raster images were generated with a resolution of 30” arc, corresponding to the monthly minimum temperature values of the base climate and the scenarios, for the months of November to February. Finally, according to the results obtained, some adaptation measures to the climatic scenarios studied are proposed.
Results and discussion
Historical trends
To validate the estimation of the hourly temperature data, they were adjusted to a linear regression model with real hourly data, resulting in R2= 0.9, complying with the assumptions of 1:1 validation; that is, the intercept was statistically equal to zero and the slope statistically equal to one (Fritz et al., 1997).
With the HF of each of the months of the winter season, historical trends analyze were made from 1961 to 2010 with moving averages every 20 years, considering 1 688 stations (Figure 2). The number of HF in the month of November presents a tendency to decrease (p≤ 0.0001); that is, the average number of HF this month in Mexico has decreased 11.8 h in the 50 years of study, 0.24 h per year (Figure 2A).
The historical trend of the average number of HF in the month of December is on average slightly towards the increase; that is, the number of HF in the 50 years of study has increased 1, 0.02 h per year; however, the model was not significant (p= 0.3718) (Figure 2B). This behavior is due to the fact that in December there was, in general, less accumulation of HF in the period from 1976 to 1995, and then return to normal or slightly greater accumulation of HF (Figure 2B). Figure 2C shows the trend of HF in the month of January, which is towards the decrease (p≤ 0.0001), which has caused a loss of 15.2 HF in 50 years.
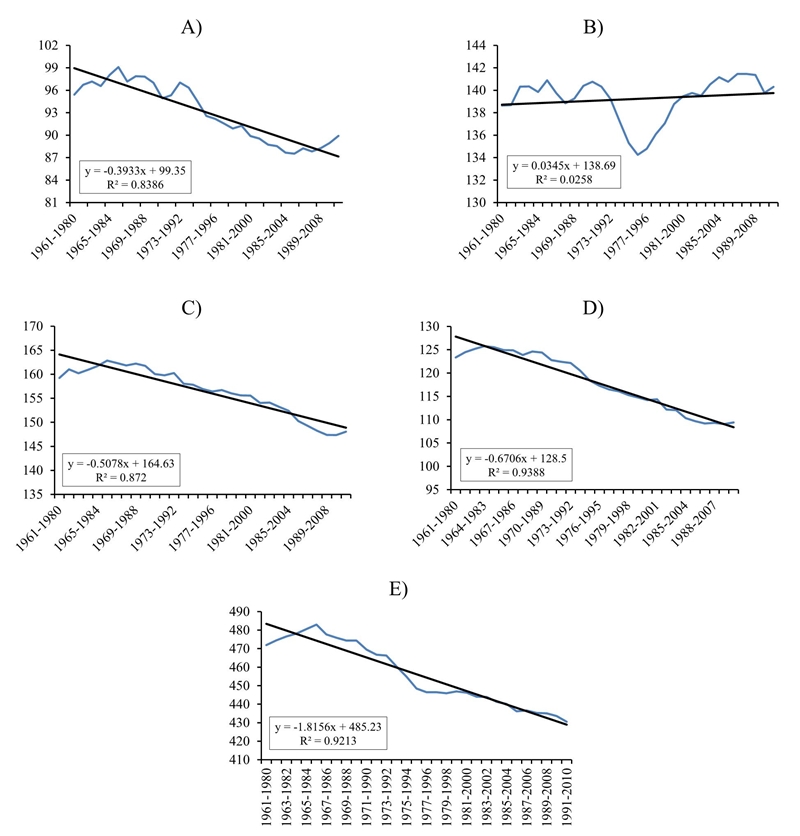
Figure 2 Historical trend of the HF number (0 to 7.2 °C). A) November; B) December; C) January; D) February; and E) for accumulated FH from November to February in Mexico. The units of the horizontal axis are years (periods of 20 years) and the units of the vertical axis are number of HF.
The historical trend of the average number of HF in the month of February is also downward (p≤ 0.0001), with an average decrease of 20.1 HF in 50 years (Figure 2D). Finally, Figure 2E shows the trend of the average number of HF in the winter period from November to February (p≤ 0.0001) and is downward, with an average decrease of 45.3 HF in the period from 1961 to 2010. There is clearly an effect of climate change when presenting the analysis of historical trends in three of the four months and the accumulated winter period a decrease in the number of HF, which has an unfavorable effect on the production of temperate climate fruit trees (Medina-García et al., 2011; Ramírez et al., 2011).
The analysis of historical trends with the Mann-Kendall test reflected results similar to moving averages. In the four months and the accumulated, the trends were the same, November, January, February and November-February with a negative trend and December with a positive trend, although in all chaos with slightly lower slope values. The significance was the same, except in November where it was not significant with this test (Table 1).
Table 1 Mann-Kendall trend test and Sen slope estimate for HF per month and accumulated in the November-February winter season.
| Mann-Kendall trend | Estimated slope Sen | ||||
| Series | Z statistic | Significance | Pending (Q) | Constant (B) | |
| January | -2.23 | * | -0.279 | 162.558 | |
| February | -3.26 | ** | -0.422 | 128.366 | |
| November | -0.45 | ns | -0.064 | 96.002 | |
| December | 1.24 | ns | 0.177 | 136.582 | |
| November-February | -1.76 | * | -0.647 | 525.151 | |
Level of significance 90% (*); 95% (**); 99% (***); ns (not significant).
Luedeling et al. (2009b)) found in the Arabian Península decreases in the accumulation of cold (0 to 7.2 °C), in the order of 1.02 to 9.05 h year between 1983 and 2008, in Mexico there was also a decrease in cold, but in the order of 0.91 HF/year in the period 1961-2010, which corresponds to the lower limit of these authors. With this loss trend of 9 HF/decade, in the near future the production of the species that require cold could become marginal or impossible, as indicated by Grageda et al. (2016) for walnut.
HF estimation models
For the analysis of future climatic scenarios, it is necessary to generate maps with the average number of HF for each month, for this, monthly models were obtained to estimate the HF from the average minimum temperature using the 2 854 stations initially selected. The models that best fit the dispersion of the data (Figure 3), were the logistic models of three parameters. The four models presented values of R2= 0.95 which indicates a very good fit. Table 2 shows the models for the four months.
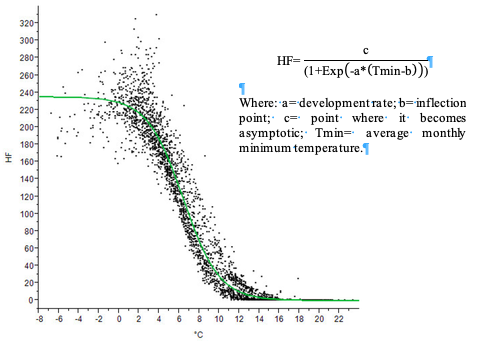
Table 2 Logistic models of three parameters to estimate the HF of each of the months of the winter period from the average minimum temperature.
| Month | Growth rate | Point of inflection | Asymptote | R2 |
| November | -0.505918 | 6.190316 | 220.81403 | 0.959637 |
| December | -0.539329 | 6.386607 | 231.75049 | 0.952652 |
| Enero | -0.55736 | 6.406391 | 235.2206 | 0.948577 |
| January | -0.532459 | 6.147172 | 211.53101 | 0.955979 |
Climatic scenarios
With the models obtained and using the geographic information system Idrisi Selva (Eastman, 2012), national images of HF were generated for the four months of the winter season for the base climate (1961-2010) and for the climates 2030, 2050 and 2070 in each of the 4.5 and 8.5 CPR.
In the Figure 4A shows the maps with the average HF number in the winter period (November to February) in the Mexican Republic. At the moment the fruit trees of temperate climate are cultivated mainly in the zones that have between 600 to 900 HF, according to the map of Figure 4A, the apple tree is cultivated mainly in the zones of 800 to 900 HF, other fruit trees such as peach, plum and apricot are also grown in that same range of HF, but also in areas of 600 to 800 HF.
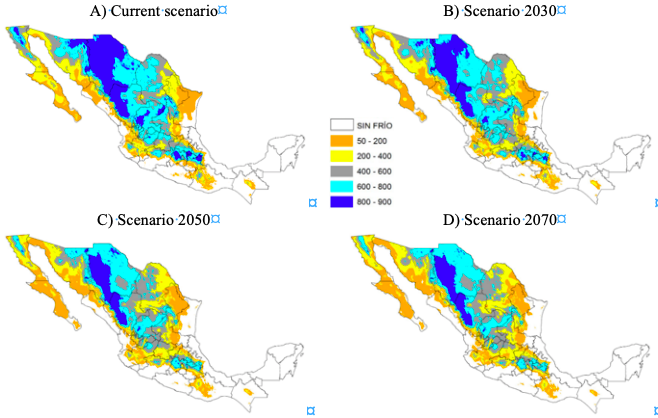
Figure 4 Average HF number in the winter period (November to February) in the current scenario and in three future climate scenarios of the 4.5 CPR, in the Mexican Republic.
In the 2030 climate scenario of 4.5 CPR (Figure 4B) the surface of the ranges without cold, 50-200, 200-400 and 400 to 600 HF increases 10.0, 11.5, 5.1 and 12.1%, respectively (Table 3) with respect to the current scenario; that is, the area with less cold accumulation, where temperate climate fruit trees are not grown, is likely to increase, while the surface with greater cold accumulation, where temperate climate fruit trees are grown, shows a decrease in the 600 range -800 HF of 11.7% and in the range of 800-900 HF a decrease of 30.5%.
Table 3 Percentage of change of the surface with HF in the winter season (November to February) in future climatic scenarios with respect to the current scenario in the Mexican Republic.
| HF | RCP 4.5 | RCP 8.5 | |||||
| 2030 | 2050 | 2070 | 2030 | 2050 | 2070 | ||
| Without cold | 10 | 18.7 | 23.9 | 18.8 | 40.2 | 56.1 | |
| 50-200 | 11.5 | 29.3 | 36.4 | 27.1 | 43.5 | 59.8 | |
| 200-400 | 5.1 | 14.9 | 14.7 | 16.2 | 42.6 | 60 | |
| 400-600 | 12.1 | 16.1 | 14.1 | 29.2 | 34.3 | -9.6 | |
| 600-800 | -11.7 | -25.8 | -33 | -26.4 | -67.9 | -78.3 | |
| 800-900 | -30.5 | -57.1 | -61.6 | -68.6 | -94 | -99.5 | |
In the 2050 climate of 4.5 CPR (Figure 4C), the surface of the ranges without cold, 50-200, 200-400 and 400 to 600 HF and the surface with the greatest accumulation of cold (600-800 and 800-900 HF), they present a similar trend to the 2030 climate but more pronounced, so the surface of the 50-200 HF range is likely to increase 29.3% and the area of the 800-900 HF range is likely to decrease 57.1% (Figure 4C and Table 3).
Figure 4D shows the map of the HFs in the 2070 climate of the 4.5 CPR, as in the climates described above, the percentage of the area with less cold accumulation will increase up to 36.4% in the range 50-200 HF while, the percentage of surface area with the greatest accumulation of cold will decrease to 61.6% in the 800-900 HF range (Figure 4D and Table 3).
The areas of high cold accumulation (600-800 and 800-900 HF) will have a strong reduction as the scenarios move forward into the future, especially in areas of the Sierra de Baja California, Sierra Madre Occidental, its adjacent states such as Sonora, Chihuahua, Coahuila, Durango, Zacatecas and Aguascalientes and areas of the Neo Volcanic axis, so it is possible that in those regions a reduction in the suitability of the agricultural surface for temperate fruit trees as indicated by Medina et al. (2011) in the Chihuahua region of Chihuahua.
The reduction in HF is due to the increase in temperature, which coincides with that indicated by Cavazos et al. (2012), in the sense that it will be convenient to use temperate varieties of fruit trees with a lower HF requirement.
Figure 5A shows the maps with the average HF number in the winter period (November to February) in the Mexican Republic. In the 2030 climate of 8.5 CPR (Figure 5B) the surface of the ranges without cold, 50-200, 200-400 and 400 to 600 HF increases 18.8, 27.1, 16.2 and 29.2% (Table 3), respectively, with respect to current scenario; that is, the surface with less cold accumulation, where temperate climate fruit trees are not grown, is likely to increase, while the surface with greater cold accumulation, where most temperate fruit trees are grown, has a decrease in the 600-800 HF range of 26.4% and in the 800-900 HF range a decrease of 68.6%.
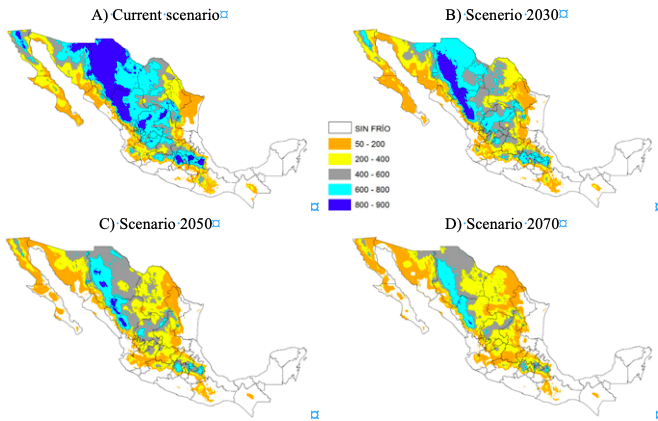
Figure 5 Average HF number in the winter period (November to February) in the current scenario and in three future climatic scenarios of the 8.5 CPR, in the Mexican Republic.
In the 2050 climate of 8.5 CPR (Figure 5C) the surface of the ranges without cold, 50-200, 200-400 and 400 to 600 HF and the surface with greater accumulation of cold (600-800 and 800-900 HF), they present a similar trend to the 2030 climate but more pronounced, so the surface of the 50-200 HF range is likely to increase 40.2% and the surface of the 800-900 HF range is likely to decrease to 94.0% (Figure 4C and Table 3).
Figure 5D shows the map of the HFs in the 2070 climate of 8.5 CPR, as in the climates described above, the percentage of the area with less cold accumulation will increase up to 60.0% in the range 200-400 HF, while, the percentage of surface area with the greatest accumulation of cold will decrease to 99.5% in the 800-900 HF range, it will practically disappear (Figure 5D and Table 3). In this last scenario, practically only in the Sierra Madre Occidental and in some small areas of the neo-volcanic axis it is likely that they accumulate between 600 and 800 HF.
In general, in 4.5 and 8.5 CPR, the same surface reduction and increase behavior is presented in the different ranges of HF, but in 8.5 CPR the increases or decreases are more drastic, this is because this is a scenario of high emissions of GHG; that is, in this scenario there are no policy changes to reduce emissions (Van Vuuren et al., 2011), so with higher GHG emissions there will be greater greenhouse effect and greater temperature increase according to the 8.5 CPR model.
These results are consistent with those found by Baldochi and Wong (2008) in California whereby the year 2100 they expect 500 hours less cold in the winter period. Similarly, Luedeling et al. (2009a) found similar results for California and for the Arabian Península (Luedeling et al., 2009 b). This author also tested different cold estimation models in California and in all cases, he found a decrease in winter cold (Luedeling et al., 2009c). Similar results were found in Mexico in the Chihuahua area of Chihuahua (Medina-García et al., 2011, Ramírez et al., 2011) and in peach (Ramírez-Legarreta et al., 2008; Medina-García et al., 2014).
If the reduction in HF, as observed in all scenarios, is due to the increase in temperature, probable effects on autumn-winter crops will be observed in the future, not only fruit trees with a mild climate, which could even disappear from this cycle in some regions, which would especially affect those species that require some vernalization time, such as wheat, which is one of the main crops in this cycle. It is known that HF lengthen phenological periods by reducing the speed with which physiological processes are carried out and consequently retard growth. Winter wheat will experience a shortening of the sowing-flowering and flowering-physiological maturity stages, in response to the rapid accumulation of heat units (Felix et al., 2009; Zarazúa-Villaseñor et al., 2011a).
According to the above, it is necessary to initiate research in genetic improvement of annual crops and deciduous fruit trees to adapt to future conditions, because climate change is not a phenomenon that is about to happen, but is already happening, such as it was demonstrated by retrospective climate analysis studies in agricultural areas of the country conducted by Ruiz et al. (2000); Zarazúa-Villaseñor et al. (2011a); Medina-García et al. (2011); Medina-García et al. (2017).
Conclusions
An unfavorable effect of global warming was observed in the historical period 1961-2010 by decreasing on average for the entire country 11.8 HF in the month of November, 15.2 HF in the month of January and 20.1 HF in the month of February, only in the month December increased on average 1 HF. Considering the entire winter period from November to February, there has been an average decrease of 45.3 HF in the 50 years of study.
The areas of high cold accumulation (600-800 and 800-900 HF) will have a strong reduction as progress is made in the scenarios towards the future, especially in areas of the Sierra de Baja California, Sierra Madre Occidental and areas of the Neo Volcanic axis, so it is possible that in those regions a reduction in the suitability of the agricultural surface for temperate fruit trees and some crops of the autumn-winter cycle is initiated.
Considering the effects of global warming on future climate scenarios in 4.5 and 8.5 CPR, the area with the highest accumulation of HF is decreasing towards the future, which will have an impact on the lack of cold in the winter causing an erratic and irregular sprouting, with the consequent reduction in the quantity and quality of the fruit, so the cold requirements in deciduous fruit species must be taken into account in adapting to climate change.
The results of this study can contribute to the design of strategies, to face climate change in the fruit-producing areas of temperate climate in Mexico, such as the generation of new varieties with lower HF requirements.
Literatura citada
Ahmed, S. I.; Rudra, R.; Dickinson, T. and Ahmed, M. 2014. Trend and periodicity of temperature time series in Ontario. Am. J. Climate Change. 3:272-288. [ Links ]
Baldocchi, D. and Wong, S. 2008. Accumulated winter chill is decreasing in the fruit growing regions of California. Climatic Change. 87(1):153-166. [ Links ]
Cavazos, P. M. T.; Lizárraga, P. M. L.; Hernández, M. R.; Kretschmar, T.; Pavía, E. G.; Valenzuela, E.; Rodríguez, M. V. M.; Espinoza, T. B. E.; Rete, C. A. y Figueroa, Y. G. 2012. Situación actual y bajo escenarios de cambio climático de la industria vitivinícola de Baja California, México. Reporte Final del Proyecto. Instituto Nacional de Ecología (INE) y CICESE. Ensenada, BC. 75 p. [ Links ]
Eastman, J. R. 2012. IDRISI selva manual. Clark labs - Clark University. Worcester, Mass. USA. 322 p. [ Links ]
Félix, V. P.; Ortíz, E. J. E.; Fuentes D. G.; Quintana, Q. J. G. y Grageda, G. J. 2009. Horas frío en relación al rendimiento de trigo: Áreas de producción del estado de Sonora. Folleto técnico núm. 63. INIFAP-CIRNO-CEVY. Cd. Obregón, Sonora, México. 40 p. [ Links ]
Fritz, J. O.; Vanderlip, R. L.; Heiniger, R. W. and Abelhalim, A. Z. 1997. Simulating forage sorghum yields with SORKAM. Agron. J. 89:64-68. [ Links ]
Grageda, G. J.; Ruiz, C. J. A.; García, R. G. E; Núñez, M. J. H.; Valenzuela, L. J.; Ruiz Á. O. y Jiménez, L. A. 2016. Efecto del cambio climático en la acumulación de horas frío en la región nogalera de Hermosillo, Sonora. Rev. Mex. Cienc. Agríc. 13(Pub. Esp.):2487-2495. [ Links ]
Ibarra, U. J. T. y Rodríguez, C. J. 2010. El modelo logístico: una alternativa para el estudio del crecimiento poblacional de organismos. Rev. Elec. Veterinaria. 11(3):1695-7504. [ Links ]
IPCC. 2014. Intergovernmental Panel on Climate Change. Climate Change 2014: synthesis report. Contribution of working groups i, ii and iii to the fifth assessment report of the intergovernmental panel on climate change [core writing team. Pachauri, K. R. and Meyer, L. A. (Eds.)]. IPCC, Geneva, Switzerland. 151 p. [ Links ]
Jindal, K. K. and Mankotia, M. S. 2004. Impact of changing climatic conditions on chilling units, physiological attributes and productivity of apple in western Himalayas. Acta Hortic. 662:111-117. [ Links ]
Kendall, M. G. 1975. Rank correlation methods. 4th Edition, Charles Griffin, London. 202 p. [ Links ]
Luedeling, E.; Gebauer, J. and Buerkert, A. 2009b. Climate change effects on winter chill for tree crops with chilling requirements on the Arabian Peninsula. Climatic Change. 96(1-2):219-237. [ Links ]
Luedeling, E.; Girvetz, E. H.; Semenov, M. A. and Brown, P. H. 2011. Climate change affects winter chill for temperate fruit and nut trees. PLoS ONE. 6(5):20155-1371. [ Links ]
Luedeling, E.; Zhang, M. and Girvetz, E. H. 2009a. Climatic changes lead to declining winter chill for fruit and nut trees in California during. PLoS ONE 4(7):1950-2099. e6166. [ Links ]
Luedeling, E.; Zhang, M.; Luedeling, V. and Girvetz, E. H. 2009c. Sensitivity of winter chill models for fruit and nut trees to climatic changes expected in California’s Central Valley. Agric. Ecosys. Environ. 133(1):23-31. [ Links ]
Mann, H. B. 1945. Non-parametric test against trend. Econometrica. 13(3):245-259. [ Links ]
Martínez, D. G. 2012. La brotación de la vid en Sonora. INIFAP-CIRNO-CECH. Hermosillo, Sonora. Folleto técnico núm. 44. 26-27 pp. [ Links ]
Medina, G. G.; Mena, C. J.; Ruiz, C. J. A.; Rodríguez, M. V. M. y Soria, R. J. 2017. El cambio climático afecta el número de horas del rango térmico del chile (Capsicum annuum L.) en el Norte-Centro de México. Rev. Mex. Cienc. Agríc. 8(8):1797-1812. [ Links ]
Medina, G. G.; Ruiz, C. J. A.; Ramírez, L. M. R. y Díaz, P. G. 2011. Efecto del cambio climático en la acumulación de frío en la región manzanera de Chihuahua. Rev. Mex. Cienc. Agríc. 2(Pub. Esp.):195-207. [ Links ]
Medina, G. G.; Ruiz, C. J. A.; Zegbe, D. J. A.; Soria, R. J.; Rodríguez, M. V. y Díaz, P. G. 2014. Impacto potencial del cambio climático en la región productora de durazno en Zacatecas, México. Rev. Mex. Cienc. Agríc. 10(Pub. Esp.):1939-1950. [ Links ]
Melo, T. M.; Louzada, J. A. S. and Pedrollo, O. C.; 2015. Trends in Extreme Indices and Seasonal Analysis of Precipitation and Temperature in the Northwest Region of Rio Grande do Sul, Brazil. American Journal of Climate Change. 4:187-202. [ Links ]
Miró, J.; Estrela, M. J.; Pastor, F. y Millán, M. 2009. Análisis comparativo de tendencias en la precipitación, por distintos inputs, entre los dominios hidrológicos de la Segura y del Júcar. Investigaciones Geográficas. 49:129-157. [ Links ]
Okie, W. R. and Blackburn, B. 2011. Increasing chilling reduces heat requirement for floral budbreak in peach. Hortscience. 46(2):245-252. [ Links ]
Pérez, F. J.; Ormeño, N. J.; Reynaert, B. and Rubio, S. 2008.Use of the dynamic model for the assessment of winter chilling in a temperate and a subtropical climatic zone of Chile. Chilean J. Agric. Res. 68(2):198-206. [ Links ]
Ramírez, L. M. R.; Jacobo, C. J. L.; Gardea, B. A. A. y Parra, Q. R. A. 2008. Modelo de desarrollo floral en manzanos [Malussylvestris (L.) Mill. var. Domestica (Borkh) Mansf.] Red Delicious y Golden Delicious como herramienta de toma de decisiones en el manejo integrado de enfermedades. Rev. Mex. Fitopatol. 26(2):153-163. [ Links ]
Ramírez, L. M. R.; Ruiz, C. J. A.; Medina, G. G.; Jacobo, C. J. L.; Parra, Q. R. A.; Ávila, M. M. R. y Amado, A. J. P. 2011. Perspectivas del sistema de producción de manzano en Chihuahua, ante el cambio climático. Rev. Mex. Cienc. Agríc. 2(Pub. Esp.):223-237. [ Links ]
Ruiz, C. J. A.; Medina, G. G.; Manríquez, O. J. D. y Ramírez, D. J. L. 2010. Evaluación de la vulnerabilidad y propuestas de medidas de adaptación a nivel regional de algunos cultivos básicos y frutales ante escenarios de cambio climático. Informe Final de Proyecto INIFAP-INE. Guadalajara, Jal. 108 p. [ Links ]
Ruiz, C. J. A.; Medina, G. G.; Rodríguez, M. V. M.; Sánchez, G. J. J.; Villavicencio, G. R.; Durán, P. N.; Grageda, G. J. y García, R. J. E. 2016. Regionalización del cambio climático en México. Rev. Mex. Cienc. Agríc. 13(Pub. Esp.):2451-2464. [ Links ]
Ruiz, C. J. A.; Ramírez, D. J. L.; Flores, M. F. J. y Sánchez, G. J. J. 2000. Cambio climático y efectos sobre las áreas potenciales para maíz en Jalisco, México. Rev. Fitotec. Mex. 23(2):183-194. [ Links ]
Salmi, T.; Maatta, A.; Anttila, P.; Ruoho, A. T. and Amnell, T. 2002. Detecting trends of annual values of atmospheric pollutants by the Mann-Kendall test and Sen’s slope estimates- the Excel template application MAKESENS. Finnish Meteorological Institute, Air Quality Research. Publications on Air Quality No. 31. Report code FMI-AQ-31. 35 p. [ Links ]
Santillán, E. L. E.; Blanco, M. F.; Magallanes, Q. R.; García, H. J. L.; Cerano, P. J.; Delgadillo, R. O. y Valdez, C. R. D. 2011. Tendencias de temperaturas extremas en Zacatecas, México. Rev. Mex. Cienc. Agríc. 2(2):207-219. [ Links ]
Sen, P. K. 1968. Estimates of the regression coefficient based on Kendall’s Tau. J. Am. Statistical Association. 63(324):1379-1389. [ Links ]
Snyder, R. L. 1985. Hand calculating degree-days. Agric. For. Meteorol. 35(4):353-358. [ Links ]
Van, V. D. P.; Edmonds, J.; Kainuma, M.; Riahi, K.; Thomson, A.; Hibbard, K.; Hurtt, G. C.; Kram, T; Krey, V.; Lamarque, J. F. and Masui, T. 2011. The representative concentration pathways: an overview. Climatic Change. 109(1):5-31. [ Links ]
Walton, D.; Meyerson, J. and Neelin, J. D. 2013. Accessing, downloading, and viewing CMIP5 Data. Earth System Grid Federation. 25 p. [ Links ]
Warmund, M. R. and Joan, K. 2005. A chilling model to estimate rest completion of erect blackberries. HortSci. 40(5):1259-1262. [ Links ]
Weinberger, J. H. 1950. Chilling requirement of peach varieties. Proc. Amer. Soc. Hort. Sci. 56:122-128. [ Links ]
Yu, H.; Luedeling, E. and Xu, J. 2010. Winter and spring warming result in delayed spring phenology on the Tibetan Plateau. PNAS. 107(XX):22151-22156. [ Links ]
Zarazúa, V. P.; Ruiz, C. J. A.; González, E. D. R.; Flores, L. E. H. y Ron, P. J. 2011a. Cambio climático y agroclimático para el ciclo otoño-invierno en la región Ciénega de Chapala. Rev. Mex. Cienc. Agríc. 2(Pub. Esp.):295-308. [ Links ]
Zarazúa, V. P.; Ruiz, C. J. A.; González, E. D. R.; Flores, L. H. E. y Ron, P. J. 2011b. Impactos del cambio climático sobre la agroclimatología del maíz en Ciénega de Chapala, Jalisco. Rev. Mex. Cienc. Agríc. 2(Pub. Esp.):351-363. [ Links ]
Zegbe, D. J. A.; Mena, C. J.; Medina, G. G.; Serna, P. A. y Echavarría, C. F. 2016. Cultivos frutícolas. Capítulo 3. In: Medina, G. G.; Zegbe, D. J. A.; Reveles, H. M.; Mena, C. J.; Reveles, T. L. y Echavarría, Ch. F. G. (Comp.). Libro técnico núm. 16. INIFAP-CIRNOC. Campo Experimental Zacatecas. 253-387 pp. [ Links ]
Received: June 01, 2019; Accepted: August 01, 2019
 Este es un artículo publicado en acceso abierto bajo una licencia
Creative Commons
Este es un artículo publicado en acceso abierto bajo una licencia
Creative Commons
