


Servicios Personalizados
Revista
Articulo
 texto en
  Inglés (pdf)
 Artículo en XML
 Referencias del artículo
 Enviar artículo por email
Indicadores
-
 Citado por SciELO
 -
 Accesos
Links relacionados
-
 Similares en
SciELO
Similares en
SciELO
Compartir

 Permalink
Revista mexicana de ciencias agrícolas
versión impresa ISSN 2007-0934
Rev. Mex. Cienc. Agríc vol.10 no.3 Texcoco abr./may. 2019 Epub 30-Mar-2020
https://doi.org/10.29312/remexca.v10i3.1514
Articles
Fixation of color in grain and physical, technological and nutraceutical characteristics in corn Elotes Occidentales
1Campo Experimental Centro Altos Jalisco-INIFAP. Biodiversidad núm. 2470, Tepatitlán de Morelos, Jalisco. AP. 56. CP. 47600. Tel. 01 (800) 0882222, ext. 84520 y 84501. (gbal.mtz@gmail.com; yolasm@gmail.com).
2Departamento de Desarrollo Rural Sustentable e Instituto de Manejo y Aprovechamiento de Recursos Fitogenéticos (IMAREFI)-Centro Universitario de Ciencias Biológicas y Agropecuarias (CUCBA)-Universidad de Guadalajara. Camino Ing. Ramón Padilla Sánchez núm. 2100, Predio Las Agujas, Nextipac, Zapopan, Jalisco, México. CP. 45510. Tel. 01(333) 777150, ext. 33016 y 33190. (linocucba@hotmail.com).
The Elotes Occidentales corn race has grains with anthocyanin pigmentation that have antioxidant capacity and are used to make pozole. The objective was to determine the effect of fixing and standardizing the color of the grain, and the evaluation of physical characteristics, technological variables and nutraceutical composition in corn of a population of the Elotes Occidentales race. The crop was established in the experimental field of the University Center of Biological and Agricultural Sciences of the University of Guadalajara, in Zapopan, Jalisco, Mexico, after selection by visual appreciation of color of the grain in three intensities: clear, intermediate and dark, in the spring-summer 2013, fall-winter 2013-2014 and 2014-2015 cycles in which they self-pollinated. Grains of uniform color were selected and planted in spring-summer 2015 and autumn-winter 2016-2017, obtaining the final population by recombination in fraternal crosses by color. It is evaluated the physical characteristics, technological variables (for elaboration of pozole) and nutraceuticals (total anthocyanins, total soluble phenols and antioxidant capacity) in grain of the original and final populations, by means of a completely random design. The color of the grain of the final population presented uniformity and increased its intensity in the three subpopulations; however, in terms of grain size, anthocyanin content (27.41% difference) and antioxidant capacity, they were statistically lower (p≤ 0.05) than the original population. The physical and technological variables were appropriate for producing pozole. With the technique used to fix the color, no gain was obtained due to the effect of color on nutraceutical characteristics.
Keywords: Zea Mays L.; pigment; pozole
La raza de maíz Elotes Occidentales posee granos con pigmentación por antocianinas que tienen capacidad antioxidante y se utilizan para elaborar pozole. El objetivo fue determinar el efecto de fijar y uniformizar el color del grano, y la evaluación de características físicas, variables tecnológicas y de composición nutracéutica en maíz de una población de la raza Elotes Occidentales. El cultivo se estableció en el campo experimental del Centro Universitario de Ciencias Biológicas y Agropecuarias de la Universidad de Guadalajara, en Zapopan, Jalisco, México, previa selección por apreciación visual de color del grano en tres intensidades: claros, intermedios y oscuros, en los ciclos primavera-verano 2013, otoño-invierno 2013-2014 y 2014-2015 en que se autopolinizaron. Granos de color uniforme se seleccionaron y sembraron en primavera-verano 2015 y otoño-invierno 2016-2017, obteniendo la población final por recombinación en cruzas fraternales por color. Se evaluaron características físicas, variables tecnológicas (para elaboración de pozole) y nutracéuticas (antocianinas totales, fenoles solubles totales y capacidad antioxidante) en grano de las poblaciones original y final, mediante un diseño completamente al azar. El color del grano de la población final presentó uniformidad e incremento su intensidad en las tres subpoblaciones; sin embargo, el tamaño de grano, contenido de antocianinas (27.41% de diferencia) y en la capacidad antioxidante, fueron menores estadísticamente (p≤ 0.05) a la población original. Las variables físicas y tecnológicas fueron las apropiadas para elaborar pozole. Con la técnica utilizada para la fijación del color, no se obtuvo ganancia por efecto del color en características nutracéuticas.
Palabras clave: Zea Mays L.; pigmento; pozole
Introduction
Among the pigmented maize of high added value with potential for special uses in human nutrition, the Elotes Occidentales breed stands out, whose grains have mealy texture and size from medium to large (Salinas et al., 2013; Vázquez et al., 2014), so they are mainly destined to the consumption in the form of pozole and corn (Ron et al., 2006). In the nixtamalization, corn kernels with pigment in aleurone layer preserve their color, obtaining naturally dyed products with nutraceutical properties (Salinas-Moreno et al., 2003).
The Elotes Occidentales breed preferentially in states of western Mexico, although there is infiltration in cultivated maize in Guerrero, Oaxaca and Chiapas (Ron et al., 2006). In local markets, the red grain reaches a premium in relation to white grain maize used for the production of pozole (CONABIO, 2010). In the corn kernel the pericarp and aleurone tissues are able to biosynthesize and store anthocyanins (Espinosa et al., 2009; Ron-Parra et al., 2016), which have antioxidant capacity (Salinas et al., 2017) and they contribute to the prevention of cancer and antiradical activities (Rodríguez et al., 2013).
These pigments are important in the production of functional foods due to their nutraceutical characteristics (Salinas et al., 2017). In the Elotes Occidentales maize race there are grain accessions with purple, red and blue, due to the presence of anthocyanins in the aleurone layer (Ron et al., 2006). In order to obtain materials with the desirable characteristics for specific uses, in corn different methods of improvement have been developed to take advantage of the additive and dominance effects, among them that of autobrothers (Márquez, 1985), used for the fixation of convenient characters by increasing the proportion of genes in homozygous condition, which have a uniform appearance (Ron-Parra et al., 2016).
In works on pigment fixation, different methods have been used with phenotypic selection as a selection tool. Such is the case of Landi et al. (2008), that in F2 populations obtained by self-fertilization of a simple cross, they found that selection by color is effective for several grain traits; in the work of Lago et al. (2014), grains were selected according to the content of anthocyanins in heterozygous plants from backcrossing and in plants with self-pollination, in both cases marker-assisted selection was used. Espinosa et al. (2009), found a significant effect of the direction of the cross (direct and reciprocal) and of the female on the content of anthocyanins (in pericarp, in aleurone and whole grain) and of morphological components, via recurrent selection.
Rodríguez et al. (2013), mention that in the recurrent selection of full siblings gain in content of anthocyanins in the first cycle of selection, but not in the subsequent ones. In the corn for special uses it is necessary to identify germplasm with outstanding characteristics in the parameters that define its quality for final use. The objective of the study was to determine the effect of fixing and standardizing the color of the grain and the evaluation of physical characteristics, technological variables and nutraceutical composition in corn of a population of the Elotes Occidentales race.
Materials and methods
Genetic material
A corn compound of the Elotes Occidentales race was used, obtained from collections made in western Mexico in the states of Jalisco, Michoacán and Zacatecas. A 2 kg sample of the compound from the original population (OP) was divided into three subgroups by visual appreciation of the color intensity of the grain in clear (C), intermediate (I) and dark (O).
Location of the experiment
The crop to fix the color in grain, was established in the experimental field of the University Center of Biological and Agricultural Sciences of the University of Guadalajara that is located in Zapopan, Jalisco, Mexico. Its geographic coordinates are 20° 43’ North latitude and -103° 23’ West longitude at an altitude of 1,650 meters above sea level. With average annual temperature of 18 °C and precipitation of 950 mm. The soils are acid pH and sandy loam texture. In the cycles of S/S 2013 in open field under seasonal conditions, in autumn-winter (A-W) 2013-2014, O-I 2014-2015, spring-summer (S-S) 2015 and A-W 2016-2017, in greenhouse with irrigation. In the establishment of the crop, the genotypes are not evaluated through the environments, only the color was fixed.
Agronomic management
The first crop cycle was established in plots of two rows at a distance of 0.75 m between rows and 5 m in length, sowing with a planting density of 45 000 plants ha-1. The formula 18 46 00 (N-P-K) was applied at a dose of 200 kg ha-1 at sowing, in a first weeding, urea was applied with the formula 46-00-00 in a dose of 30 kg ha-1. In the following greenhouse growing cycles, management was similar among them. They were established in plots of two rows of 20 m in length and 0.75 m between rows, 10 seeds of each family were planted (family by cobs), considering 20 families by intensity of coloration, directly in soil at a distance of 0.2 m between plants. The fertilizer was incorporated in the irrigation, making an application with the formula 12-61-00, the second application was with the formulas 12-00-46 and 11-00-00-23, a third application was made with the formula 32 -04-00. For the control of pests, weeds and diseases, incidents were monitored and, if applicable, chemical control was applied.
Method of obtaining the final population (FP)
From each cycle, 20 families were selected by visual appreciation by color intensity C, I and O. The separated seed was sown in the successor cycle without using a design. The first three cycles were performed self-pollinations (S1, S2 and S3). In the next two cycles, fraternal crosses were made to obtain grain with uniform color intensity for each subpopulation (C, I and O) of the FP. A sample of 1 kg of grain from each subpopulation was used to determine the quality of the grain in terms of physical characteristics, technological variables for the production of pozole and nutraceutical properties, comparing them with subpopulations of the OP (Figure 1).

Physical characteristics
The color was measured with a Hunter-Lab team in the CIELab scale, in the raw grain (Gcr) and unprocessed grain modalities and in the processed grain for pozole that was denoted only as cooked grain (Gcd), which was dehydrated in a stove for 24 h at 40 °C. The values of the luminosity readings (Lum, %), a* and b*, were obtained, from these last two parameters the hue angle variables “hue” (h°) and color saturation index ‘chroma’ were calculated, by means of the expressions: h°= arctg (b*/a*), chroma= (a*2 + b*2)1/2 (McGuire, 1992).
In the Gcr the variables were determined: length (L), width (A) and thickness (G) in a sample of 10 grains (mm), grain humidity (HG, %), hectolitre weight (PH, kg hL-1), weight of one hundred grains (PCG, g). The hardness was determined indirectly by the flotation index (IF, %). Pericarp thickness (EP, μm) was measured in a block of five layers of pericarp from the opposite side to the location of the germ with a micrometer. The variables were performed in duplicate according to what was described by Salinas and Vázquez (2006).
Technological variables for the production of pozole
100 g of each of the samples were considered by color intensity (C, I and O) of both populations (OP and FP). For the preparation of pozole and the tests of nixtamalization and cooking for flowering of the grain: total solids in nejayote (STN) and in broth of cooking (STC) in g 100 g-1, humidity of the grain nixtamalizado (HGN) and cooked (HGC) in g 100 g-1 by the stove method; cooking time for grain flowering (TCF) in min; volume of expansion (VE) in mL and (%) of flowered grains (GF) were performed according to what was described by Bonifacio et al. (2005). For the variable yield of grain to pozole (RGP) was calculated according to Vázquez and Santiago (2013) and was expressed as kg of product obtained per kg of processed corn.
Obtaining the extract
For the extraction, a sample of 25 grains was used from each of the subpopulations of the OP and FP in the Gcr and Gcd modalities. In both cases the grain was crushed with the help of a hammer and in the particular case of the germ, it was cut into small pieces with the help of a scalpel. The sample was degreased with petrol for eight hours in a Soxhlet equipment. It was placed in an oven at 40 °C to remove the solvent and milled in a cyclonic type mill (UDY, Tecator, City, State) with 0.5 mm mesh. For the extraction of anthocyanins 1 g of flour was considered, to which was added 20 mL of solvent (methanol acidified to 1% with trifluoroacetic acid, TFA). The samples were sonicated for 15 min, then cooled for 105 min. They were centrifuged at 10 000 rpm (11200 G) for 9 min in a centrifuge brand Hettich zentrifugen, model Universal 32, to recover supernatant and eliminate turbidity. The extract was filtered in Whatman No. 4 and its volume was measured. From this extract, the CAT, FST and CA were determined in duplicate.
Content of total anthocyanins (CAT)
The absorbance of the extract was read on a Perkin Elmer spectrophotometer (Lambda 25 UV/Vis) at 520 nm. A standard curve of chlorinated pelargonidin (Sigma Aldrich, MN) was developed to express the CAT content based on this compound, given that the predominant anthocyanins in the grain color analyzed are pelargonidin derivatives (Salinas et al., 1999; Paulsmeyer et al., 2017). The results were expressed in mg equivalents of chlorinated pelargonidin (EPC) in 100 g of dry sample (MS).
Total soluble phenols (FST)
The Folin Ciocalteau method was used as described by Singleton and Rossi (1965). Briefly, a 100 μL aliquot was contacted with Folin® reagent (125 μL), 19% sodium carbonate (w/v) (1 250 μL) and distilled water (1525 μL). It was stirred and allowed to react for 75 min in the dark. It was centrifuged for 10 min at 4 000 rpm, recovering the supernatant and its absorbance was read at 760 nm. A ferulic acid standard curve was made (Sigma-Aldrich, St. Louis, MO, USA) to express the results based on this acid in mg equivalents of ferulic acid (EAF) per 100 g of MS.
Antioxidant capacity (CA) ABTS method
It was evaluated by the ABTS technique (2,2-azino-bis-3-ethylbenzotriazolino-6-sulfonic acid) as described by Re et al. (1999). A reading at one minute and a second was considered 30 min after the reaction started at an absorbance of 734 nm. The percentage of reduced ABTS was calculated. The results were expressed in equivalent micromoles of Trolox (μmoles ET) (soluble form of α-tocopherol) per gram of MS (Salinas et al., 2017).
Statistical analysis of information
The data of the quality variables were analyzed for the single-color intensity factor in three levels, by means of a completely random design with two repetitions. The analysis of variance was performed, the comparison of Tukey means (p≤ 0.05) when there was significance in the model and a correlation analysis between nutraceutical variables with the statistical package SAS, V.9.1 (SAS, 2004).
Results and discussion
The Elotes Occidentales corn race has coloration in the grain due to the anthocyanin pigment present in the aleurone layer (Ron et al., 2006). However, there is segregation in the color and location of the pigment. The subpopulation of intensity of coloration I, of both populations (OP and FP), presented color both in the pericarp and in the aleurone layer in reddish tones. In the analysis of variance, a significant difference was detected for the physical characteristics, with the exception of G. The technological variables STN, TCF and GF, showed significance and the rest of the variables were not significant. While for the nutraceutical variables, the CAT, the FST and the CA of the extracts of both populations (OP and FP) in Gcr and Gcd, were highly significant (p≤ 0.01) (Table 1).
Table 1 Analysis of variance for grain quality variables of elotes occidentales.
Type of Variables |
Physical |
||||||||||
Color |
Size |
||||||||||
Lum (%) |
h |
Chroma |
L (mm) |
A (mm) |
G (mm) |
HG (%) |
PH (kg hL-1) |
PCG (g) |
IF (%) |
EP (m) |
|
GL |
11 |
11 |
11 |
5 |
5 |
5 |
5 |
5 |
5 |
5 |
5 |
CM |
239.7** |
539.69** |
129.1** |
6.48** |
13.17** |
1.43 NS |
0.9** |
14.08** |
295.13** |
25.03* |
359.4** |
Error |
1.28 |
53.9 |
6.82 |
0.79 |
0.62 |
0.73 |
0.02 |
0.16 |
13.96 |
3.77 |
7.08 |
CV |
3.59 |
17.36 |
20.21 |
7.72 |
6.11 |
15.3 |
1.28 |
0.57 |
6.77 |
1.99 |
3.64 |
Type of Variables |
Tecnológicas |
||||||||||
|
STN (g 100 g-1) |
STC (g 100 g-1) |
HGN (g 100 g-1) |
HGC (g 100 g-1) |
TCF (min) |
VE (mL) |
GF (%) |
RGP (kg kg-1) |
||||
GL |
5 |
5 |
5 |
5 |
5 |
5 |
5 |
5 |
|||
CM |
2.84* |
0.048ns |
5.78ns |
16.75ns |
151.42* |
448.06ns |
62.31* |
0.006ns |
|
||
Error |
0.72 |
0.17 |
4.06 |
5.44 |
34.56 |
147.67 |
11.47 |
0.003 |
|||
CV |
33.91 |
23.22 |
4.82 |
4.01 |
9.35 |
27.38 |
3.61 |
4.86 |
|||
Type of Variables |
Nutracéuticas |
||||||||||
|
CAT (mg EPC 100 g-1 MS) |
FST (mg EAF 100 g-1 MS) |
CA (µmoles ET 100 g-1 MS) |
|||||||||
GL |
11 |
11 |
11 |
||||||||
CM |
121.11** |
3091.72** |
33.41** |
||||||||
Error |
0.19 |
0.5 |
0.01 |
||||||||
CV |
3.86 |
0.9 |
1.66 |
||||||||
*= significance at 5%; **= significance at 1%; ns= not significant; Ç= the identity of the variables is according to what is described in materials and methods.
Physical characteristics
The variables associated with the color of the grain, luminosity (Lum), hue angle or hue (h°) and saturation index of color or chroma, presented high significance (p≤ 0.01), so that there is variability in the color of the grain between the subpopulations of the OP and FP.
The light red grains (C and I) have a brighter appearance than those of blue grain (O) (Salinas et al., 2012). Regarding the values of hue (h°) that describes the color tone, it is of the parameters that more association keeps with the visual appreciation and the values of chroma are related to the index of saturation of the color, with high values in colors cigars and low values in matt or less pure colors (Jha, 2010).
For the variable h° it was observed that, in all the color subgroups, the values of the OP were higher than those of the FP, which means that the orange red tone of the OP changed to a red-purple tone in the FP. In the case of subpopulations C and I, the tendency was towards red-orange tones and in the subpopulations O towards purple tonalities. What coincides with that reported by Salinas et al. (2013), where it separates the tone values between 0° and 25° which correspond to the purple-red color. The chroma values of subpopulations C and I of the OP were lower with respect to the corresponding ones in the FP, which indicates a higher color saturation index.
Regarding the color determined in Gcd, both populations (OP and FP) showed Lum loss of up to 62% (in subpopulation I of the OP) in relation to the Gcr. With the exception of subpopulation I of the FP, the Gcd showed greater luminosity (4.15%) with respect to the values obtained in the Gcr. Vázquez and Santiago (2013), found that the nixtamal wash was brighter, this could be the reason why the Gcd of this subpopulation (I of the PF) has greater luminosity. The values of h° in Gcd that were presented in the subpopulations (C= 43.59, I= 54.64 and O= 63.66) of the FP were higher than those presented in the OP presenting an orange red tone.
The change of tone during nixtamalization is due to the fact that the alkali hydrolyze a large part of the pericarp, therefore the determination of the color in Gcd is carried out in the aleurone layer that acquires a yellowish hue (Bonifacio et al., 2005). The GCD of the FP showed the highest chroma values in intensities C and I (18.47 and 18.28), related to reddish tones and presented a purer color, with respect to the OP. In the case of subpopulation O for both populations (OP and FP) in Gcd, they presented low chroma values (3.21 and 7.86, respectively), which indicates a matte color with lower purity.
Regarding the size of the grain, it was higher in the subpopulations of the OP that had higher L and A, since the subpopulation O had the highest value of L (12.72 mm), then subpopulations C and I and in the FP the subpopulation C had the lowest value of L (10.28 mm). While, for grain A, subpopulation I of the OP, presented the widest grains (14.17 mm) contrary to the FP than in subpopulation I, presented the narrowest grains (11.67 mm). However, for the thickness (G) they did not show significance, which shows that by means of the color fixation technique, the grain size of the FP that had shorter and narrower kernels compared to the OP was reduced and since it did not present variation in grain G, it is considered that this characteristic was not modified.
The average of the PCG was higher in the OP (63.24 g) over the FP (47.03 g). Considering the GWP as an indicator of grain size (>38 g) (Salinas et al., 2010), the grains of this corn race are large. The subpopulation O of the OP was the one with the highest PCG (64.25 g). What coincides with Bonifacio et al. (2005) who reported for maize of the Cacahuacintle breed with a type of mealy endosperm, a PCG of 60 to 70 g, which compared with values of ‘hard’ grains (from 18 to 22 g in Palomero Toluqueño and Arrocillo, respectively) and coinciding with the values of L and A, ‘large’ size grains are considered, a desirable characteristic for their use in the production of pozole (Bonifacio et al., 2005; Vázquez and Santiago, 2013; Hernández et al., 2014).
The FP values were lower with respect to the OP; subpopulations I and O of the FP (43.05 and 43.02 g, respectively), were the grains with the lowest PCG. The PCG suggests the size of the grain, and for the process of nixtamalization the grains of greater weight are more favorable (Salinas et al., 2013). Grain size is a variable of interest in the nixtamalization process, due to its impact on cooking and water absorption processing. Bonifacio et al. (2005), mention that the difference in grain weight is really due to the size of the grain and not to its density. The averages of the hectolitre weight (PH) were lower in the OP (67.75 kg hL-1) than in the FP (70.05 kg hL-1). the PH of 60, 59 and 58 kg hL-1 was reported for the Cacahuacintle breed (Bonifacio et al., 2005; Vázquez and Santiago, 2013; Hernández et al., 2014).
These values of PH indicate the amount of dry matter of the grain that there is in a certain volume and it is considered as an indirect measure of the hardness of the grain of corn so low values are characteristic of very soft grains (Vázquez and Santiago, 2013). The HG was considered for the effect it has on the physical characteristics of the grain (Hernández et al., 2014), the OP presented lower humidity than the FP with 10.6 and 11.27%, respectively. The flotation index (FI) showed little variation on the 6 subpopulations of both populations, subpopulation I of the FP presented the highest value of 100%, in the same population the subpopulation O presented the lowest value (92.67%), which indicates that the grains have the indispensable characteristic for the flowering of the grain that the pozole requires (Vázquez and Santiago, 2013).
In the pigmented maize the soft texture dominates, since they have a large proportion of floury endosperm. Wellhausen, et al. (1951), found that in the selection by intensity of the color tends to maintain a pure race with respect to the gene of the floury endosperm. In floury endosperm grains, a pericarp thickness (PE) of 91.5 μm has been reported in the Bolita breed (Salinas-Moreno et al., 2003) coinciding with the values obtained in light grains (C) of the OP and in intermediates (I) of the FP that presented values greater than 80 μm. In the meantime, for maize classified according to their final use as their own for the production of pozole, an average of 43.6 μm is reported (Narváez-González et al., 2007), they have a pericarp content lower than the average of the normal creole corn, therefore, the maize with smaller thickness of pericarp is considered the most suitable for this purpose (Vázquez et al., 2014), subpopulation C of the FP presented an EP of 48.6 μm, being the one that most resembles the one described previously.
Technological variables for the production of pozole
The total solid variables of the nejayote (STN), cooking time for flowering (TCF) and flowered grains (GF) showed a difference of 5% between the two populations. While the rest of the technological variables did not show significance, which indicates the little variation among populations for the process in the preparation of the pozole. The average STN content was lower in the OP (6.65 g 100 g-1) than in the FP (7.46 g 100 g-1), with subpopulation I of the OP having the lowest content (5.58 g 100 g-1) and the subpopulation O of the FP, the highest content (8.42 g 100 g-1). Contents of 4.9 g 100 g-1 have been reported for Cacahuacintle corn. However, the values reach 8 to 12% when the grain is processed commercially (Pflugfelder et al., 1998), values similar to those presented in this study.
In the STC, there was an average content of 1.82 and 1.81 g 100 g-1, in the OP and FP, respectively. In other works, 2.3 to 3% are reported (Hernandez et al., 2014) and from 1.78 to 3.73%. In the case of the pozole cooking broth the pericarp is no longer present, so solids could be formed by solubilized proteins, starch and fragments of burst grains (Bonifacio et al., 2005).
In the HGN, both subpopulation groups presented an average of 42.02 g 100 g-1 in the OP and 41.61 g 100 g-1 in the FP, so they showed little variation in water absorption during the process nixtamalization. For the HGC they presented an average of 56.89 and 59.5 g 100 g-1 in the OP and FP, respectively. Vázquez and Santiago (2013), indicate a positive correlation between grain moisture and the VE variables and the RGP, due to the resting time of the nixtamal.
The TCF of the grain was from 53 to 80 min in both populations, times well below that reported in previous studies, which indicate times of 103 to 218 min in maize grain Cacahuacintle (Bonifacio et al., 2005; Vázquez and Santiago, 2013; Hernández et al., 2014). As for the reduction of the grain size in the FP, it could be considered that the TCF of the grain would increase, because Bonifacio et al. (2005), confirm that rounded and globose grains are those that require less cooking time for trapping. What happened in subpopulation C (75 min), but in subpopulations I and O had shorter TCF with respect to the subpopulations of the OP (Table 2), taking into account that the reduction in grain size in the PF, therefore, was little the difference of the times reported in subpopulations of the OP.
Table 2 Comparison of means of physical and technological variables.
| VariablesÇ | Original population | Final population | |||||
| C | I | O | C | I | O | ||
| Physical | Lum | 34.56 bc | 41.2 a | 34.44 bc | 43.69 a | 32.54 c | 33.88 b |
| Color | h° | 43.09 abcd | 52.73 ab | 61.18 a | 28.07 d | 30.67 cd | 23.64 d |
| croma | 11.63 bcd | 17.44 abc | 9.06 de | 21.68 a | 23.21 a | 7.01 de | |
| Size | L | 11.77 ab | 11.84 ab | 12.72 a | 10.28 c | 11.26 bc | 11.33 bc |
| A | 13.43 a | 14.17 a | 14.08 a | 11.71 b | 11.67 b | 12.29 b | |
| HG | 11.03 b | 10.63 c | 10.16 c | 11.81 a | 11.14 b | 10.88 bc | |
| PH | 65.5 e | 70.29 b | 67.45 d | 68.86 c | 71.6 a | 69.7 bc | |
| PCG | 62.35 a | 63.14 a | 64.25 a | 55.03 a | 43.05 b | 43.02 b | |
| IF | 98.33 ab | 95.33 ab | 99.33 a | 99.33 a | 100 a | 92.67 b | |
| EP | 82.83 ab | 68.4 c | 72.9 bc | 48.6 d | 82 ab | 83.7 a | |
| Technological | STN | 7.2 ab | 5.58 b | 7.18 ab | 7.53 ab | 6.42 ab | 8.42 a |
| TCF | 60 ab | 65 ab | 64 ab | 75 a | 59.33 ab | 54 b | |
| GF | 89.26 b | 89.37 b | 90.44 b | 96.89 ab | 96.29 ab | 99.85 a | |
Means with the same letter per row are not significantly different. Ç= the identity of the variables is according to those described in materials and methods. C= clear; I= intermediate; O= dark.
In the yield of grain to pozole (RGP) both populations (OP and PF) presented very similar values on average (1.33 kg kg-1 and 1.4 kg kg-1, respectively), which indicates that despite the variations in to the PCG and the grain size of both populations, presented similar yields. The subpopulation O of the PO presented the highest value with 1.48 kg kg-1, since it was the one that presented the grain with the highest L and PCG, while the subpopulations C and I presented the lowest RGP (1.26 kg kg-1). In general, the FP presented higher performance on average coinciding with the higher HGC. Vázquez and Santiago (2013), reported a yield of 1.5 kg of nixtamal kg-1 of corn by the traditional method for the preparation of pozole in accordance with its moisture content.
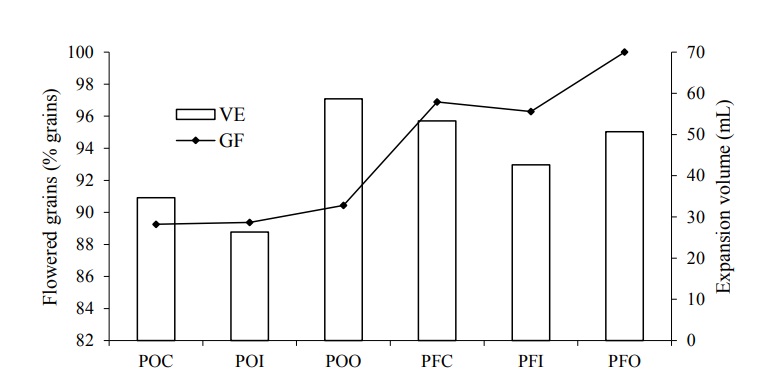
Regarding the volume of expansion (VE) and percentage of flowered grains (GF), there was a difference between populations, since the FP presented the highest values above the OP with an average difference of 10.22 mL for the VE and 7.97% for the GF, presenting a proportional relation regarding the increase of the VE with respect to the greater percentage of GF. With the exception of the subpopulation O of the OP that had a VE of 58.67 mL (the highest value), surpassing that of the subpopulations of the FP (C= 53.33, I= 46.67 and O 50.67 mL) (Bonifacio et al., 2005; Narváez-González et al., 2007). However, the percentage of GF of the subpopulation O of the OP was lower with respect to the VE, since the subpopulations of the FP had higher percentages of GF (Figure 2).
Nutraceutical variables
There was a difference in the CAT and CA, between the grain of corn with different intensity of coloration. In this study the Gcr of the subpopulation O of both populations, presented the highest average CAT (22.75 mg EPC 100 g-1 MS) followed by the subpopulations of intensity I and finally the subpopulations of intensity C (17.76 and 12.45 mg EPC 100 g-1 MS, respectively).
Whereas, for the Gcd, the subpopulations of intensity I presented the highest average CAT (6.37 mg EPC 100 g-1 MS), that of the subpopulations of intensity O and those of intensity C (4.95 and 4.01 mg EPC 100g-1 MS). They presented the same behavior pattern for CAT both populations for Gcr (in order O, I and C) and Gcd (I, O and C).
In general, the OP had more CAT than the FP, both for the Gcr and the Gcd (Figure 3-A).
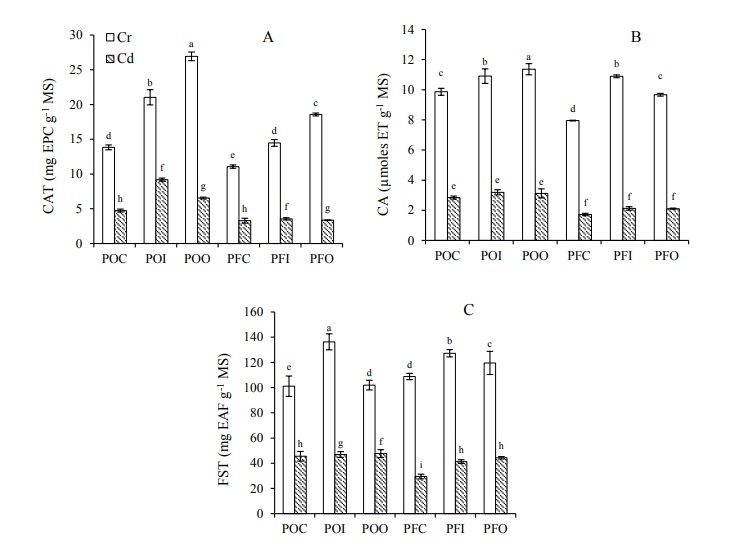
Figure 3 A) Total content of anthocyanins (CAT); B) total soluble phenols (FST); and C) antioxidant capacity (CA) in grain of the original (OP) and final (FP) populations in intensity C, I and O, in unprocessed (Cr) and cooked (Cd).
The difference in CAT values can be attributed to the proportion of different aglycones (anthocyanidins), but also to the chemical structure in particular of each anthocyanin (Salinas et al.2012). The size of the grain affects the concentration of anthocyanins, it influences by an effect of dilution of the anthocyanins in the grain flour used for the quantification (Salinas-Moreno et al., 2012), so it is suggested that the lower CAT is due to the smaller size of the grain more than by effects of dilution in subpopulations of the FP.
Regarding the CAT of Gcr compared with Gcd, it has a relation with respect to the TCF, since through the process of elaboration of the pozole in the nixtamalization stage, a first loss of anthocyanins occurs due to the combination of alkalis and cooking, by effects of pH and temperature increase (Salinas-Moreno et al., 2012).
In the extraction of anthocyanins other phenolic compounds and other flavonoids are also extracted (Salinas-Moreno et al., 2012) so that the content of FST is greater than the CAT, the anthocyanins are the predominant phenols in the extract, therefore, they are the main responsible for the CA (Yang and Zhai, 2011). The highest content of FST (136.3 mg EAF g-1 MS) was presented by subpopulation I of the FP in Gcr; however, in subpopulations of intensity C and O, the FST contents were lower (108.8 and 119.6 mg EAF g-1 MS, respectively) with respect to the subpopulations of the OP at the same intensities.
The CA is a reflection of the variables of phenolic composition (CAT and FST), a greater CA was present in grains of the OP than in Gcr, had a difference of 1.69 μmol ET g-1 MS with respect to the PF in the subpopulations O and 1.91 μmol ET g-1 MS in subpopulations C. While for subpopulations I, there was no greater variation with only a difference of 0.01 μmol ET g-1 MS between populations. There are no significant differences of the Gcd of CA in the three subpopulations of the OP with respect to the FP. However, the subpopulations of the OP far outnumbered the FP (Figure 3-C).
A higher CAT is associated with higher CA (Salinas et al., 2012) however, the type of pigment and differences in the pigment content are related to the antioxidant capacity in the corn grain, which are directly due to the pigments (Rodríguez et al., 2013). Therefore, in the Elotes Occidentales maize population of this study, it showed variation in the CAT and in the CA, due to the intensity of color, which presented the same order in the content of CAT and CA in the subpopulations of the OP, being in Gcr O> I> C and in Gcd I> O> C.
In general, the OP presented higher CAT, content of FST and CA than FP, with the exception of subpopulation I of the FP in Gcr, which presented higher content of FST. The CA is not due only to the CAT, but to the content of FST. Therefore, there is a highly significant and positive correlation between the nutraceutical variables of CAT, FST and CA (p< 1%). Since in the extraction of anthocyanins phenolic acids and other flavonoids are extracted together, the value of FST is higher than that of CAT. However, anthocyanins are the predominant phenols in the extract, therefore, as they increase, the FST increases, which are the main responsible for CA (Salinas-Moreno et al., 2012).
What explains the positive correlation (r= 0.96; p< 0.01) between the content of FST and CA, between CAT and CA (r= 0.91; p< 0.01) and between CAT and FST (r= 0.83; p< 0.01) (Figure 4).
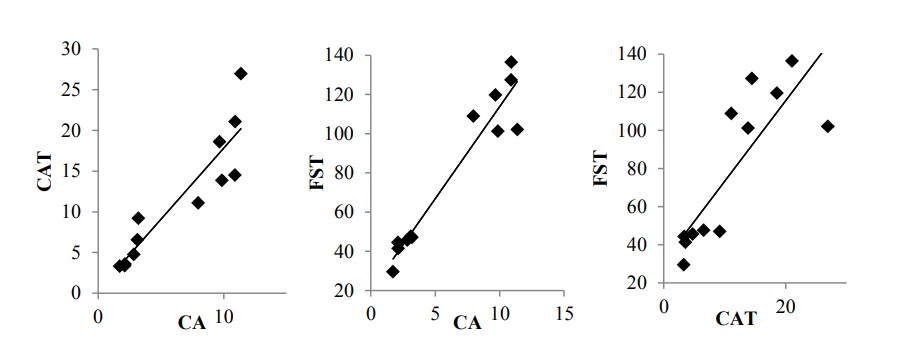
Figure 4 Dispersion graphs of the correlations between the nutraceutical variables of the unprocessed and cooked grain, in the different color intensities of the original and final populations.
Finally, by means of the method used of autobrothers it was possible to standardize the intensity of the grain in the different subpopulations (C, I and O) of the FP, mainly in the I, which presented color in pericarp and aleurone. However, there was no gain due to the additivity effect of the method on the physical and nutraceutical variables (it did not show higher CA), so the OP was not exceeded. It is considered that the method is not adequate for that purpose. As reported by Rodriguez et al. (2013), in a single cycle of visual selection of the color of the grain, managed to increase the content of anthocyanins, but not in the subsequent ones, they explain that apparently the variability of the pigment content was exhausted in a single cycle and it was not possible to improve plus. In the case of Landi et al. (2008), showed that recurrent selection for cob color among complete siblings found that a single selection cycle led to the fixation of the selected alleles.
It would be advisable to adapt it with another type of method in which the subpopulations obtained with an external genetic source could be included and obtain gain by dominance effects through hybridization. Authors such as Lago et al. (2014) report that through backcrosses between dominant homozygous inbred line as an anthocyanin donor and a variety of corn as a recurrent parent, they obtained lines that accumulated high levels of anthocyanins in the pericarp. And Espinosa et al. (2009), who through direct diallel in direct and reciprocal crosses, found a significant effect in the direction of the cross over the content of anthocyanins in aleurone and pericarp.
Conclusions
Using the self-fertilization and selection technique to fix the color of the grain, a final population with uniformity in color was obtained in three intensities: clear, intermediate and dark. In the physical characteristics the grains showed more intense colors and the size was reduced obtaining short and narrow grains, with respect to the original population; however, they were large grains with soft texture and the thickness of pericarp suitable for the preparation of pozole. They presented good humidity for the greater volume of expansion of the grain with shorter times for the flowering of the grain and with greater percentage of flowered grains, with acceptable yields of grain to pozole.
While there was not a strong gain in the content of total anthocyanins between the intensity of the color, with respect to the original population. In the final population, the content of total soluble phenols and the antioxidant capacity was higher in the maize of intermediate intensity (red color), so that the greatest benefit in nutraceutical quality was obtained by effect of color fixation in grains of this variety. intensity.
Acknowledgments
To Dr. Jose Ron Parra for his valuable participation. To CONACYT for its support through grant CVU 369186. To the University of Guadalajara and to the National Institute of Forestry, Agriculture and Livestock Research for the granted facilities.
REFERENCES
Bonifacio, V. E. I.; Salinas, M. Y.; Ramos, R. A. y Carrillo, O. A. 2005. Calidad pozolera en colectas de maíz Cacahuacintle. Rev. Fitotec. Mex. 28(3):253-260. [ Links ]
CONABIO. 2010. Comisión Nacional para el Conocimiento y Uso de la Biodiversidad. http://www.biodiversidad.gob.mx. [ Links ]
De la Parra, C; Serna-Saldivar, S. O. and Liu, R. H. 2007. Effect of processing on the phytochemical profiles and antioxidant activity of corn for production of masa, tortillas, and tortilla chips. J. Agric. Food Chem. 55(10):4177-4183. [ Links ]
Espinosa, T. E.; Mendoza, C. M. C.; Castillo, G. F.; Ortiz, C. J.; Delgado, A. A. y Carrillo, S. A. 2009. Acumulación de antocianinas en pericarpio y aleurona del grano y sus efectos genéticos en poblaciones criollas de maíz pigmentado. Rev. Fitotec. Mex. 32(4):303-309. [ Links ]
Hernández, G. C. A.; Salinas, M. Y.; López, P. A.; Santacruz, V. A.; Castillo, G. F. y Corona, T. T. 2014. Calidad pozolera en poblaciones de maíz Cacahuacintle de los Valles Altos de Puebla, México. Rev. Mex. Cienc. Agríc. 5(4):703-716. [ Links ]
Jha, S. N. 2010. Color measurements and modeling. In: Nondestructive evaluation of food quality: theory and practice. Jha, S. N. (Ed.). Springer. 17-40 pp. [ Links ]
Lago, Ch.; Cassani, E.; Zanzi, C; Landoni, M.; Trovato, R. and Pilu, R. 2014. Development and study of a maize cultivar rich in anthocyanins: coloured polenta, a new functional food. Plant Breeding. 133:210-2017. [ Links ]
Landi, P.; Canè, M. A. and Frascaroli, E. 2008. Response to divergent selection for cob color in maize. Euphytica. 164:645-658. [ Links ]
Márquez, S. F. 1985. Genotecnia vegetal: métodos, teoría, resultados. AGT (Ed.). México, DF. 357 p. [ Links ]
McGuire, R. G. 1992. Reporting of objecting color measurements. HortSci. 27(12):1254-1255. [ Links ]
Narváez-González, E. D.; Figueroa-Cárdenas, J. D. y Taba, S. 2007. Aspectos microestructurales y posibles usos del maíz de acuerdo con su origen geográfico. Rev. Fitotec. Mex. 30(3):321-325. [ Links ]
Paulsmeyer, M.; Chatham, L.; Becker, T.; West, M.; West, L.; and Juvik, J. 2017. Survey of anthocyanin composition and concentration in diverse maize germplasms. J. Agric. Food Chem. 65(21):4341-4350. [ Links ]
Re, R.; Pellegrini, N.; Proteggente, A.; Pannala, A.; Yang, M. and Rice-Evans, C. 1999. Antioxidant activity applying an improved ABTS radical cation decolorization assay. Free Radical Biol. Medicine. 26:1231-1237. [ Links ]
Rodríguez, M. V.; Soengas, P.; Landa, A.; Ordás, A. and Revilla, P. 2013. Effects of selection for color intensity on antioxidant capacity in maize (Zea mays L.). Euphytica. 193:339-345. [ Links ]
Ron, P. J.; Sánchez, G. J. J.; Jiménez, C. Á. A.; Carrera, V. J. A.; Martín, L. J. G. and Morales, R. M. M. 2006. Maíces nativos del Occidente de México I. Colectas 2004. Scientia. CUCBA. 8(1):1-139. [ Links ]
Ron-Parra, J.; Morales-Rivera, M. M.; Jiménez-López, J.; Jiménez-Cordero, A. A.; De la Cruz-Larios, L. and Sánchez-González, J. J. 2016. Maternal genetic inheritance of red pericarp in the grain of maize. Maydica. Electronic Publication. 61(3):10491-5. [ Links ]
Salinas, M. Y.; Aragón, C. F.; Ybarra, M. C.; Aguilar, V. J.; Altunar, L. B. y Sosa, M. E. 2013. Caracterización física y composición química de razas de maíz de grano azul/morado de las regiones tropicales y subtropicales de Oaxaca. Rev. Fitotec. Mex. 36(1):23-31. [ Links ]
Salinas, M. Y.; Gómez, M. N. O.; Cervantes, M. J. E.; Sierra, M. M.; Palafox, C. A.; Betanzos, M. E.; y Coutiño, E. B. 2010. Calidad nixtamalera y tortillera en maíces del trópico húmedo y sub-húmedo de México. Rev. Mex. Cienc. Agríc. 1(4):509-523. [ Links ]
Salinas, M. Y.; Hernández, M. V.; Trejo, T. L. L.; Ramírez, D. J. L. e Iñiguez, G. O. 2017. Composición nutricional y de compuestos bioactivos en tortillas de poblaciones nativas de maíz con grano azul/morado. Rev. Mex. Cienc. Agríc. 8(7):1483-1496. [ Links ]
Salinas, M. Y.; Soto, H. M.; Martínez, B. F.; González, H. V. y Ortega, P. R. 1999. Análisis de antocianinas en maíces de grano azul y rojo prove nientes de cuatro razas. Rev. Fitotec. Mex. 22:161-174. [ Links ]
Salinas-Moreno, Y.; Martínez-Bustos, F.; Soto-Hernández, M.; Ortega-Paczka, R. y Arellano-Vázquez, J. L. 2003. Efecto de la nixtamalización sobre las antocianinas del grano de maíces pigmentados. Agrociencia. 37:617-628. [ Links ]
Salinas-Moreno, Y.; Pérez-Alonso, J. J.; Vázquez-Carrillo, G.; Aragón-Cuevas, F. y Velázquez-Cardelas, G. A. 2012. Antocianinas y actividad antioxidante en maíces (Zea mays L.) de las razas Chalqueño, Elotes Cónicos y Bolita. Agrociencia. 46:693-706. [ Links ]
SAS. 2004. Institute Inc. SAS/STAT® 9.1 User’s Guide. Cary, N.C.: SAS Institute Inc. [ Links ]
Singleton, V. L. and Rossi, J. A. 1965. Colorimetric of total phenols with phosphomolybdic, phosphtungstic acid reagent. American Journal of Enology and Viticulture. 16(1):144-158. [ Links ]
Vázquez, C. G.; Santiago, R. D.; Salinas, M. Y. y Cervantes M. J. E. 2014. El pozole: situación actual y calidad nutricional. In: los alimentos en México y su relación con la salud. Aguilera, O. M.; Reynoso, C. R.; Gómez, A. C. A.; Uresti, M. R. M. y Ramírez, D. L. J. (Coord.). Primera Edición. Plaza y Valdés Editores. México. 662 p. [ Links ]
Vázquez, C. M. G. y Santiago, R. D. 2013. Características fisicoquímicas y calidad del pozole del maíz Cacahuacintle procesado mediante tres métodos. Rev. Fitotec. Mex. 36(3-A):357-366. [ Links ]
Wellhausen, E. J.; Roberts, L. M. y Hernández, X. E. 1951. Razas de maíz en México. Su origen, características y distribución. Oficina de Estudios Especiales-(OEE). Secretaría de Agricultura y Ganadería (SAG). México, D.F. Folleto técnico núm. 55. 237 p. [ Links ]
Yang, S. and Shai, W. 2011. Identification and antioxidant activity of anthocyanins extracted from the seed and cob of purple corn (Zea mays L.). Innovative Food Science. Emerging Technol. 11:169-176. [ Links ]
Received: February 01, 2019; Accepted: May 01, 2019
 Este es un artículo publicado en acceso abierto bajo una licencia
Creative Commons
Este es un artículo publicado en acceso abierto bajo una licencia
Creative Commons
