


 nueva página del texto (beta)
 Inglés (pdf)
 Artículo en XML
 Referencias del artículo
 Enviar artículo por email
 Citado por SciELO
  Similares en
SciELO
Similares en
SciELO 
 Permalink
Introduction
The textile industry employs large amounts of water for dyeing and washing processes, generating large volumes of effluents (Cestarolli et al., 2019). It is estimated that between 10 and 15% of dyes used do not adhere to the textile fibers and are released into the environment (Lakhan et al., 2015).
Dyes are classified based on chemical structure, source, solubility, and use (Gürses et al., 2016). In particular, azo-type dyes are synthetic compounds widely used in textile industry because of their stability to light, and resistance to microbial degradation and to fading in washing processes. Nevertheless, they are also toxic, mutagenic, cancerogenic and harmful to marine life and photosynthetic processes of aquatic plants (Álvarez et al., 2015). Eriochrome T black is an azo-type colorant used in the textile industry for dyeing silk, wool, and nylon fibers after pretreatment with chromium salts (Moeinpour et al., 2014; Karimi et al., 2018) that has been found to be particularly dangerous and carcinogenic; compounds generated from its degradation, such as naphthoquinone, are carcinogenic to an even greater degree (Khurana et al., 2018). For these reasons, the development of efficient, low-cost adsorbents for the removal of colorants such as Eriochrome T black from aqueous solutions is of the utmost importance (Park et al., 2018).
Among the numerous investigations on biological, chemical, and physicochemical treatments for the removal of colorants in water, adsorption stands out as one of the most promising methods (Tran et al., 2015). Adsorption consists of removing substances initially dissolved in a liquid or gas phase by their accumulation in an adsorbent material (Oladoja et al., 2017). Compared to other techniques, adsorption offers significant advantages such as high availability of materials and equipment, relatively low cost, easy operation, good contaminant removal efficiency, and effectiveness (Uddin, 2017). Its effectiveness depends on parameters such as sorbent particle size and surface morphology, pH, temperature, and concentration of the water to be treated (Ahmad et al., 2015).
Some of the materials most commonly used as adsorbents are silica gel, alumina and activated carbon. However, zeolites have been widely used to remove pollutants present in water by exhibiting a vast internal microporous surface in relation to the external one, and high adsorption capacity in addition to ion exchange properties (Li et al., 2015).
On the other hand, the application of chitosan, a polycationic polysaccharide, in water treatment has been exceptionally advantageous and constitutes an alternative to commonly used adsorbent materials (Kumar et al., 2018). Chitosan derives from chitin and is very easy to obtain since it mainly comes from the waste of the fishing industry (Kyzas and Bikiaris, 2015). It is remarkably versatile and can be modified in different ways or combined with other types of materials to increase its adsorption capacity. However, it is also susceptible to pH, has inadequate mechanical strength, and has low thermal stability (Lou and Deng, 2019). Chitosan-zeolite composites combine the physical properties of their components to obtain new structural or functional properties. In particular, zeolite improves the mechanical strength of the resulting material by becoming the dispersed phase within the chitosan polymeric matrix (Flores, 2015). This research project aims to evaluate, in kinetic terms, the performance of a chitosan-chabazite composite in removing the colorant Eriochrome Black T from water by using bench tests.
Materials and methods
Only analytical grade reagents and deionized water were used in the experiments conducted in this research. Low molecular weight deacetylated chitosan, acetic acid, and sodium hydroxide were supplied by Sigma-Aldrich, Fermont and J.T. Baker, respectively. Chabazite type zeolite was obtained from a natural deposit located in the state of Sonora, Mexico. Indicator grade Eriochrome Black T (EBT) colorant from Sigma-Aldrich was used to prepare a 50 ppm stock solution with deionized water. 0.25 M sodium hydroxide and 5% (v/v) acetic acid solutions were used to produce the composite material.
Preparation of chabazite
A sample of chabazite was ground using a hand mortar and then sifted to obtain 100-mesh size particles. Subsequently, the mineral was rinsed twice in a beaker with deionized water, each episode with a duration of 10 min during which shaking was provided. Afterwards, the mixture was let standing still to allow the settling of chabazite particles so that decantation could be used to separate them. Chabazite sample was then dried for 24 h at 60 ºC and a product in the form of flakes was finally obtained. Chabazite was ground once more with a hand mortar as to obtain a fine powder.
Preparation of composite
Composite was prepared using the technique described by Perez et al. (2016) . The procedure involves the dissolution of 3 g of chitosan in 50 mL of a 5% (v/v) acetic solution to obtain a chitosan solution. Separately, 3 g of chabazite were mixed with 20 ml of deionized water. Both mixtures were stirred separately for 20 min and then mixed. The resulting mixture was agitated at 60 ºC for 4 hours using a magnetic bar spinning at 1,200 rpm. After stirring, the chitosan and chabazite mixture was added drop by drop to 500 mL of 0.25 M NaOH solution. This mixture was stirred for 3 hours using a magnetic bar spinning at 200 rpm while solid beads of composite formed within the mixture. Beads were separated by filtration from the liquid phase and rinsed several times with deionized water to be finally dried at 45°C for 48 hours.
Composite characterization
In order to know the surface morphology of the material, Scanning Elector Microscopy (SEM) technique was employed using an equipment JEOL, model JSM-5410LV. The presence of specific structural units at a molecular level was analyzed using a Perkin Elmer Frontier Fourier-transform infrared (FTIR) spectrometer. Physical and chemical thermic-related changes in material structure were analyzed utilizing a Perkin Elmer Pyris TGA Thermogravimetric Analyzer. The procedure consisted of placing 2.52 ± 0.19 mg of sample in a ceramic sample holder and heating it to 900 , at a rate of 10 per minute, in an atmosphere of nitrogen and dry air, using a 20 mL min-1 flow.
Kinetic experiments and models
A 50 ppm stock solution of colorant was prepared. 20 aliquots of 15 mL each were added to 50 mL flasks containing 0.5 g of composite and constant agitation was immediately provided. A different contact time between the colorant solution and the composite was assigned to each flask as to obtain a sorption curve. Aliquots’ final eriochrome black T concentrations for each contact time were determined using a Lambda 20 scanning double-beam spectrometer for the UV/Vis range from Perkin Elmer at a λmax = 570 nm.
Results and discussion
Two or more constituents with distinct characteristics form composites, one of them acting as the matrix (bulk phase) and the rest as reinforcement (dispersed phase). Components essentially maintain and complement their properties after combining. In composites, the weakness of the matrix is reduced with the assistance of the appropriate filler (Taaca and Vasquez Jr., 2017). The importance of composites ensues from the variety of their applications.
Chitosan is a linear copolymer of linked β-(1,4)-glucosamine molecules that can be easily obtained (figure 1) by the deacetylation reaction of the acetoamide groups in chitin using an alkaline solution (Szatkowski et al., 2015). This reaction produces a high quantity of amino groups, situated at the C-2 position, that can be protonated and interact with organic dyes, like anionic azo-type, and many metals anions (Saha et al., 2010). The electrolytic and chelating ability of chitosan is determined by the protonation degree of the group (pK=6.3), which is dependent on pH (Dambies et al., 2001; An and Dultz, 2007). At pH < 6.3, the free amino groups become protonated and positively charged. At a pH >6.3, amino groups deprotonate, and chitosan exhibits no charge. Additionally, two more reactive functional groups are present in the chitosan polymeric chain, namely, the primary and secondary hydroxyl groups, at the C-3 and C-6 positions, respectively. The OH groups, as the amino groups, also act as coordination and reaction sites for transition metals, organic species and dyes.
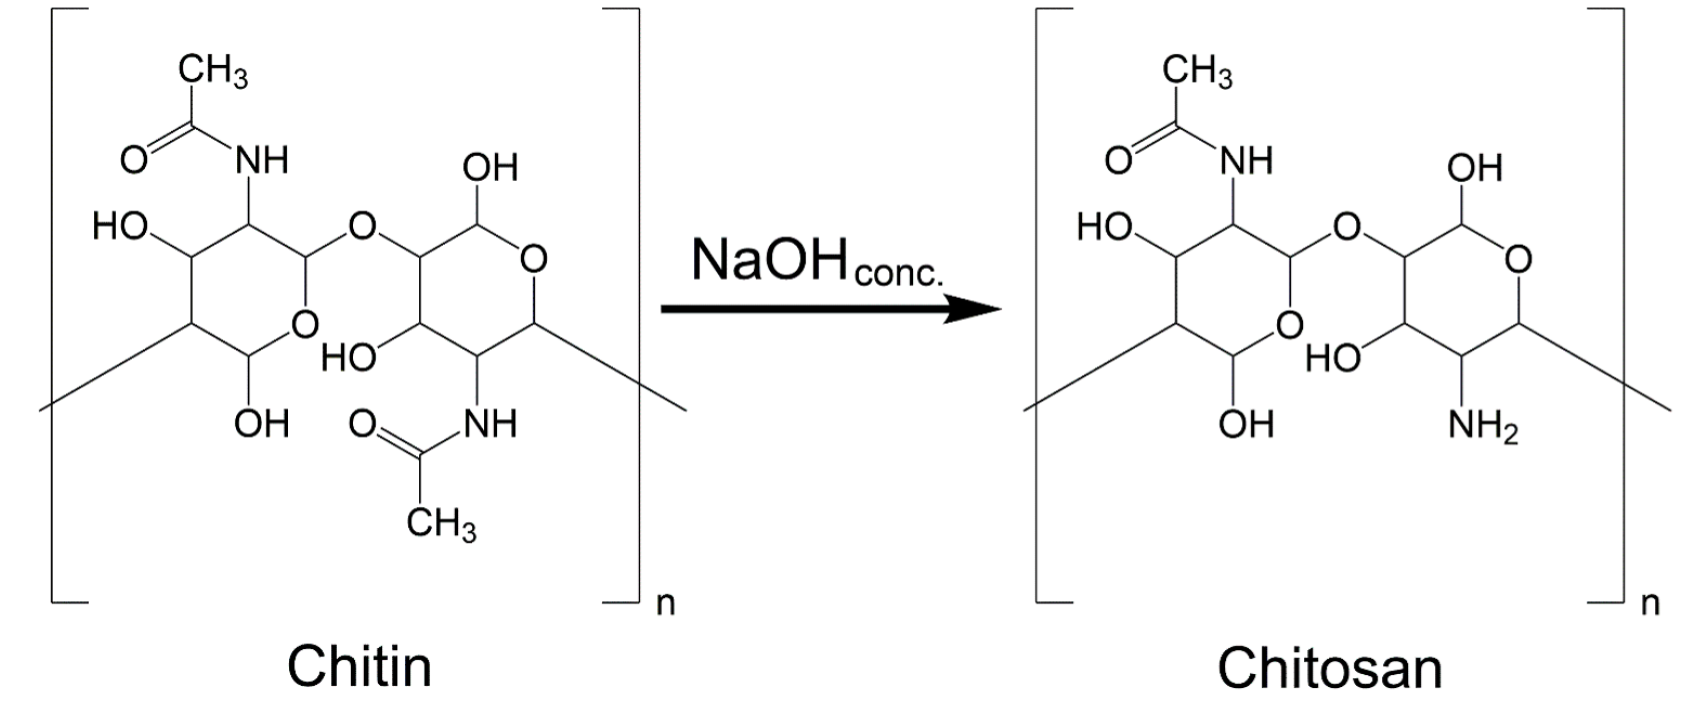
Figure 1 Schematic depiction of the chitin deacetylation reaction to form chitosan based on the
representation from Szatkowski et al., 2013.
Figura
1. Descripción esquemática de la reacción de desacetilación
de quitina para formar quitosano basada en la representación de
Szatkowski et al., 2013.
Zeolites are microporous minerals with a framework formed by aluminate and silicate tetrahedra that share vertexes. The presence of the aluminum atoms creates a negative charge in the porous structure that leads to the adsorption of a variety of easily exchangeable cations, such as Na+, K+, Ca2+, and Mg2+, that in turn, can become attached to negatively charged molecules (Bailie et al., 2001; Moienpour et al., 2014; Montalvo et al., 2020). When incorporated as the dispersed phase of a composite, zeolites can provide a rigid and stable structure to the resulting material (Taaca and Vasquez Jr., 2017). The high positive density of chitosan and zeolite favors de adsorption process of anionic dyes like EBT (Moeinpour et al., 2014; Attallah et al., 2016).
Morphological analyses
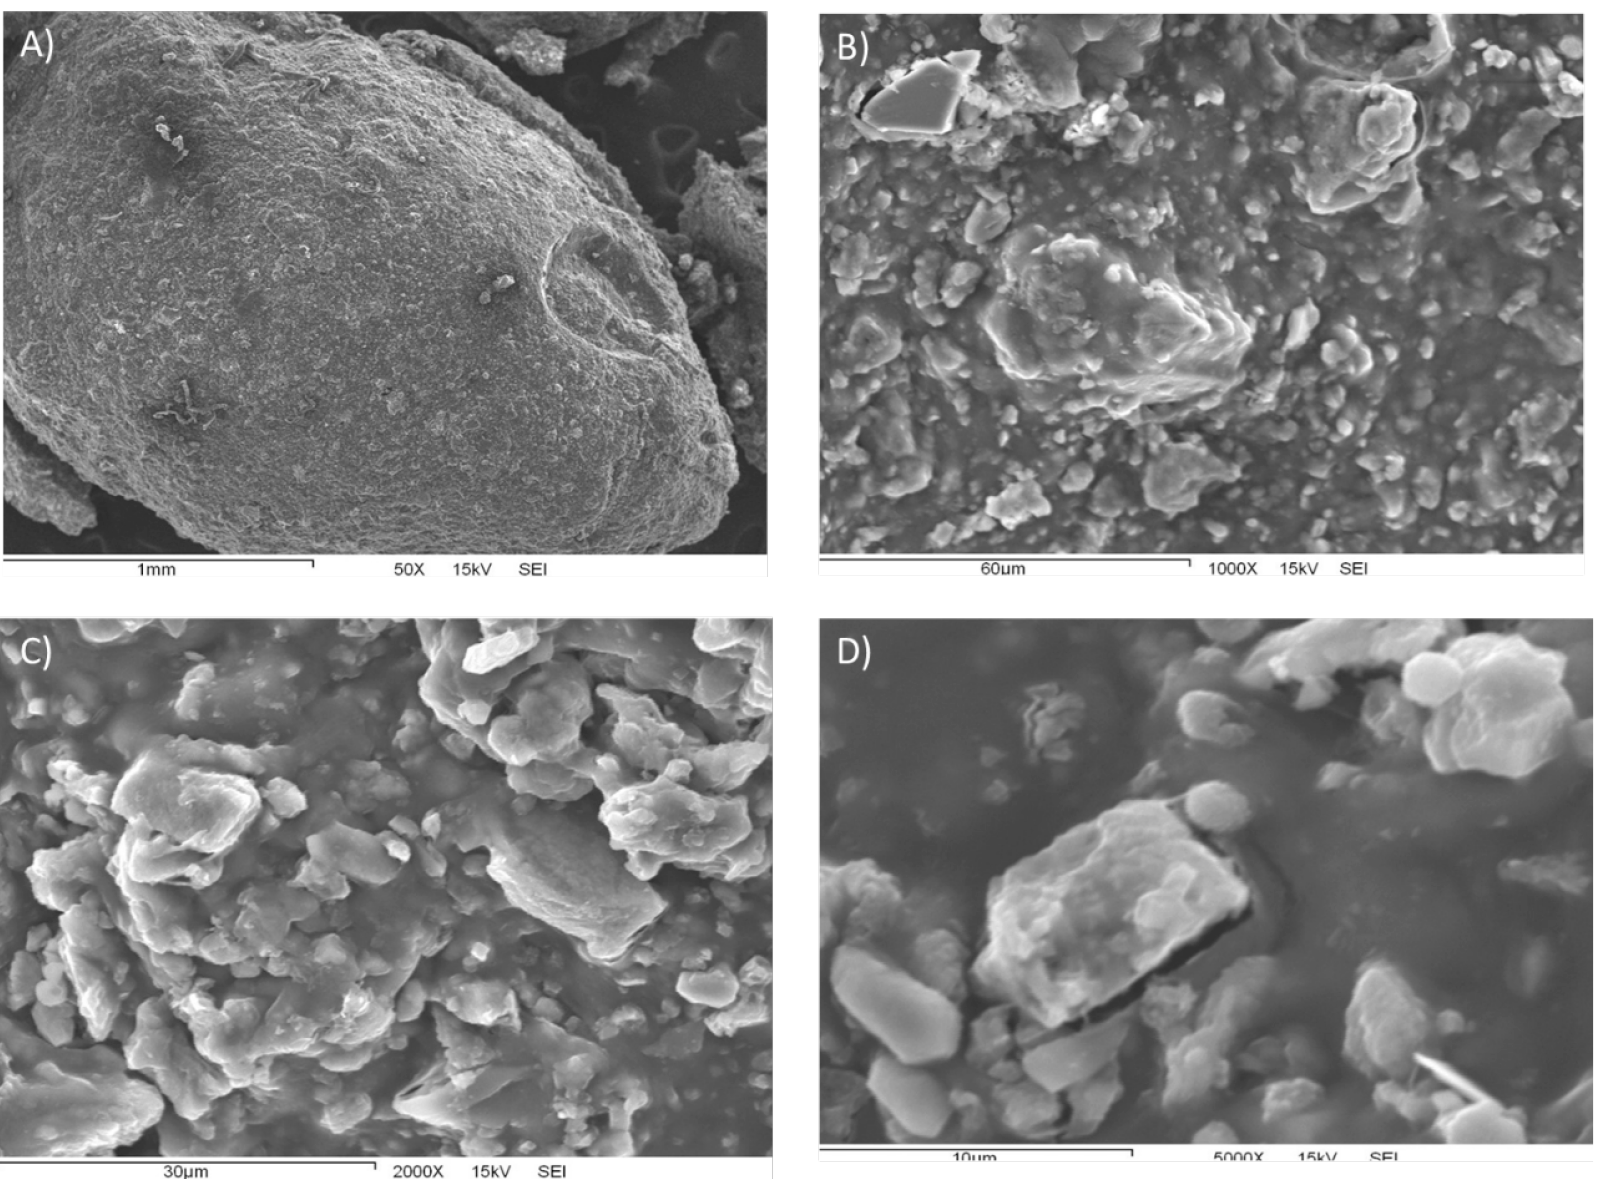
Figure 2 shows, with an increasing level of magnification, the particle morphology of the composite material that was obtained. Amplifications in images 2A), 2B), 2C), and 2D) are 50X, 1 000X, 2 000X, and 5 000 X, respectively. In figure 2A), chabazite encrustations corresponding to chabazite particles becoming encapsulated into the polymeric chitosan matrix can be seen on the surface of the composite material. The formation of an uneven surface is attributable to a relatively high proportion of zeolite with respect to chitosan, making zeolite more accessible in the composite (2 A, B, and C). The absence of porosity despite the presence of zeolite has been cited as a consequence of evaporative drying being used as part of the composite preparation process, ultimately leading to the obstruction of zeolite microporous (Djelad et al., 2016). The level of detail that was finally obtained allowed chabazite rhombohedral crystals to be noticeable.
Functional groups identification
Curves showing absorbance variation for the range of 500 cm- 1 to 4,000 cm-1 from FTIR analyses of composite and chitosan are shown in figure 3. In the chitosan spectrum, the structural units present, identified by the wave number of their bands, are the following: O-H and N-H centered around 3360 cm-1, characteristic of alcohols, amines, and amides present in the deacetylated solid structure; C-H at 2880 cm-1, protonated amino group at 1585 cm-1, saccharide unit of chitosan at 1148 cm-1, and C-N and C-O at 1029 cm-1 (Bashir et al., 2019). For chabazite, it has been reported two types of building units vibrations are characteristic; some corresponding to O-T-O symmetric, and asymmetric stretching and bending, and those related to T-O-T linkages that involved a bridging oxygen atom; where T designates a Si or Al atom in the chabazite TO4 tetrahedral building unit (Dimowa et al., 2018), with strong bands associated to Si-O-Si and Si-O-Al groups vibrations are located in the wavelength region of 700 to 1200 cm-1. Also, a band at roughly 1650 cm-1 represents the bending vibration of H2O molecules and T-O stretching (Falk, 1984; Dimowa et al., 2018) and those at approximately 3670 and 3450 cm-1 denote isolated and H-bonded O-H stretching, respectively (Aysan et al., 2019). Bands corresponding to 6 membered rings are located between 570 and 635 cm-1; H2O bending and T-O stretching at approximately 1660 and 1044 cm-1, respectively, isolated and H-bonded O-H stretching at 3669 and 3443 cm-1, respectively, and external T-O at 762 cm-1 (Aysan et al., 2016).
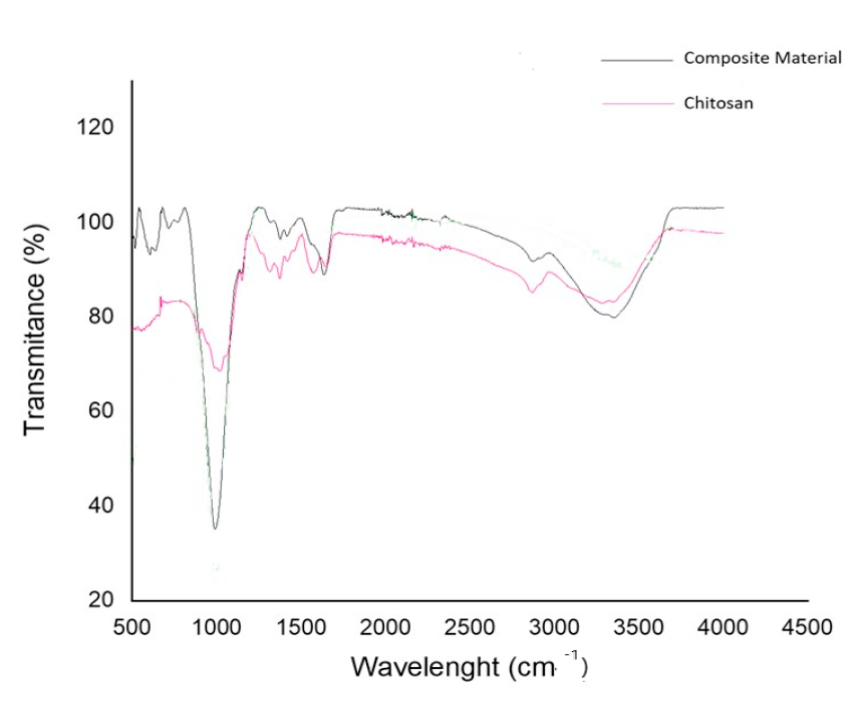
Figure 3 FTIR spectrums of chitosan and composite.
Figura 3. Espectros
FTIR del quitosano y el material compuesto.
The composite spectrum shows peaks at approximately 3360, 2880, and 1585 cm-1 like chitosan, and at 1650 cm-1 similarly to chabazite. The peak at approximately 1,030 cm-1 coincides with bands of both, chitosan and zeolite, located in the vicinity of that value.
Thermal stability results
The results of the thermo-gravimetric analysis shed light on the thermo-resistance of the composite material and determine the temperature at which changes affecting its chemical structure occur. The progressive weight loss that ensued as temperature increased is shown in figure 4. Three important stages can be identified along the curve describing the weight decrement associated with temperature increase; the first one takes place between 30 ℃ and 225 ℃ and corresponds to a 12.5% weight reduction in the composite material originated by moisture loss. This was followed by a significant decrease of up to 24.5% between 225°C to 455°C, that becomes particularly abrupt at 275°C, that relates to the degradation of the saccharides in the molecular structure of the chitosan. Finally, the last stage occurs when temperature increases from 455°C to 790°C, and leads to the final decomposition of the material at approximately 680°C. This behavior is in accordance with what was reported by Escobar et al. (2013), and Djelad et al. (2016) .
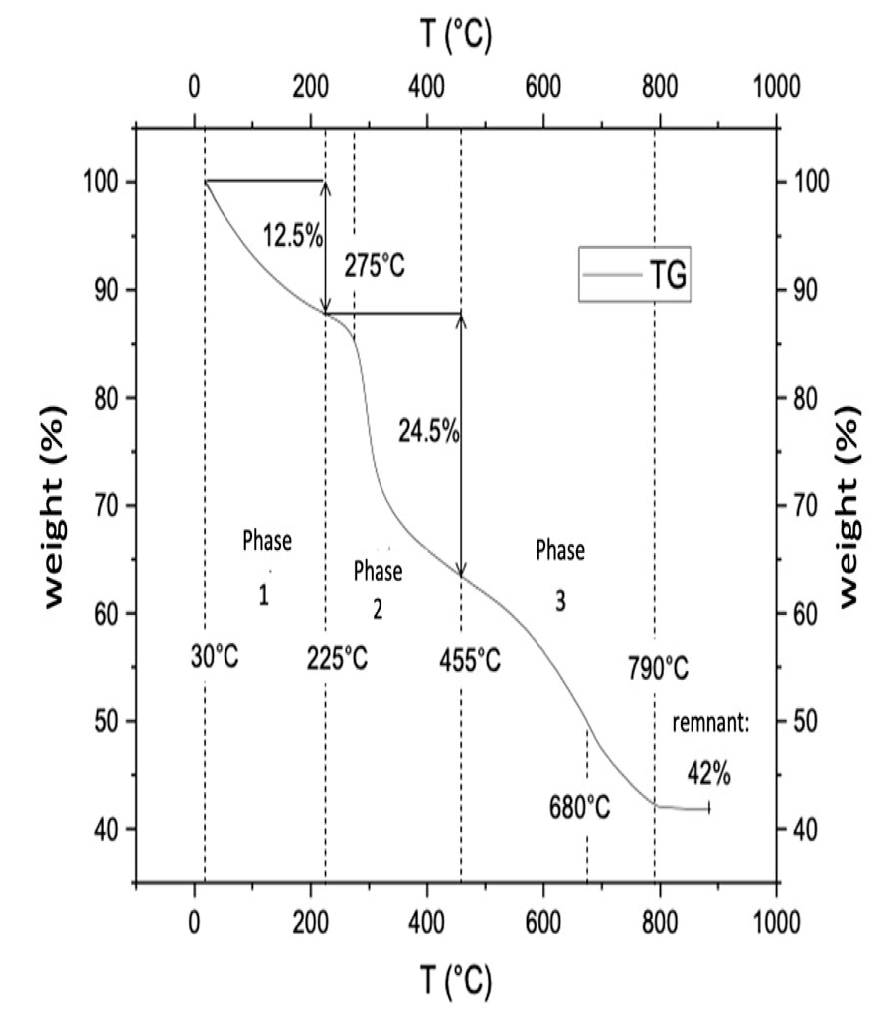
Figure 4 Weight reduction for composite material obtained from the thermogravimetric analysis
results.
Figura 4. Pérdida de peso del material
compuesto obtenida de los resultados de los análisis
termogravimétricos.
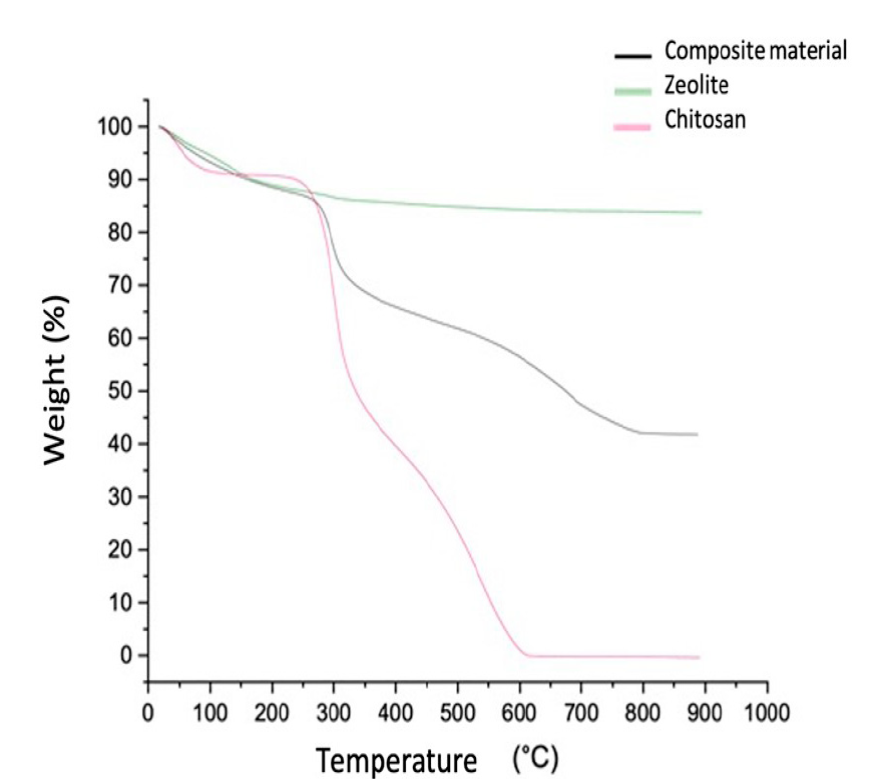
The analysis shows that dry chabazite accounts for 42% of the total mass of the composite material. This can be seen more clearly in figure 5, where the paths of weight loss through time obtained from thermogravimetric analyses performed on separate samples of zeolite, composite material and chitosan are shown graphically. The curve on the top reveals that the total weight reduction for zeolite came to be approximately 15 % of its initial value. The curve describes the gradual loss of weight that took place as temperature rose from 25 to 300 ºC and the stabilization of sample weight that ensued from this point up to 900 ºC. The noticeable absence of inflection points denotes that only one mechanism is responsible for the initial weight loss, namely, loss of humidity, and that no chemical transformations in zeolite structure that involve the release of gaseous compounds ever occurred. Curves corresponding to composite material and chitosan, exhibit a similar shape, though chitosan curve, previously shown with more detail in figure 4, is much steeper than that of the composite. The temperatures at which inflection points are located along these two curves are strikingly similar up to 400 ℃; above it, the inflection points in the composite material curve are shown at a higher temperature than in that of chitosan. This seems to indicate that chitosan, when being an integral part of the composite, degrades at a slower rate than pure chitosan at high temperatures.
Adsorption kinetics
Experimental data, were analyzed using the linearized forms of the equations corresponding to pseudo-first order (PFO) (Lagergren and Vetenskapsakademiens, 1898); the pseudo-second order (PSO), the intraparticle diffusion (IP), and the Elovich models.
The equation for Lagergren’s pseudo-first order model is:
Where q e (mg/g) designates the concentration of colorant in the composite material once equilibrium has been reached and q t (mg/g) to the solid phase concentration at a particular time t (min), while k 1 (min-1) denotes the first-order rate constant.
Assumptions made regarding this model are: 1) adsorption takes place exclusively in specific sites and adsorbed ions do not interact with one another; 2) adsorption energy is not determined by surface coverage; 3) only a monolayer of adsorbate can be formed on sorbent surface and, consequently, a saturated monolayer constitutes the maximum level of adsorption that can be attained, 4) adsorbate concentration is essentially constant, and 5) adsorbate sorption obeys a first-order rate equation (Largitte and Pasquier, 2016).
The equation describing the PSO kinetics model, developed by Ho and McKay (1999) , is:
In which k 2 (g mg-1 min-1) designates the PSO rate constant and the rest of the variables have the same meaning as in the first-order rate equation. According to this model, adsorption rate depends on the number of active sites available on the solute surface, being the difference between solid phase concentration at equilibrium and its value at any particular time prior to reaching that state, the driving force behind the process (Kajjumba et al., 2018).
Sorption data from systems that conforms to the IP model fit the following equation:
If such is the case, by plotting q t values versus t 0.5 , a straight line, with a slope equal to k p and with the value for C being given by intersection with axis y, will be obtained. k p (mg g-1min-0.5), is the IP diffusion rate constant, and C (mg g-1) is a parameter related to boundary layer thickness.
This model is used to determine if one particular step of the adsorption process controls adsorption rate; three stages being considered. The first one, referred to as film diffusion, relates to sorbate gradual migration from boundary layer to sorbent surface. Then, adsorbate internal diffusion into pores comes about, followed by its final attachment to active sorption sites inside pores (Pholosi et al., 2020). Which stage exerts a higher influence in the adsorption process depends on system conditions. In systems with very limited agitation and low concentration, film diffusion acts as the rate controlling step; otherwise, the adsorption is controlled by IP diffusion.
According to the Elovich model, adsorption is ruled by the equation:
Where α (mg g-1 min-1) is the initial adsorption rate, while β (g mg-1) is desorption constant. This model assumes that solute concentration decreases exponentially while the amount of solute adsorbed increases (Kajjumba et al., 2018).
Data obtained from kinetic experiments consisted of colorant concentration values in the liquid phase measured at different times, when the solution initial concentration, pH and volume were kept constant, as well as the amount of sorbent used. Figure 6 shows the decrease in the liquid concentration of Eriochrome Black T colorant with time when 15 mL of a 50 ppm solution were placed in contact with 0.5 g of composite material. The concentration of the solution once equilibrium was reached was approximately 7.0 ppm and that of sorbent 4.25 mg g-1. This represents an 86% reduction of solution dye concentration in approximately 500 minutes and implies that the material has the capacity of appreciably removing Eriochrome Black T dye from water.
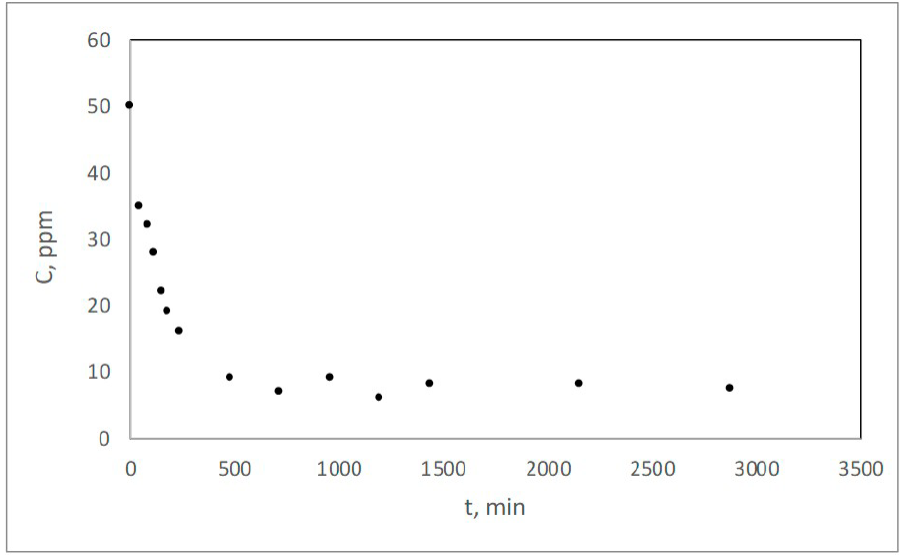
Figure 6 Change in solution dye concentration with time in the kinetic experiments.
Figura 6. Cambio en la concentración de la
solución de colorante a través del tiempo en los experimentos
cinéticos.
The extent to which the values derived from experimental information actually fitted a straight line, when the linearized forms of the equations describing each particular kinetic model were considered, was assessed by plotting In(q
e
- q
t
)vs t for the PFO model case, and
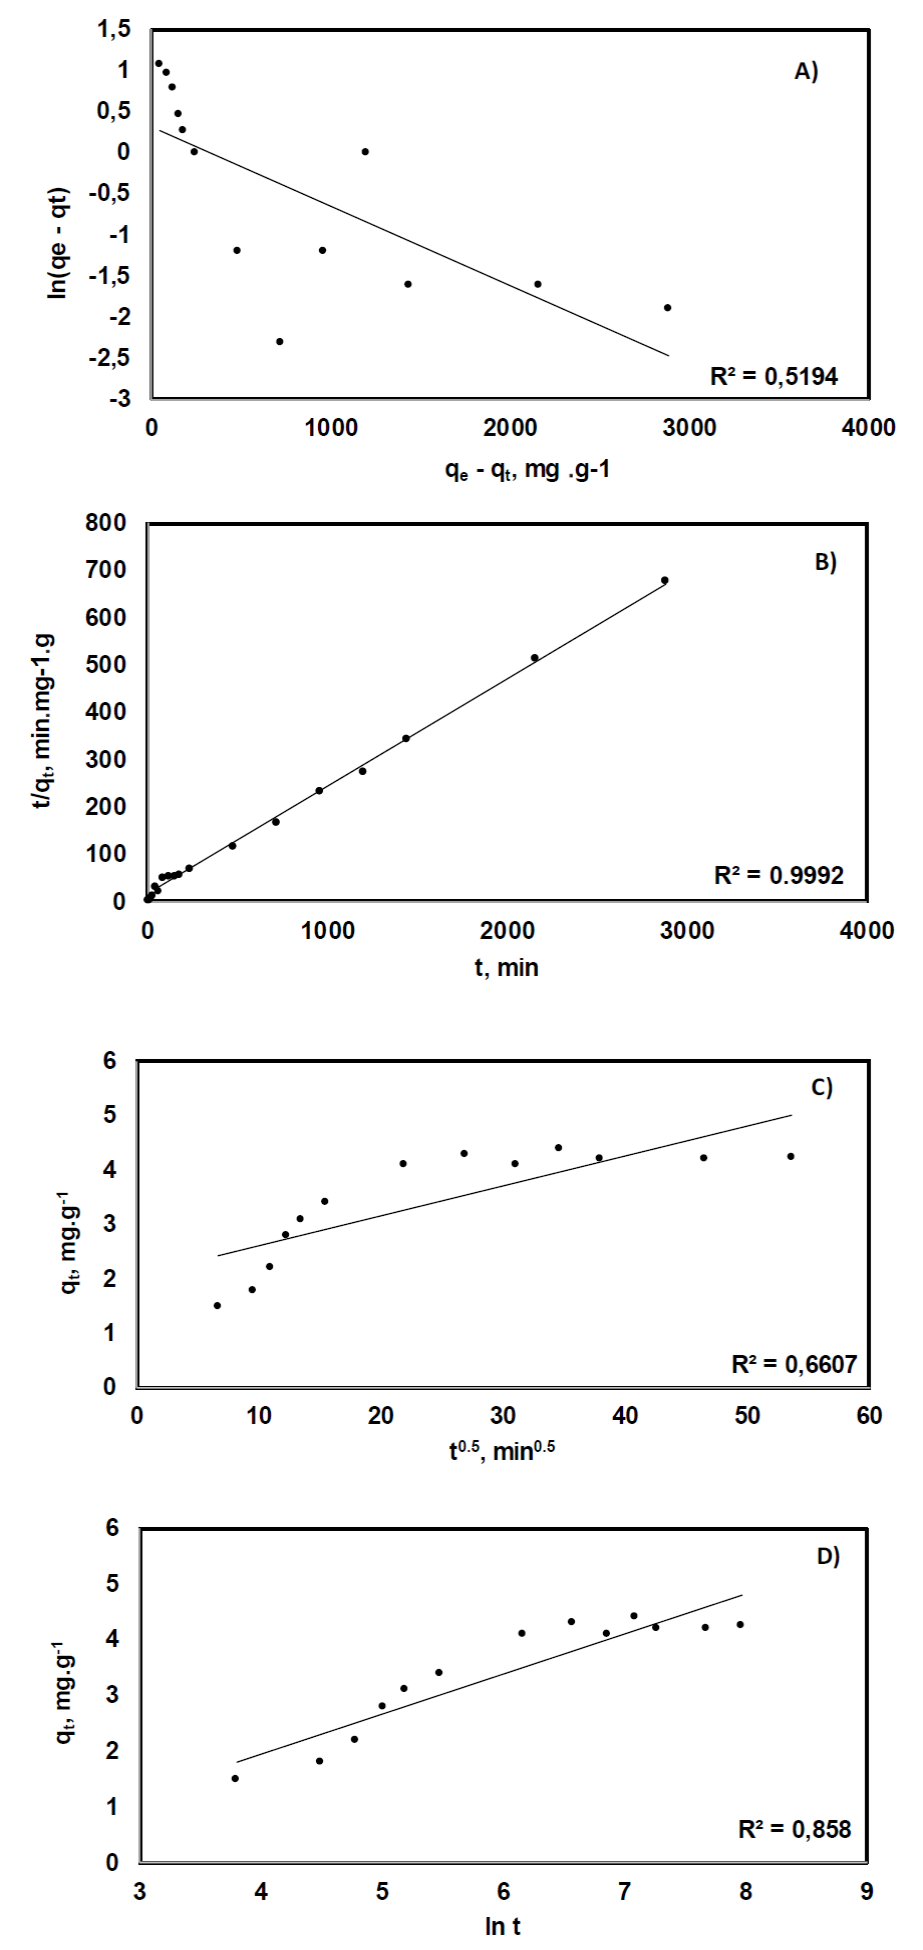
Figure 7 Charts showing the plotting of data derived from experimental results according to the
linearized forms of the PSF order (A), PSO (B), IP (C), and Elovich
(D) equations; straight lines obtained from linear regression
analysis are also on view.
Figura 7.
Distribución de los datos obtenidos a partir de los resultados
experimentales según las formas linearizadas de las ecuaciones de
pseudo-primer orden (A), pseudo-segundo orden (B), difusión
intraparticular (C) y Elovich (D); las rectas obtenidas a partir de
análisis de regresión lineal también se muestran.
The PFO and PSO models have been commonly used to characterize the nature of an adsorption process. Neither of these two approaches take into account the effect of mass diffusion in relation to the adsorption/desorption process, but rather they are based on the consideration that it is the rate at which the sorbate interacts with the sorbent surface, and the type of that interaction, assumed to be inherently irreversible in nature, that actually controls the sorption kinetics (Plazinski et al, 2013). For systems that fit the PFO adsorption model, it is believed that the adsorbate binds to the sorbent surface through physisorption, whereas chemisorption is the mechanism associated with a PSO model. The surface reactions that schematically show the attachment of sorbate to the surface for the PFO and PSO respectively, can be represented by the following equations (Largitte and Pasquier, 2016):
Equation 5 also depicts the kinetic mechanism taking place in accordance to the Elovich approach, although this model assumes sorbed ions interact via chemisorption with the solid surface and that adsorption rate decreases as surface coverage increases. Chemisorption implies the formation of a chemical bond due to the transfer or sharing of electrons between sorbate and sorbent. Physisorption involves weak electrostatic attraction forces and no modification of sorbent chemical structure. Therefore, to evaluate the importance of diffusion, it is necessary to resort to other models, such as the IP model.
From the analysis of the experimental results, it turned out that the strength of the linear relationships of the data distributions, as measured by the coefficient of determination, r2, yielded an acceptable value only when the linearized form of the PSO model equation was used (figure 7), being 0.9992. This suggests that the process is governed by a second order reaction mechanism for which the general assumptions belonging to the PFO model apply. As mentioned above, it has been claimed that the fit of the data to a PSO model is indicative that chemisorption is the mechanism controlling adsorption; although this is not a generally accepted assessment and has been refuted by some researchers on the grounds that such a fact is not sufficient evidence of the formation of a chemical bond between sorbate and sorbent. Instead, initial concentration levels have been attributed a more decisive role in explaining the observed adsorption mechanisms; with the PSO process favored by low sorbate concentrations and PFO by high ones (Azizian, 2004).
Adjustment of data to the linearized form of the Elovich model yielded the second highest valued for r2, 0.858. Despite being lower than 0.9, which is considered a statically acceptable value to derive conclusions, this further corroborates, the presence of chemisorption as the main binding mechanism of sorbate to sorbent sorption. On what comes to the IP model, the low value of r2 that was obtained can be in response to the mechanical stirring provided during the experiments, which eliminated the possibility of diffusion being the limiting stage in the adsorption process.
Conclusions
The chitosan-chabazite composite obtained and studied in this research showed to have the capacity of appreciably removing Eriochrome Black T colorant from water. Evidence shows that the mechanisms controlling the adsorption process fits a PSO model under the conditions prevailing during the experiments. This may be the result of the low initial dye concentration that was used and of the formation of bonds of chemical nature between sorbate and sorbent.

