




 nueva página del texto (beta)
 Inglés (pdf)
 Artículo en XML
 Referencias del artículo

 Traducción automática
 Enviar artículo por email
 Citado por SciELO
 Similares en
SciELO

 Permalink

1 Introduction
Lower urinary tract infections (UTIs) represent a significant public health issue, particularly among women and the elderly [1]. Often, these infections result from incomplete bladder emptying, increasing the risk of complications. The neurogenic bladder arises from damage to the nerves responsible for bladder control, leading to dysfunction in its storage and emptying capacities [2]. Urinary incontinence, characterized by the involuntary loss of urine, significantly affects the quality of life of those affected. Due to significant health complications, accurate monitoring of bladder volume is a crucial tool in the diagnosis, treatment, and follow-up of various pathologies, as it provides essential information about bladder function, facilitating the identification of abnormalities and enabling more precise and effective interventions [3,4]. This monitoring is particularly beneficial in managing urinary tract infections, neurogenic bladder, and urinary incontinence.
Currently, there are invasive and non-invasive methods for monitoring bladder volume [5]. Among the invasive methods is urodynamics, a highly invasive procedure characterized by catheter insertion, which carries infection risks [6,7], however, it is considered a “gold standard” for bladder pathologies diagnostics and monitoring.
On the other hand, non-invasive methods include ultrasound, near-infrared spectroscopy (NIRS), and electrical bioimpedance [8-11]. Ultrasonography is widely used but requires expertise for proper handling and costly equipment, while the limited penetration of infrared light through tissues is a limitation of the NIRS method. In contrast, electrical bioimpedance stands out for its simplicity, as it does not require expensive equipment or specialized expertise.
Electrical bioimpedance (EBI) is a technique based on applying a low-amplitude, high frequency alternating current (AC) to the body. It measures the resistance these current encounters as it passes through different tissues. The frequency range used in EBI varies between 10 and 100 kHz [11]. Bioimpedance measurements provide valuable information about tissue composition and properties [12,13]. The number and arrangement of electrodes used may vary depending on the type of measurement to be performed. The electrodes´ configurations are bipolar, using two electrodes where the same electrodes are used for injecting current and measuring voltage; tripolar, using three electrodes, one for injecting current and two for measuring voltage; and tetrapolar, the most commonly used, with four electrodes, two for injecting current and two for measuring voltage [11,14,15].
EBI has many applications in healthcare, including body composition assessment and hydration status monitoring [16], tracking cell growth and differentiation in tissue engineering [15], cardiac monitoring [17], pulmonary monitoring [18-20], among other applications.
In recent years, EBI has gained significant importance in urology, particularly for its capacity to estimate bladder volume [11]. Various studies have focused on optimizing electrode placement to improve volume monitoring [14,21,22]. Studies have been conducted on ex vivo models [23] and simulations with phantoms [24,25,26], although few were performed on humans. Additionally, portable devices based on previous research have been developed [26-29]. The versatility of EBI has allowed its application not only in volume monitoring but also in detrusor pressure determination [30,31].
Previous studies have explored the frequency analysis of EBI to improve the measurements associated with bladder volume monitoring. In 2010, Sivkov et al. studied the variations in bladder electrical impedance in rats using frequency analysis (Fourier transform) to simultaneously assess neural activity and bladder circulation. They identified three periodic components corresponding to heart rate (1-1.67 Hz), respiration (0.2-0.33 Hz), and Mayer wave (~0.1 Hz) frequencies. They found that Mayer and respiratory impedance oscillations are neural in origin, while cardiac pulsations are influenced by arterial circulation [32]. A year later, Mudraya et al. expanded this approach by using multi-cycle harmonics to simultaneously evaluate circulation and neural activity in visceral and somatic organs, using rat bladders and human fingers [33]. In 2014, Wang and collaborators studied bladder filling in healthy men and performed frequency analysis for three bladder states: first sensation of filling, first desire to urinate, and strong desire to urinate. They observed an upward trend in the initial stage of bladder filling and a downward trend in a later stage [34].
Given the scarcity of previous studies on frequency analysis using EB for bladder volume monitoring, this study aims to expand further the frequency analysis to identify and characterize bladder filling using the EB technique. The main goal of the present work was to assess the analysis of higher frequencies to develop a more precise and non-invasive approach for bladder volume monitoring, providing a viable and effective alternative to current methods.
2 Materials and Methods
2.1 Participants
In this study, 5 healthy men aged between 20 and 25 years (mean: 22.4 ± 2.3 years), weight between 60 and 90 kg (mean: 76.12 ± 11.05 kg), height between 1.87 and 1.65 m (mean: 1.76 ± 0.08 m) and BMI between 30.07 and 19.15 kg/m2 (mean: 24.58 ± 4.18 kg/m2), with no clinical evidence of bladder dysfunction, were monitored.
All participants agreed to participate in the study by reading and signing the informed consent form.
This study is approved by the Ethics Committee of the University of Guanajuato (Approval Code CEPIUG-P27-2022). Participants were asked to shave the pubic area before the procedure to minimize hair interference and facilitate electrode placement.
2.2 Electrode Placement
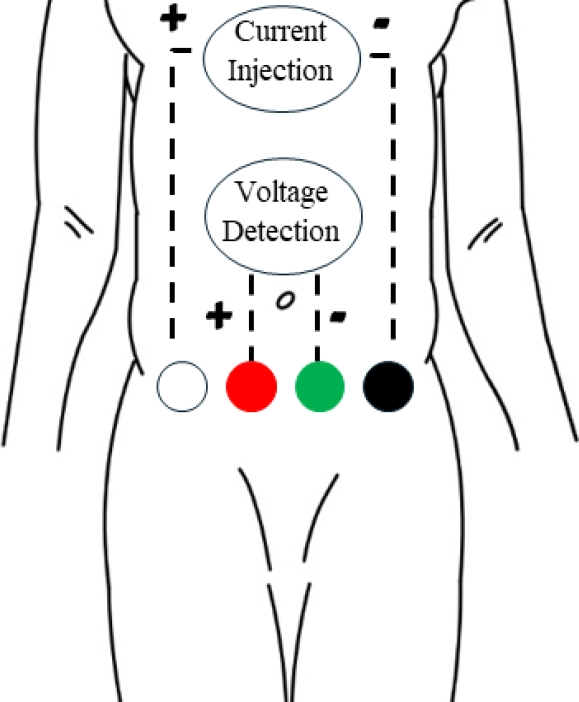
Before placing the electrodes, participants were asked to empty their bladder and lie in a supine position on an examination table. A tetrapolar configuration was used, where the electrodes (Ag/AgCl Ambiderm T125) were placed in a horizontal line over the pubic bone, as illustrated in Figure 1.
2.3 BE Measurements
The monitoring was conducted using a commercial EBI100C BIOPAC® device, which supplies a current of 440 µA at various frequencies: 12.5, 25, 50, and 100 kHz [35]. The current supplied by the equipment complies with IEC 60479-1 standards, which state that the maximum current that can be applied to the human body without risk of harm is 0.5 mA for alternating current [36].
The most commonly used frequency is 50 kHz, as it achieves an optimal balance between the resistance and reactance tissues, allowing for more precise measurements. At this frequency, the maximum values of reactance and phase angle are reached, improving sensitivity in the detection of bioelectrical changes [37].
For this, a frequency of 50 kHz was used, and the sampling rate was set as 625 samples per second. Once the electrodes were placed on the participant, 100 ml of water was administered orally, and the device was connected as shown in Figure 1. Participants were instructed to remain relaxed and still during the measurement period, which varied depending on each participant's filling capacity. Data were collected for at the beginning (voided bladder) and the end (urgent need for urination) of the procedure, analyzing 13.1 seconds of data.
2.4 Frequency Analysis
The acquired signals were processed using Python software. Data were collected at the beginning and end of the measurement. The acquired bioimpedance data were converted to output voltage data using the following equation:
where Z is the bioimpedance modulus (Ohm), ρ is the phase angle of the signal (°), ω is the angular frequency of the BIOPAC device (rad), t is the time corresponding to the data (s).
Subsequently, the voltage data were transformed into the frequency domain using the Fourier transform. This allowed for obtaining frequency spectra to identify the high frequency dominant harmonics in the signals for the voided and full bladder.
A Gaussian mask centered on these harmonics was applied to filter the signals and detect significant patterns and characteristics in bladder impedance. The Gaussian mask that was used considers three important points where was observed a decreasing trend.
3 Results and Discussion
As it was mentioned in the introduction section, previous studies were focused on the main frequencies' components, leaving higher frequencies' harmonics unattended. For the present study, 5 health volunteers were analyzed in order to expand the reach of FFT of bioimpedance signals. Upon analyzing the acquired bioimpedance data, no significant frequency components were found, leading to the conversion of bioimpedance data to output voltage data as mentioned in the frequency analysis section of materials and methods (eq.1).
The reduction in signal amplitude is related to a decrease in impedance, suggesting that there is a direct connection between bladder volume and tissue conductivity.
The decrease in urine volume in bladder may affect its capacity to store electrical charge. The mechanism of charge store in the bladder is related to the ability to the tissue to accumulate ions, creating an electrical balance.
A reduction in the amount of urine decreases the amount of charge that can be stored, resulting in a decrease in impedance.
At the frequency of 51 Hz, participants 3, 4, and 5 showed an increase in amplitude in the final graphs. Additionally, participant 4 presented this amplitude increase at frequencies of 37 and 44 Hz.
On the other hand, participant 5 showed an increase in amplitude at the frequency of 44 Hz in the final graph. Although FFT spectra was different for each participant, they presented similar 4 frequency patterns.
Table 1 summarizes this FFT data. The observed differences between participants may be due to physiological factors such as tissue conductivity and the anatomical structure of everyone.
Table.1 FFT data analysis (indicate the frequencies who do not follow the decreasing trend)
| Participant | Frequency [Hz] | Amplitude (voided bladder), [dB] | Amplitude (full bladder), [dB] | Increase or decrease |
| 1 | 9 | 63374 | 55503 | ↓ |
| 33 | 7993 | 6043 | ↓ | |
| 42 | 128460 | 111040 | ↓ | |
| 51 | 184340 | 169570 | ↓ | |
| 93 | 39516 | 31503 | ↓ | |
| 135 | 5987 | 4200 | ↓ | |
| 2 | 8 | 250780 | 220190 | ↓ |
| 34 | 21680 | 5336 | ↓ | |
| 42 | 60576 | 32442 | ↓ | |
| 51 | 531180 | 519320 | ↓ | |
| 85 | 73133 | 57141 | ↓ | |
| 93 | 243370 | 220790 | ↓ | |
| 3 | 8 | 491520 | 337850 | ↓ |
| 34 | 54828 | 17405 | ↓ | |
| 42 | 724570 | 44839 | ↓ | |
| 51* | 1236200 | 1258700 | ↑ | |
| 84 | 14284 | 3378 | ↓ | |
| 93 | 483200 | 357510 | ↓ | |
| 4 | 7 | 173010 | 171230 | ↓ |
| 37* | 11841 | 15578 | ↑ | |
| 44* | 65609 | 183920 | ↑ | |
| 51* | 572750 | 672080 | ↑ | |
| 88 | 25356 | 14023 | ↓ | |
| 95 | 154760 | 149960 | ↓ | |
| 5 | 6 | 448990 | 200790 | ↓ |
| 38 | 53797 | 5558 | ↓ | |
| 44* | 545780 | 1054800 | ↑ | |
| 51* | 141040 | 1303100 | ↑ | |
| 89 | 128240 | 33256 | ↓ | |
| 95 | 417970 | 225170 | ↓ |
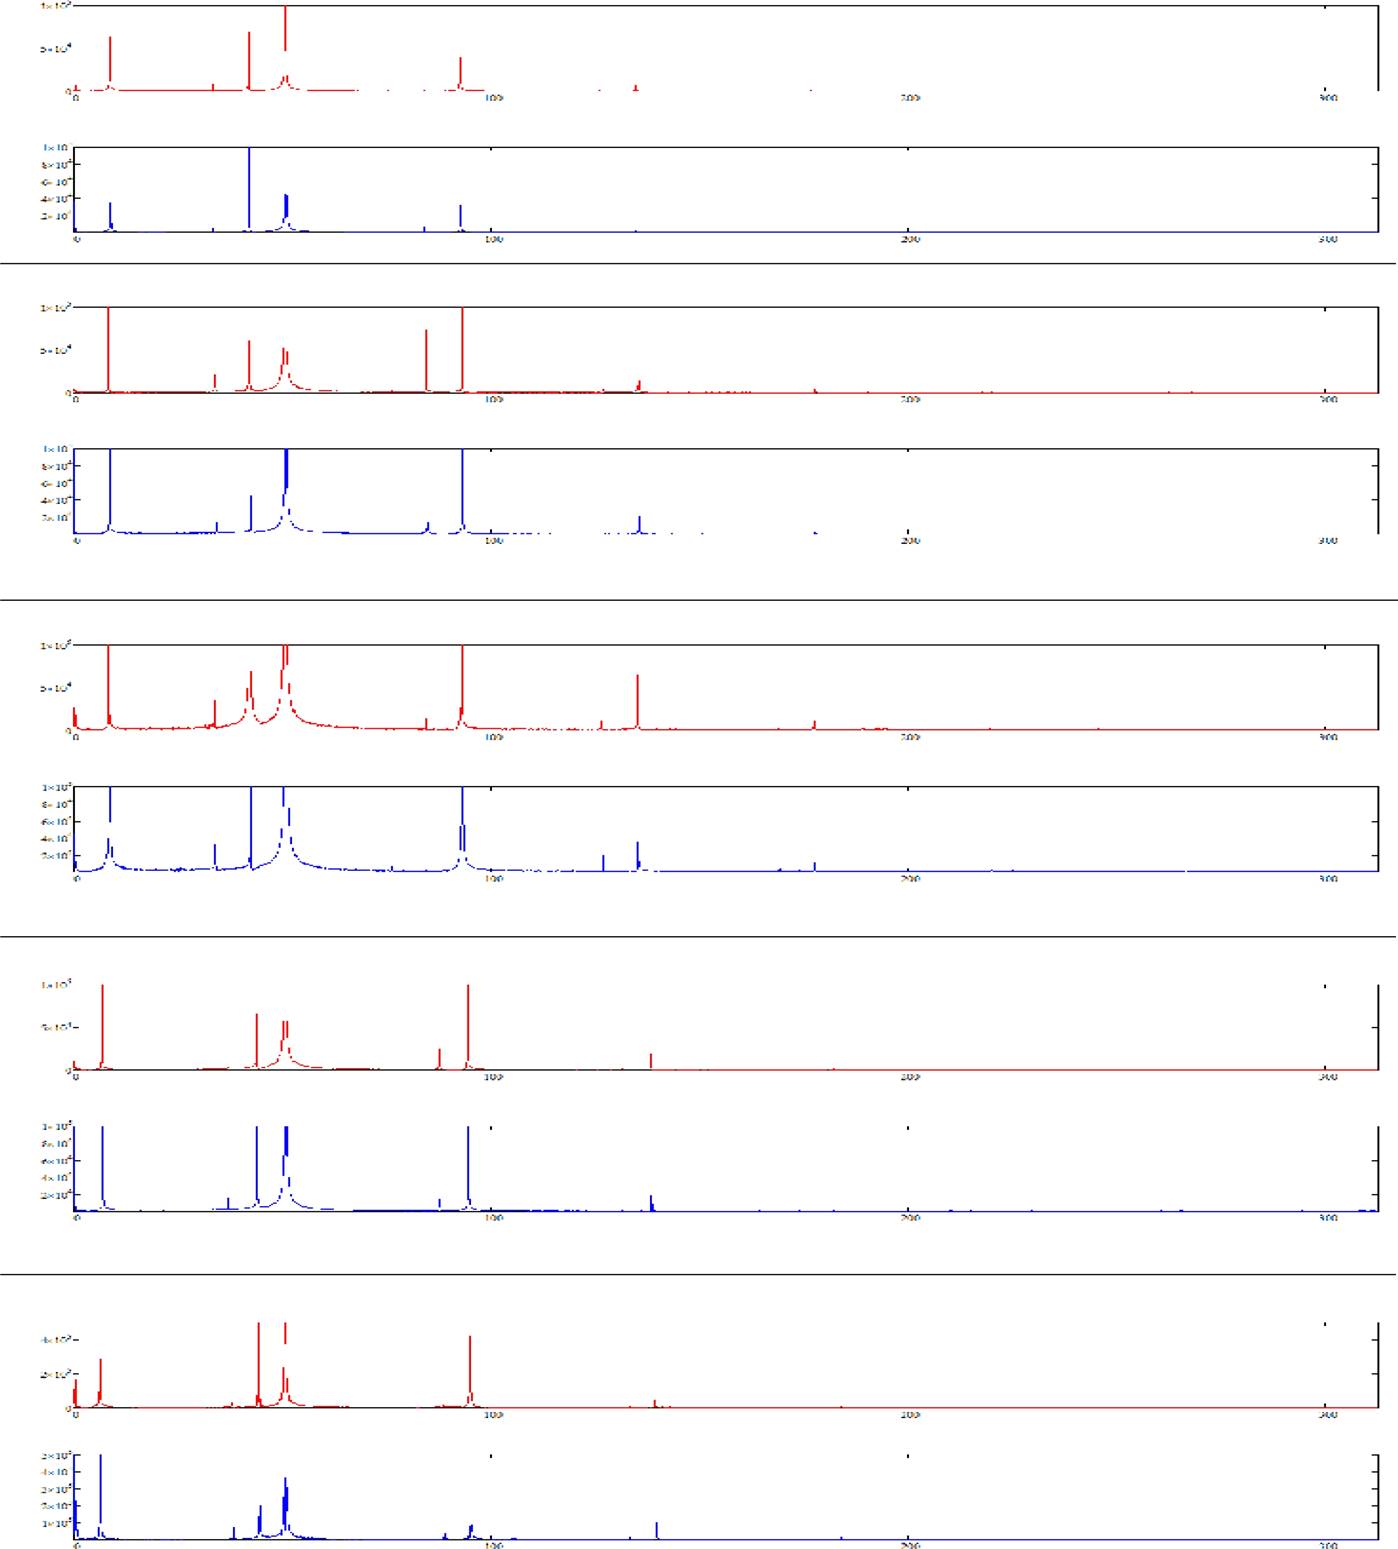
Fig. 2 FFT spectra obtained for each participant (* indicate the frequencies presented in table 1). The FFT spectra obtained for the initial and final data of each participant are shown in Figure 2, where a reduction in amplitude in the final graph for each participant can be observed, with some exceptions
4 Conclusions
The obtained results emphasize the relevance of high-frequency analysis for monitoring bladder volume and detecting changes using BE. The conversion of bioimpedance data to output voltage data allowed for effective manipulation and analysis of the signals, reflecting the patterns observed in the FFT spectra and Lissajous plots. The reduction in amplitude suggests that the decrease in impedance is directly related to the reduction in bladder volume and the conductivity of the tissue.
This analysis suggests the potential for a more precise and non-invasive tool compared to current methods, also provides a better understanding of the dynamics of bladder filling and emptying.
In future research, women should be included in the analysis, and other electrode locations and different injection frequencies should be explored.
The equipment used allows working with additional frequencies, such as 12.5, 50, and 100 kHz. This could help determine if these variations improve the accuracy or usefulness of the measurements.

