


 nueva página del texto (beta)
 Inglés (pdf)
 Artículo en XML
 Referencias del artículo
 Enviar artículo por email
 Citado por SciELO
  Similares en
SciELO
Similares en
SciELO 
 Permalink
1 Introduction
The estimation of Desoxyribonucleic Acid (DNA) concentrations and purity require the use of specialized equipment, which tends to be quite expensive and not always available in low- resources laboratories. It is important to develop efforts to seek innovative and non-expensive techniques for such purpose.
Bioimpedance measurement is a simple, fast, and non-invasive technique that allows the analysis of biological samples through their electrical properties [1]. This method has proven to be effective as a biosensor for detecting specific molecular markers or genes [2,3], in addition to showing great potential and feasibility in the quantification of DNA concentrations [4,5].
Electrical bioimpedance measurement devices typically introduce a very low amperage alternating current into the biological material at different frequencies over time [6]. Bioimpedance depends on two components: resistance (R) and reactance (Xc). While resistance reflects the opposition of the sample under study to the flow of induced current, reactance refers to its capacitive behavior [6]. Although there are more sophisticated methods for performing multifrequency electrical bioimpedance (EBiS) measurements, this study aims to evaluate the utility of the “AD5933EBZ” evaluation board (Analog Devices Inc., MA, USA) in estimating DNA concentration and purity. The goal is to determine whether the reactance parameter at the characteristic frequency (obtained from EBiS measurements) can be used to achieve this.
The AD5933EBZ features a signal generator capable of producing a frequency range from 1 to 100 kHz with a resolution of 0.1 Hz [7]. We used this board to estimate concentration and purity levels in a group of DNA samples, based on the resistance and reactance values obtained. This approach aims to provide an alternative to visible (Vis) and ultraviolet (UV) spectrophotometry-based equipment, which is not always available in low-resource molecular biology laboratories.
2 Methods
The experimental design is focused on EBiS measurements in total DNA samples through AD5933EBZ. EBiS data were associated with its DNA concentrations and purity in three value ranges segmented accordingly relevance for molecular biology assays.
2.1 DNA Samples
Total DNA was extracted from 30 dental waste samples, and according to the protocol described for QIAamp DNA Micro kit ((QIAGEN QIAamp DNA Micro Kit, Cat. No. 56034 ). DNA concentration and purity was determined by the use of Spectrophotometer UV-VIS (Nanodrop 2000, Thermo Fisher Scientific – Waltham, MA USA.), thus concentrations and purity were classified in three ranges as follows: (<10 ng/µL, 10 to 25 ng/µL, >25 ng/µL) and (<1.4, 1.4 to 1.8, >1.8) for DNA concentration and purity respectively.
2.2 EBIS Measurement
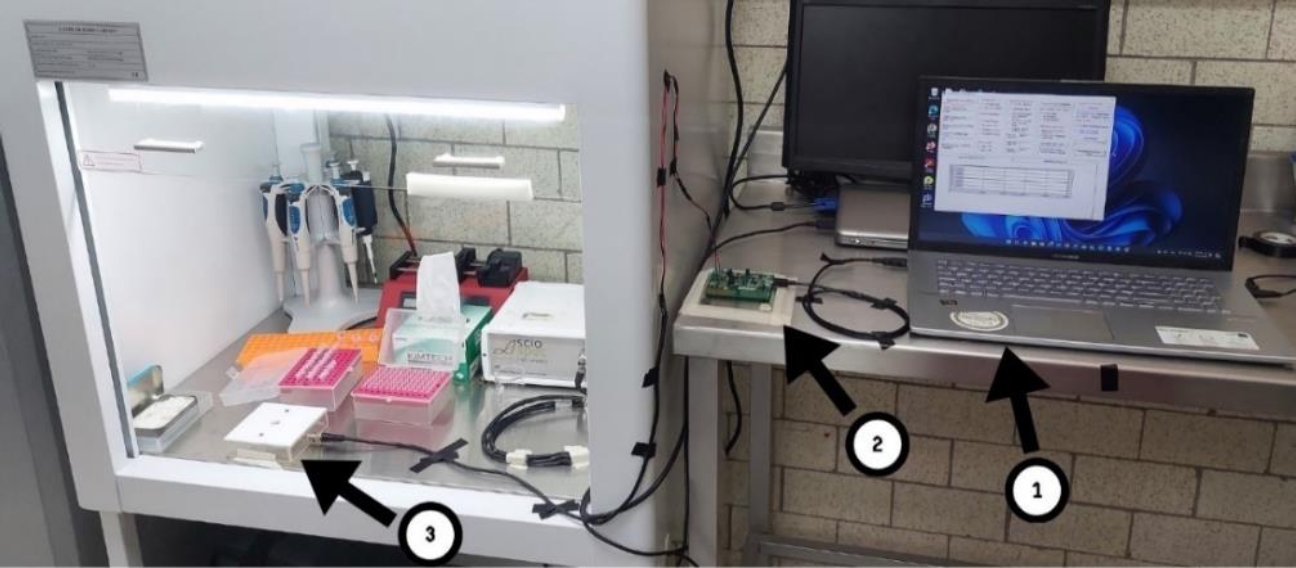
The evaluation board AD5933EBZ was calibrated accordingly procedure described in datasheet [8]. Then, a DNA volume of 2uL was drooped in a interdigitated microelectrodes array (the complete experimental design can be seen in Fig. 1). EBiS measurements were developed in the frequency range of (1 KHz to 100 KHz at 126 lineal steps). EBiS measurements were performed in triplicate for each DNA sample, and the data were analyzed and presented as three points for each bioimpedance frequency.
3 Results
Tables 1 and 2 shows the mean values for DNA concentrations and purity respectively, and according to the segmented range values.
Table 1 Mean values for DNA concentrations
| Range (ng/µL) | Mean (ng/µL) | Std Err | n |
| <10 | 6.05 | 0.46 | 15 |
| 10 to 25 | 15.54 | 1.09 | 10 |
| >25 | 31.69 | 2.56 | 5 |
Table 2 Mean values for DNA purity
| Range | Mean | Std Err | n |
| <1.4 | 1.31 | 0.01 | 21 |
| 1.4 to 1.8 | 1.53 | 0.05 | 7 |
| >1.8 | 1.83 | 0.02 | 2 |
Figures 2 and 3 show Nyquist plots for EBiS measurements, mean values were graphed for each DNA concentration and purity range within the explored frequency range.
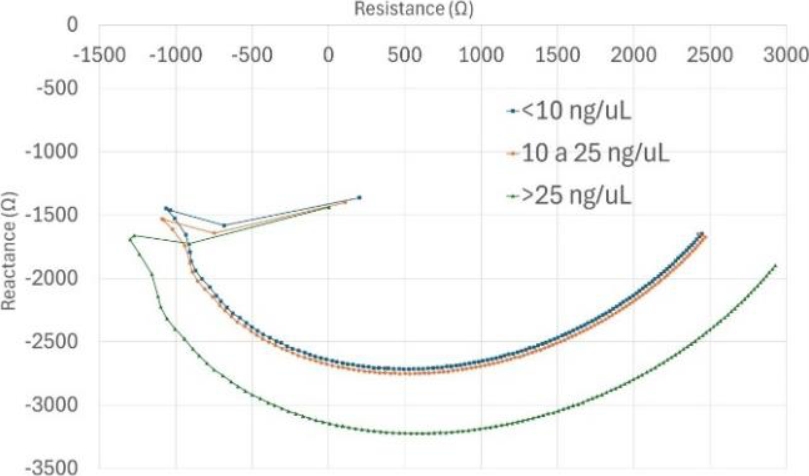
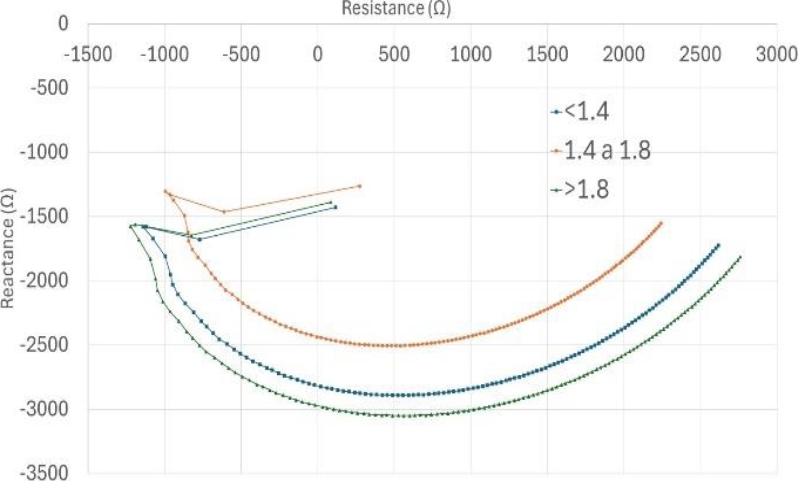
Table 3 EBiS characteristic frequency (by DNA concentration group)
| Group | Characteristic frequency |
| <10 ng/µL | 37928.5721 Hz |
| 10 to 25 ng/µL | 35571.4292 Hz |
| >25 ng/µL | 37928.5721 Hz |
Table 4 EBiS characteristic frequency (by purity group).
| Group | Characteristic frequency |
| <1.4 | 35571.4292 Hz |
| 1.4 to 1.8 | 40285.715 Hz |
| >1.8 | 37142.8578 Hz |
The next step was to identify the characteristic frequency for each concentration and purity range: it was taken as the frequency with the lowest reactance in each range.
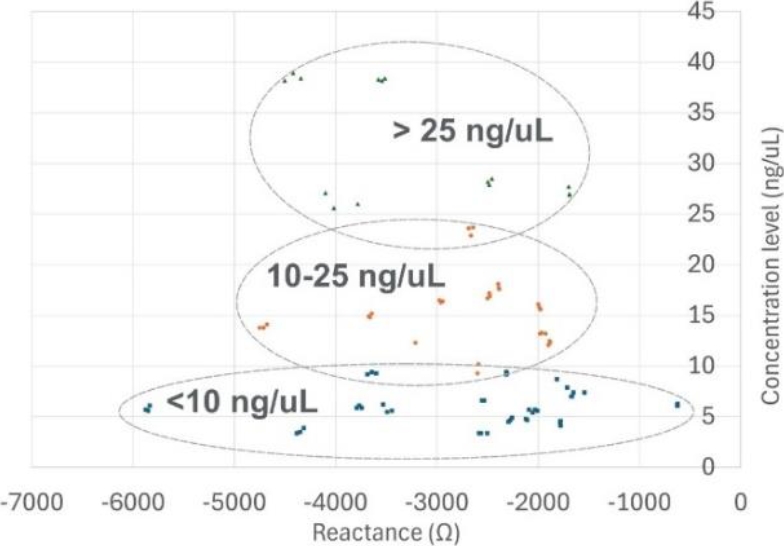
Based on the characteristic frequency we found for each group, we determined one that could serve as a reference for all samples in general (35571.4292 Hz). We plotted the raw reactance values from the three EBiS measurements for each DNA sample at that frequency to explore their dispersion as a function of concentration and purity.
4 Discussion
In the Nyquist plots obtained, it is observed that the reactance values measured with the AD5933EBZ board decrease as the DNA concentration in the samples increases. This behavior is consistent with previous research indicating that impedance is sensitive to changes in DNA concentrations [4,5].
Regarding the classification of DNA samples by purity, the analysis of the corresponding Nyquist plot shows that when the purity of the sample exceeds 1.8 (indicating low presence of contaminants [9]), the minimum reactance value tends to be below -3000 Ω. This limit is not surpassed by samples with other purity levels. This suggests that the AD5933EBZ board is capable of characterizing the purity of total DNA samples, as differences in the minimum reactance values between established classification groups can be visualized.
It is important to highlight that under heterogeneous DNA sample conditions, the reactance values at the characteristic reference frequency show less dispersion as the concentration and purity increase. This pattern may also suggest a potential limitation in the sensitivity of the AD5933EBZ system, indicating that its performance might be more efficient in samples with relatively high levels of DNA concentration and purity.
Finally, it is necessary to point out that although the AD5933EBZ evaluation board appears to be a viable alternative to specialized equipment for estimating DNA concentration and purity, the small sample size in this research justifies the need for additional studies to confirm these results.
Furthermore, the literature suggests that the impedance of a sample is highly correlated with the length of DNA fragments [10], highlighting the importance of controlling this variable in future research. Therefore, further studies are needed to explore feature extraction from EBiS measurements under controlled conditions of DNA concentration, purity, and fragment length, as well as with larger sample sizes.
5 Conclusion
EBiS measurements in total DNA samples were performed using the AD5933EBZ board, and groupings of raw reactance values were identified at a characteristic reference frequency. The reactance parameter values at the characteristic reference frequency show less dispersion as the concentration and purity of DNA increase. The usefulness of AD5933EBZ based on the reactance associated with the characteristic reference frequency seems to be feasible to detect ranges of DNA concentration and purity for values greater than 25ng/µL and 1.8, respectively.

