


 nueva página del texto (beta)
 Inglés (pdf)
 Artículo en XML
 Referencias del artículo
 Enviar artículo por email
 Citado por SciELO
  Similares en
SciELO
Similares en
SciELO 
 Permalink
INTRODUCTION
The hydrological basin is the geographical area where water flows towards a main current and then towards a common exit point. The hydrological cycle occurs in this territory, and the nature of climatic and geological origin, the kinetics and chemical composition of the water, the types of soil and sediment transport, and the biological communities confer a particular identity to the basin (Sabater et al. 2009). To determine the conservation status of a basin, it is necessary to evaluate a series of physical and chemical indicators of the water, such as biological, geological, hydromorphological, and socioeconomic descriptors, for instance legal status or ownership of the land (Hering et al. 2003, Stoddard et al. 2006). Together, these indicators allow us to recognize the reference conditions, and they serve as a basis for identifying the pressures for change promoted by anthropogenic action. Hydromorphological methods are used to understand the physical processes and causes of river alteration. For example, the Water Framework Directive (PE 2000) considers three types of indicators: (i) the hydrological regime through the flow state, the hydrodynamics of the river, and the connection with groundwater; (ii) the continuity of the river and its relationship with the riparian vegetation, and (iii) disturbances of anthropogenic origin. Other evaluation indices such as the Ecological Quality of the High Andean Rivers (CERA; Encalada et al. 2011), the Riverside Forest Quality (QBR; Munné and Prat 2004), and the Rapid Bioassessment Protocols for Use in Streams and Wadeable Rivers of the United States Environmental Protection Agency Index (USEPA; Barbour et al. 1999), have evaluation characteristics similar to the high mountain rivers of the Basin of Mexico. However, the reference conditions and disturbances that decrease the ecological quality of rivers are different for each region since they respond to a mosaic of socioeconomic conditions that function as drivers of change in different degrees. Because of this, indices are generally designed at the regional level and work well within the area for which they were designed, which means that they are subject to adjustment calibrations to represent the conditions of the study region since the indicators are built with the greatest spatial and temporal representativeness possible (Bouleau and Pont 2014). Given the rapid changes in riparian conservation status, reliable, swift, and low-cost methods must be developed (Kremen 1992, van Dam et al. 1994, McGeoch 1998).
As a solution to this problem, it has been proposed that conservation and management efforts focus on analyzing the hydromorphological structure and its relationship with biological communities, which should work as an environmental indicator under the assumption that the response to the change of the biological species is representative of a particular habitat (Andelman and Fagan 2000). The Water Framework Directive (PE 2000) proposes that the evaluation of hydromorphological quality must be continuously monitored and adjusted to identify the biotic and abiotic characteristics that indicate the state of conservation and/or deterioration of the environmental quality.
The evaluation of water quality in Mexico is developed under a utilitarian and little ecosystemic approach. Such is the case of the evaluation established by the Official Mexican Standard NOM-127-SSA1-1994 (SSA 1996), which focuses on the risk to humans from the concentration of nutrients and harmful bacteria. Also, the Mexican Standard NMX-AA-159-SCFI-2012 (SE 2012) establishes the procedure for environmental flow determination in hydrological basins, which is intended to preserve the aquatic ecosystem or carry out hydraulic works that modify the cause of the water body. For this purpose, as the norm establishes, it is necessary to evaluate the ecosystem health and its reference conditions.
This approach disregards aquatic ecosystems’ structural and functional elements, including the hydromorphological and biological components. Due to the above, in recent years, comprehensive evaluations have been proposed in Mexico that include alternative biological indicators such as algae (Salinas-Camarillo et al. 2020, Carmona-Jiménez et al. 2022), macroinvertebrates (Caro-Borrero et al. 2021), and riparian vegetation (Mendoza et al. 2014). These indicators provide greater sensitivity to ecological evaluation, are low cost, and many of them are available in standardized protocol format.
To determine the state of conservation of the Basin of Mexico, this work aimed to estimate the hydromorphological quality of the rivers and springs through the physicochemical evaluation of the water, the hydromorphological elements, and the naturalness of the riparian vegetation. These were incorporated in the proposal of an index that allows for establishing the reference conditions of the riparian ecosystem.
MATERIALS AND METHODS
Study area
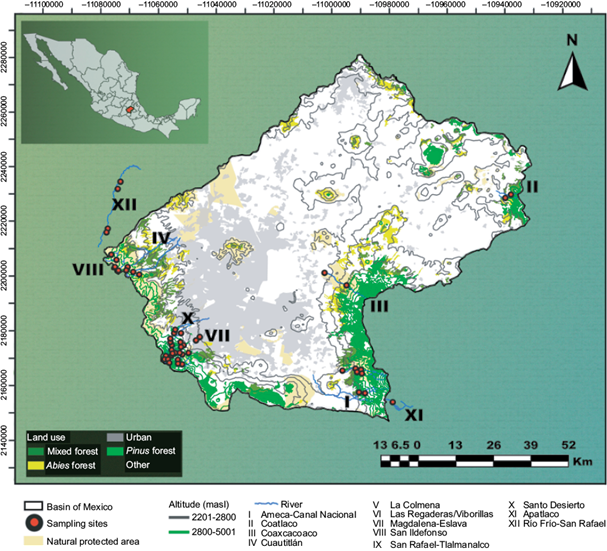
The basin of Mexico is located between 98-100º W and 19-20º N (Fig. 1). It was initially endorheic and was later artificially opened to the Pánuco River basin. It is surrounded by large mountains and/or volcanoes of the Trans-Mexican Volcanic Belt (the Ajusco to the south, the Sierra Nevada to the east, and the Sierra de las Cruces to the west). To the north, it is limited by a succession of mountains and hills (The Pitos, Tepotzotlán, Patlachique, and Santa Catarina), and to the southeast, the Popocatepetl and Iztaccihuatl volcanoes surround the basin. According to Ferrusquía-Villafranca (1993) and Legorreta (2009), 45 rivers that are still reported to exist descend from this system of mountains. The basin has an approximate area of 9600 km2, encompassing territories of the State of Mexico (50%), Hidalgo (26.5%), Mexico City (13.8%), Tlaxcala (8.7%), and Puebla (1%). Of the total area, 5136 km2 (53.5%) are flat terrain and hillslopes (2250-2400 masl), and low slopes (2-12º). The remaining 4464 km2 (46.5%) are mountainous terrain (> 2400 masl) with a steep slope (2-12º) (Lugo-Hubp 1990). In the latter, about 2000 km2 (44.8%) are occupied by human settlements, in most cases irregular because they are located in mountainous areas of ecological importance (Perló and González 2005, Aguilar 2008). From a biogeographical point of view, the rivers and springs in the basin are classified as subtropical mountain rivers (altitudes greater than 2200 masl). The rainfall (total annual precipitation of 600-1200 mm) and temperature (5-25 ºC) variation throughout the year generate a biological community with greater affinity to temperate or boreal regions (Bojorge et al. 2010). Ninety-two percent of the sites were located in the upper basin (> 2800 masl) and 8% in the lower basin (< 2800 masl). According to Legorreta (2009), the rivers and surface springs are born and run through superficial stretches between 5600 and 3200 masl altitudes before being piped in the lower basin. According to the Instituto Nacional de Geografía y Estadística (National Institute of Statistics and Geography; INEGI 2013), 70% of the land in the Basin of Mexico is used to develop primary activities (livestock, agriculture, and forestry), and 20% of the land is urban, covering most of the territory of Mexico City and some areas of the State of Mexico. Forests of Pinus, Abies, and mixed represent the vegetation. The rivers and springs of the basin originate in the mountainous areas surrounding the Basin of Mexico and are mostly modified with hydraulic infrastructure, such as small dams, diversion channels, and extraction with hoses, among others (Legorreta 2019). Other springs are owned by private agencies or used for local domestic and economic needs. The rivers circulate on different slopes for stretches of several kilometers before mixing with sewage that originates from anthropogenic activities in the urban area of the city (Legorreta 2019).
Sampling and data analysis
In this research, 63 sites (50 rivers and 13 springs) distributed in 13 sub-basins were evaluated between 2012 and 2020. Sampling was carried out in the most contrasting climatic seasons of the year (García 2004): dry winter (December to February, temperature of -2 to 25 ºC and total annual precipitation of 600 mm); dry spring (March and early June, temperature of 12 to 26 ºC and total annual precipitation of 1000 mm), and rainy summer (July to November, temperature of 13 to 23 ºC and total annual precipitation of 1200 mm). The sites were selected under the following criteria: (i) altitude greater than 2800 masl; (ii) representative of the headwaters, middle and lower zones of the rivers, including the springs, and (iii) in territorial terms that were representative of the Protected Natural Area or Conservation Soil of Mexico City. At each site, a 10-m-long stretch was selected where the following physicochemical parameters of the water were recorded in situ: temperature (°C), hydrogen ions (pH), and specific conductivity (µS/cm) measured with a YSI-85 meter (YSI-85 meter, YSI, Ohio, USA). Likewise, 500 mL of water were filtered and analyzed in the laboratory according to the criteria established by the Official Mexican Standard and international water quality standards (SSA 1996, APHA 2005). The following nutrient concentrations were determined in the laboratory with a DR 3900 spectrophotometer (Hach, Loveland, CO; Hach 2003): nitrite (NO2-N), nitrate (NO3-N), ammonium (NH4-N), dissolved inorganic nitrogen (DIN), and soluble reactive phosphorus (SRP, which theoretically is mainly in the form of orthophosphate [PO4-P]). The discharge (Qm3) was calculated from the current velocity and depth date following Gore (1996).
The hydromorphological quality (HQ) of the rivers and springs, as well as the anthropogenic activities, were evaluated and adapted from the ecological quality index of the high Andean rivers (Acosta et al. 2009, Encalada et al. 2011), which evaluates 22 parameters divided into four sections (basin, hydrology, river section, and bed). Each section has a value of 30 points, totaling 120 points. Likewise, the HQ was evaluated using the riparian vegetation quality index, which includes detailed evaluation categories on riparian vegetation structure and its indicator value (Munné et al. 2004).
The hydro morphological quality index proposal for the Basin of Mexico was adapted from the above assessments. It included the diversity and status of riparian vegetation, whether native or introduced, as well as elements of regional environmental disturbance, such as the construction of dams in the spring or the canal, tourism, the opening of trails, trout farming, and the typification of native riparian vegetation. We incorporated the size and heterogeneity of the substrate, the current velocity regimes, and the erosion of the shore bank as an element of spring evaluation (Table I). The final evaluation is divided and interpreted according to the total score in five classes of hydromorphological quality: high (> 100), good (76-99), moderate (51-75), bad (26-50), and poor (< 25). For a site to be considered a reference, more than 100 points are required. The taxonomic identity of the vegetation was recognized using Rzedowski and Calderón (2005) and Ávila-Akerberg (2010), and those species that present more than 10% abundance in at least one site were included in the index. The Shannon-Winner index was calculated to estimate differences in biological diversity between sites (Addinsoft 2021). To recognize the physicochemical and hydromorphological affinity between sites (including the characterization of the riparian vegetation), the Hierarchical Classification Analysis was performed with standardized data using the ln(x + 1) algorithm and the XLSTAT program (Addinsoft 2021).
TABLE I PARAMETERS AND SCALES TO EVALUATE THE HYDROMORPHOLOGICAL QUALITY INDEX (HYQI) IN THE BASIN OF MEXICO.
| Section | Parameter | Description | Scale | Value |
| I. Quality of the surrounding area | Riparian cover (Native) | Percent of native riparian cover: right and left bank. | > 70% of native species 69-50% of native species 49-30% of native species < 29% of native species | 10 7 4 0 |
| Bank stability | Percentage evidence of erosion or exposure of the substrate. | <10%, minimal evidence 10-50%, moderate bank 50-80%, unstable bank > 80%, eroded areas | 10 7 4 0 | |
| Pool substrate characterization and conditions | Mixture of loose stone, gravel, sand and rooted aquatic plants. Percent of disturbed substrate | < 20% of disturbed substrate 20-40% of disturbed substrate 41-80% of disturbed substrate > 80% of disturbed substrate | 10 7 4 0 | |
| Riparian zone with presence of agriculture, livestock | Percent of riparian zone used for agriculture and livestock: right and left bank | Absence of farming < 20% used 21-60% used > 60% used | 10 7 4 0 | |
| II. Hydrology | Dam present | Percent of water flow containment | Dam absence 50% of water flow through 20% of water flow through containment of water flow | 10 7 4 0 |
| Velocity/ estimated/tdstream depth (only/tdfor rivers) | Presence of four velocity regimes: slow-deep, slow-shallow, fast-deep and fast-shallow | Four velocity regimes: slow-deep, slow-shallow, fast-deep and fast-shallow 3 of the 4 regimes presents 2 of the 4 regimes presents 1 of the 4 regimes presents | 10 7 4 0 | |
| Channel alteration | Percent of channelization or water extraction pipes | Channelization or water extraction pipes absent > 40% of the stream channelized 41-60% of the stream channelized > 60% of the stream channelized | 10 7 4 0 | |
| II. Alterations caused by human activities | Presence of effluents from household use | Absence or presence | Absence Presence | 10 0 |
| Urban development | Percent of riparian zone with infrastructure (houses or roads) | Absence of settlements 20% with infrastructure 50% with infrastructure >60% with infrastructure | 10 7 4 0 | |
| Human activities | Presence and number of human activities (agriculture, livestock, fish farming, houses or shops) | Absence of human activities At least one human activity Three human activities More of three activities | 10 7 4 0 | |
| Presence of organic contamination, garbage and debris. | Percent of organic or inorganic garbage in the riparian zone | <10% garbage 20-40% garbage 50-80% garbage >80% garbage | 10 7 4 0 | |
| Water bodybr /protectionbr /(only springs) | Presence of bars or fences that limit access to the body water | Water body protected (limit access) Water body protected (free access) Partial infrastructure protected Absence of protection | 10 7 4 0 |
We used a new test set to validate the HYQI proposed, which consisted of 26 sites collected in the cool, dry season (February 13-21, 2019) spanning three of the largest sub-basins within the Basin of Mexico, at altitudes of 2333 to 3379 masl. The HYQI, physicochemical parameters, and riparian vegetation were calculated for each site.
RESULTS
The 13 sub-basins are originally associated with different legal conservation statuses within the basins. The rivers and springs were defined as: 1. Natural state: inside or outside a conservation area and 2. Canalized section: inside or outside a conservation area. The Cuautitlán, La Colmena, Las Regaderas, San Ildefonso, Apatlaco, and Río Frío-San Rafael rivers were registered as natural (Table II). In accordance with the Consejo Nacional de Áreas Naturales Protegidas (National Council of Natural Protected Areas; CONANP 2016), the shapefile was obtained with the polygons of the protected natural areas. These data were processed in a geographic information system to delimit the length and percent of the segment of each sub-basin. The rivers with the highest proportion in a natural state (Table III) were Coatlaco (85٪), Amecameca-Canal Nacional (63٪), Magdalena (61٪), and Eslava (61%). The rivers that had the lowest proportion in a natural state were Coaxcacoaco (49%), San Rafael-Tlalmanalco (37% in a natural state and 63% channeled), and Santo Desierto (23%). According to their in situ validation, the state of permanence of the 50 rivers and 13 springs studied is perennial. In contrast to our validation, the hydrological chart prepared by INEGI (2013) only considers five permanent rivers (Santo Desierto, Magdalena, San Rafael, and Cuautitlán rivers, as well as the upper area of the Ameca-Canal Nacional); the rest were indicated in an intermittent condition. Springs are not referenced within the hydrological charts.
TABLE II PHYSICOCHEMICAL AND HYDROMORPHOLOGICAL CHARACTERISTICS OF SAMPLING SITES IN THE BASIN OF MEXICO.
| Sub-basin | Sites | Condition | Stream order | Land use | HQ3 | HQ4 | Protected area | Temperature (ºC) | pH | Specific conductivity (µS/cm) | Q3 (m3s-1) | TL5 |
| I. Amecameca-Canal acional | 1. La Castañeda AM1 | P | 4 | BM | 104 | 104 | No | 4.9 | 6.49 | 80 | 0.272 | O-M |
| 2.La Castañeda II AM2 | P | 4 | BM | 104 | 104 | No | 9.3 | 7 | 175 | 0.255 | O-M | |
| 3.La Castañeda III AM3 | P | 4 | BM | 104 | 104 | No | 6.6 | 7.1 | 178 | 0.348 | O-M | |
| 4.La Castañeda IV AM4 | P | 4 | BP | 120 | 113 | No | 8.3 | 7.3 | 255 | 0.39 | O-M | |
| 5.La Castañeda V AM5 | P | 4 | BM | 96 | 91 | No | 11 | 7.16 | 201 | 0.29 | O-M | |
| II. Coatlaco | 6.Rancho nuevo I CT1 | ND | 1 | BM | 100 | 91 | No | 11.2 | 7.4 | 61 | 0.013 | O-M |
| 7.Rancho nuevo II CT2 | ND | 2 | AP | 82 | 66 | No | 13.5 | 6.8 | 68 | 0.014 | O-M | |
| III. Coaxcacoaco | 8.Miraflores CX1 | P | 4 | AP | 74 | 60 | No | 16.7 | 7.7 | 441 | 0.330 | M-E |
| 9.Santa Catarina CX2 | P | 3 | BM | 98 | 72 | Yes | 12.3 | 7.5 | 92 | 0.335 | M-E | |
| IV. Cuautitlán | 10.Los organillos CU1 | P | 1 | AP | 108 | 96 | Yes | 10.7 | 6.65 | 124 | 0.013 | O-M |
| 11. Capoxi spring CU2 | P | 1 | BM | 114 | 110 | Yes | 13 | 6.6 | 45 | 0.007 | O-M | |
| 12. San Pedro spring CU3 | P | 1 | AP | 118 | 110 | Yes | 9 | 6.7 | 54 | 0.007 | O-M | |
| 13. Iturbide dam, spring CU4 | P | 1 | AP | 108 | 97 | Yes | 11.73 | 6.89 | 51 | 0.053 | O-M | |
| 14. Capoxi CU5 | P | 1 | BM | 114 | 110 | Yes | 11.35 | 6.8 | 46 | 0.018 | O-M | |
| V. La Colmena | 15.La Caldera LC1 | P | 4 | BE | 116 | 111 | Yes | 8.1 | 6.7 | 35 | 0.019 | O-M |
| 16.Xopachi LC2 | P | 2 | BM | 115 | 108 | Yes | 8.63 | 7.10 | 35 | 0.027 | O-M | |
| VI. Las Regaderas | 17.Monte Alegre1 LR1 | P | 3 | BP | 77 | 77 | Yes | 11.60 | 7.42 | 49 | 0.07 | O-M |
| 18.Monte Alegre2 LR2 | P | 3 | Pa | 77 | 74 | Yes | 17.65 | 7.16 | 62 | 0.05 | O-M | |
| VII. Magdalena-Eslava | 19.Chautitle ME1 | P | 1 | Pa | 116 | 111 | Yes | 5 | 6.7 | 64 | 0.151 | O-M |
| 20.Chautitle waterfall ME2 | P | 2 | BP | 120 | 117 | Yes | 6 | 7 | 64 | 0.214 | O-M | |
| 21.Confluencia ME3 | P | 4 | ZU | 54 | 36 | No | 12 | 7.1 | 86 | 0.20 | M-E | |
| 22. Eslava spring ME4 | P | 1 | BP | 110 | 117 | Yes | 8.75 | 5.7 | 112 | 0.019 | O-M | |
| 23.Santa Teresa ME5 | P | 5 | ZU | 52 | 25 | No | 12.8 | 7.6 | 80 | 0.30 | M-E | |
| 24.Truchero ME6 | P | 4 | BP | 88 | 68 | Yes | 7.6 | 7.2 | 63 | 0.421 | O-M | |
| VIII. San Ildefonso | 25.Las Palomas SI1 | P | 1 | BM | 120 | 117 | Yes | 11.75 | 7 | 48 | 0.06 | O-M |
| 26.Truchero SI2 | P | 4 | BM | 107 | 88 | Yes | 10.25 | 7.15 | 54 | 0.114 | O-M | |
| IX. San Rafael-Tlalmanalco | 27.Agua dulce SR1 | P | 4 | BM | 100 | 88 | Yes | 9 | 6.57 | 138 | 0.57 | M-E |
| 28. San Rafael channel1 SR2 | P | 4 | BM | 94 | 85 | Yes | 11.3 | 6.83 | 136 | 0.35 | O-M | |
| 29.Compañía waterfall high SR3 | P | 4 | BE | 66 | 51 | Yes | 14.9 | 6.98 | 137 | 0.046 | O-M | |
| 30.Compañía waterfall SR4 | P | 4 | BM | 112 | 95 | Yes | 10.65 | 7.15 | 153 | 0.06 | O-M | |
| 31.Cosamala high SR5 | P | 4 | BM | 92 | 87 | Yes | 8.8 | 7 | 50 | 0.528 | M-E | |
| 32.Cosamala low SR6 | P | 4 | BM | 104 | 94 | Yes | 14.6 | 7 | 99 | 0.49 | O-M | |
| 33. UAM station SR7 | P | 5 | AP | 72 | 60 | No | 0 | 0 | 0 | 0.35 | M-E | |
| 34 San Rafael channel2 SR7 | P | 4 | BM | 118 | 114 | Yes | 9.85 | 7.5 | 137 | 0.388 | O-M | |
| 35.San Rafael SR8 | P | 1 | BP | 85 | 79 | Yes | 11.95 | 5.52 | 71 | 0.056 | O-M | |
| 36.San Rafael channel3 SR9 | P | 4 | BE | 96 | 94 | Yes | 11.55 | 7 | 137 | 0.028 | O-M | |
| 37.San Rafael Vereda SR10 | P | 4 | BE | 96 | 94 | Yes | 11.55 | 7 | 137 | 0.02 | O-M | |
| >X. Santo Desierto | 38.Arroyo desierto SD1 | P | 2 | BM | 120 | 120 | Yes | 9.6 | 7 | 89 | 0.20 | O-M |
| 39.Convento SD2 | P | 2 | BM | 65 | 65 | Yes | 9.4 | 6.6 | 77 | 0.027 | M-E | |
| 40.La capilla Sta. Rosa SD3 | P | 1 | AP | 104 | 94 | Yes | 13 | 7.3 | 150 | 0.019 | O-M | |
| 41.Santa Rosa 1 SD4 | P | 2 | BM | 110 | 107 | Yes | 11.75 | 7.5 | 77 | 0.14 | O-M | |
| 42.Santa Rosa spring SD5 | P | 1 | BM | 114 | 114 | Yes | 13.3 | 7.04 | 86 | 0.018 | O-M | |
| 43.Santa Rosa 2 SD6 | P | 2 | BM | 114 | 110 | Yes | 10 | 6.48 | 78 | 0.258 | O-M | |
| 44.Truchero SD7 | P | 3 | BM | 79 | 65 | Yes | 7.4 | 6.6 | 100 | 0.038 | M-E | |
| 45.Valle de monjas SD8 | P | 2 | BM | 89 | 82 | Yes | 5.5 | 7.3 | 83 | 0.045 | M-E | |
| XI. Apatlaco | 46.Apatlaco A1 | P | 3 | BM | 111 | 94 | Yes | 10.7 | 6.92 | 58 | 0.238 | O-M |
| XII. Río Frío- San Rafael | 47.El llano1 RF1 | P | 4 | BM | 102 | 93 | Yes | 15.6 | 7.2 | 34 | 0.204 | O-M |
| 48.El llano2 RF2 | P | 4 | BM | 104 | 99 | Yes | 13.05 | 6.65 | 62 | 0.426 | O-M | |
| 49.La cabañita RF3 | P | 5 | BM | 114 | 103 | No | 13.85 | 6.8 | 78 | 1.03 | O-M | |
| 50.La planta RF4 | P | 5 | BM | 100 | 62 | No | 15 | 7.2 | 81 | 0.972 | O-M | |
| Magdalena | 51.Spring ME7 | P | 1 | BP | 96 | 79 | Yes | 9.7 | 5.7 | 65 | 0.002 | O-M |
| 52.Cañada de cuervos ME8 | I | 1 | BP | 102 | 91 | Yes | 11 | 6.5 | 72.5 | 0.004 | O-M | |
| 53.Cieneguillas dam ME9 | P | 1 | BP | 104 | 97 | Yes | 10 | 6.5 | 68 | 0.025 | O-M | |
| 54.Magdalena spring | P | 1 | BE | 110 | 103 | Yes | 10 | 6.6 | 58.9 | 0.015 | O-M | |
| 55. Cieneguillas1 ME10 | P | 2 | BP | 104 | 99 | Yes | 10 | 6.8 | 69.5 | 0.033 | O-M | |
| 56.Presa Cieneguillas2 ME11 | P | 1 | BP | 114 | 102 | Yes | 10 | 6.4 | 72 | 0.033 | O-M | |
| 57.Temascalco ME12 | P | 1 | BP | 96 | 93 | Yes | 11 | 6.4 | 95.5 | 0.015 | O-M | |
| 58.Las Rosita alto ME13 | P | 1 | MB | 114 | 110 | Yes | 10.1 | 6.3 | 129 | 0.021 | O-M | |
| 59.La rosita spring ME14 | P | 1 | BE | 102 | 90 | Yes | 10.4 | 6.8 | 113 | 0.003 | O-M | |
| 60. Ermita spring ME15 | I | 1 | MB | 114 | 92 | Yes | 10.8 | 6.9 | 118 | 0.007 | O-M | |
| 61.San José spring ME16 | P | 1 | BP | 96 | 92 | Yes | 11 | 6.5 | 97.5 | 0.019 | O-M | |
| 62.La Bodega spring ME17 | P | 1 | BE | 92 | 72 | Yes | 12 | 5.9 | 68.5 | 0.001 | O-M | |
| 63.Potrero spring ME18 | P | 1 | BP | 98 | 78 | Yes | 10.8 | 6.1 | 78.5 | 0.013 | O-M | |
| VIII. San Ildefonso | 25.Las Palomas SI1 | P | 1 | BM | 120 | 117 | Yes | 11.75 | 7 | 48 | 0.06 | O-M |
| 26.Truchero SI2 | P | 4 | BM | 107 | 88 | Yes | 10.25 | 7.15 | 54 | 0.114 | O-M | |
| IX. San Rafael-Tlalmanalco | 27.Agua dulce SR1 | P | 4 | BM | 100 | 88 | Yes | 9 | 6.57 | 138 | 0.57 | M-E |
| 28. San Rafael channel1 SR2 | P | 4 | BM | 94 | 85 | Yes | 11.3 | 6.83 | 136 | 0.35 | O-M | |
| 29.Compañía waterfall high SR3 | P | 4 | BE | 66 | 51 | Yes | 14.9 | 6.98 | 137 | 0.046 | O-M | |
| 30.Compañía waterfall SR4 | P | 4 | BM | 112 | 95 | Yes | 10.65 | 7.15 | 153 | 0.06 | O-M | |
| 31.Cosamala high SR5 | P | 4 | BM | 92 | 87 | Yes | 8.8 | 7 | 50 | 0.528 | M-E | |
| 32.Cosamala low SR6 | P | 4 | BM | 104 | 94 | Yes | 14.6 | 7 | 99 | 0.49 | O-M | |
| 33. UAM station SR7 | P | 5 | AP | 72 | 60 | No | 0 | 0 | 0 | 0.35 | M-E | |
| 34 San Rafael channel2 SR7 | P | 4 | BM | 118 | 114 | Yes | 9.85 | 7.5 | 137 | 0.388 | O-M | |
| 35.San Rafael SR8 | P | 1 | BP | 85 | 79 | Yes | 11.95 | 5.52 | 71 | 0.056 | O-M | |
| 36.San Rafael channel3 SR9 | P | 4 | BE | 96 | 94 | Yes | 11.55 | 7 | 137 | 0.028 | O-M | |
| 37.San Rafael Vereda SR10 | P | 4 | BE | 96 | 94 | Yes | 11.55 | 7 | 137 | 0.02 | O-M | |
| X. Santo Desierto | 38.Arroyo desierto SD1 | P | 2 | BM | 120 | 120 | Yes | 9.6 | 7 | 89 | 0.20 | O-M |
| 39.Convento SD2 | P | 2 | BM | 65 | 65 | Yes | 9.4 | 6.6 | 77 | 0.027 | M-E | |
| 40.La capilla Sta. Rosa SD3 | P | 1 | AP | 104 | 94 | Yes | 13 | 7.3 | 150 | 0.019 | O-M | |
| 41.Santa Rosa 1 SD4 | P | 2 | BM | 110 | 107 | Yes | 11.75 | 7.5 | 77 | 0.14 | O-M | |
| 42.Santa Rosa spring SD5 | P | 1 | BM | 114 | 114 | Yes | 13.3 | 7.04 | 86 | 0.018 | O-M | |
| 43.Santa Rosa 2 SD6 | P | 2 | BM | 114 | 110 | Yes | 10 | 6.48 | 78 | 0.258 | O-M | |
| 44.Truchero SD7 | P | 3 | BM | 79 | 65 | Yes | 7.4 | 6.6 | 100 | 0.038 | M-E | |
| 45.Valle de monjas SD8 | P | 2 | BM | 89 | 82 | Yes | 5.5 | 7.3 | 83 | 0.045 | M-E | |
| XI. Apatlaco | 46.Apatlaco A1 | P | 3 | BM | 111 | 94 | Yes | 10.7 | 6.92 | 58 | 0.238 | O-M |
| XII. Río Frío- San Rafael | 47.El llano1 RF1 | P | 4 | BM | 102 | 93 | Yes | 15.6 | 7.2 | 34 | 0.204 | O-M |
| 48.El llano2 RF2 | P | 4 | BM | 104 | 99 | Yes | 13.05 | 6.65 | 62 | 0.426 | O-M | |
| 49.La cabañita RF3 | P | 5 | BM | 114 | 103 | No | 13.85 | 6.8 | 78 | 1.03 | O-M | |
| 50.La planta RF4 | P | 5 | BM | 100 | 62 | No | 15 | 7.2 | 81 | 0.972 | O-M | |
| Magdalena | 51.Spring ME7 | P | 1 | BP | 96 | 79 | Yes | 9.7 | 5.7 | 65 | 0.002 | O-M |
| 52.Cañada de cuervos ME8 | I | 1 | BP | 102 | 91 | Yes | 11 | 6.5 | 72.5 | 0.004 | O-M | |
| 53.Cieneguillas dam ME9 | P | 1 | BP | 104 | 97 | Yes | 10 | 6.5 | 68 | 0.025 | O-M | |
| 54.Magdalena spring | P | 1 | BE | 110 | 103 | Yes | 10 | 6.6 | 58.9 | 0.015 | O-M | |
| 55. Cieneguillas1 ME10 | P | 2 | BP | 104 | 99 | Yes | 10 | 6.8 | 69.5 | 0.033 | O-M | |
| 56.Presa Cieneguillas2 ME11 | P | 1 | BP | 114 | 102 | Yes | 10 | 6.4 | 72 | 0.033 | O-M | |
| 57.Temascalco ME12 | P | 1 | BP | 96 | 93 | Yes | 11 | 6.4 | 95.5 | 0.015 | O-M | |
| 58.Las Rosita alto ME13 | P | 1 | MB | 114 | 110 | Yes | 10.1 | 6.3 | 129 | 0.021 | O-M | |
| 59.La rosita spring ME14 | P | 1 | BE | 102 | 90 | Yes | 10.4 | 6.8 | 113 | 0.003 | O-M | |
| 60. Ermita spring ME15 | I | 1 | MB | 114 | 92 | Yes | 10.8 | 6.9 | 118 | 0.007 | O-M | |
| 61.San José spring ME16 | P | 1 | BP | 96 | 92 | Yes | 11 | 6.5 | 97.5 | 0.019 | O-M | |
| 62.La Bodega spring ME17 | P | 1 | BE | 92 | 72 | Yes | 12 | 5.9 | 68.5 | 0.001 | O-M | |
| 63.Potrero spring ME18 | P | 1 | BP | 98 | 78 | Yes | 10.8 | 6.1 | 78.5 | 0.013 | O-M |
P: perennial; I: intermitent; MF: mixed forest; PA: primary activity; PF: Pinus-Abies forest; Pa: grassland; UZ: urban zone; HQ: hydromorphological quality; TL: trophic level.
1Hydromorphological quality (CERA; Encalada et al. 2001): very good (>100), good (76-99), moderate (51-75), bad (26-50), poor (< 25).
2Hydromorphological quality (HYQI): high (120-100), good (76-99), moderate (51-75), bad (26-50), poor (< 25).
3Trophic level: O: oligotrophic; M: mesotrophic; E: eutrophic (SSA 1996).
TABLE III LENGTH OF THE SUB-BASIN AND ITS PROPORTION INSIDE OR OUTSIDE PROTECTED AREAS OF THE BASIN OF MEXICO.
| Sub-basin/river | Total river longitude (km) | Channelized segment (km) | Natural segment (km) | |||||
| Out of protected area | Under protected area | Total | Under protected area | Out of protected area | Total | |||
| Ameca-Canal Nacional | 51.1 | 29.9 | 2.0 | 32 | 4.8 | 14.1 | 19 | |
| Coatlaco | 25.1 | 21.3 | - | 21.3 | - | 3.8 | 3.8 | |
| Coaxcacoaco | 37.5 | 1.8 | 16.6 | 18.4 | - | - | 19 | |
| Cuautitlán | 64.2 | 28.9 | 41.9 | 70.8 | - | - | - | |
| La Colmena | 27.1 | 22.7 | 4.4 | 27.1 | - | - | - | |
| Las Regaderas | 10.6 | 0.64 | 10.0 | 10.6 | - | - | - | |
| La Magdalena | 21.7 | - | 13.3 | 13.3 | - | 8.4 | 8.4 | |
| Eslava | 8.7 | - | 5.4 | 5.4 | - | 3.3 | 3.3 | |
| San Ildefonso | 8.4 | 1.8 | 6.7 | 8.4 | - | - | - | |
| San Rafael-Tlalmanalco | 53.4 | 7.4 | 12.0 | 19.5 | - | 33.8 | 33.8 | |
| Santo Desierto-Mixcoac | 34.2 | - | 7.9 | 7.9 | 4.3 | 21.9 | 26.2 | |
| Apatlaco | 27.2 | 23.3 | 3.8 | 27.2 | - | - | - | |
| Río Frío-San Rafael | 15.9 | 12.1 | 3.7 | 15.9 | - | - | - | |
| TOTAL | 391.3 | 150.4 | 127.8 | 277.8 | 9.2 | 85.6 | 113.5 | |
Reference conditions
The reference conditions in the rivers and springs of the Basin of Mexico were characterized by having a temperate affinity with temperatures between 5 and 17 °C, slightly acidic to neutral pH between 5 and 7.5, located in an altitude gradient between 2800 and 4700 masl, with three types of vegetation including Pinus (3400 to 3800 masl), Abies (2750- 3500 masl) and mixed forest dominated by Quercus (2620 to 3370 masl). We identified 75 plant species (Table IV). The richness and diversity were heterogeneous between sites, with a 0.4 to 15.6 diversity index value of native species. In general, this wide margin between both values is related to the sites with the greatest disturbance and the most conserved sites. The highest specific diversity was recorded in the Pinus forest, followed by the Abies and the mixed forest. On the other hand, in the mixed forest, the largest number of introduced species was recognized, associated with physical alteration of the channel structure, damming and extraction of the riverbed and springs, and deforestation. However, the decrease in richness was also naturally linked to the altitude of 3400 m. Four vegetation types were recorded, composed mainly of Abies religiosa, Prunus persica, Pinus teocote, Quercus laurina, and Cupressus lindleyi. Due to its elevation, the Abies forest can be differentiated at an altitude range of 3000 to 3500 masl (sharp slopes), the mixed forest at an altitude of 2500 to 3000 masl (mountain foothills, erosive valleys, and slopes), and the Pinus forest at an altitude range of 3500 to 3800 masl (slightly inclined slopes). These types of temperate forests are important and representative of Mexico (Ávila-Akerberg 2010). The type of vegetation defines the reference conditions, and the disturbances that decrease the ecological quality in the CERA and QBR indices differed by 50 % and were not representative of all the drivers of change present in the study area.
TABLE IV FLORISTIC RICHNESS AND LIFE FORM IN THE RIPARIAN ECOSYSTEM OF THE BASIN OF MEXICO.
| Species | Life form |
| Pinus forest (3420-3800 masl) | |
| Native species | |
| Alchemilla vulcanica Schldtl. and Cham. | Perennial grass |
| Cestrum nocturnum L. | Tree |
| Conyza sophiifolia Kunth. | Annual grass |
| Cyperus seslerioides Kunth. | Perennial grass |
| Drymaria leptophylla (Cham. and Schltdl.) Fenzl ex Rohrb. | Annual grass |
| Epilobium ciliatum Raf. | Perennial grass |
| Equisetum hyemale L. | Perennial grass |
| Erigeron pubescens Kunth. | Perennial grass |
| Eryngium carlinae F. Delaroche. | Perennial grass |
| Eupatorium sp. L. | Perennial grass |
| Gamochaeta americana (Mill.) Wedd. | Annual grass |
| Lobelia cardinalis (L.) Batsch. | Perennial grass |
| Lopçezia racemosa Cav. | Annual grass |
| Malvastrum coromandelianum (L.) Garcke. | Annual grass |
| Melampodium divaricatum (Rich.) DC. | Annual grass |
| Oenothera pubescens Willd. ex Spreng. | Perennial grass |
| Pinus hartwegii Lindl. | Tree |
| Ranunculus peciolares Humb., Bonpl. and Kunth ex DC. | Annual grass |
| Salvia mexicana L. | Annual grass |
| Solanum nigrescens M. Martens and Galeotti. | Grass |
| Stevia jorullensis Kunth. | Annual grass |
| Verbena teucriifolia M. Martens and Galeotti. | Annual grass |
| Veronica peregrina subsp. xalapensis (Kunth) Pennell. | Annual grass |
| Introduced species | |
| Plantago major L. | Annual grass |
| Poa annua L. | Annual grass |
| Reseda luteola L. | Annual grass |
| Taraxacum officinale F.H. Wigg. | Perennial grass |
| Abies forest (2750-3500 masl) | |
| Native species | |
| Abies religiosa (Kunth) Schltdl. and Cham. | Tree |
| Acaena elongata L. | Grass |
| Alchemilla pectinata Kant. | Perennial grass |
| Alchemilla pringlei (Rydb.) Fedde | Perennial grass |
| Alnus jorullensis Kunth | Tree |
| Ageratina glabrata (Kunth) R.M. King and H. Rob. | Bush |
| Ageratina mairetiana (DC.) R.M. King and H. Rob. | Bush |
| Ageratum corymbosum Zuccagni. | Grass |
| Arctostaphylos pungens Kunth. | Bush |
| Arenaria bourgaei Hemsl. | Perennial grass |
| Bidens pilosa L. | Annual grass |
| Geranium seemannii Peyr. | Perennial grass |
| Salix paradoxa Kunth. | Tree |
| Sigesbeckia jorullensis Kunth. | Perennial grass |
| Introduced species | |
| Achillea millefolium L. | Perennial grass |
| Chenopodium murale L. | Annual grass |
| Sambucus nigra L. | Tree |
| Mixed forest-Quercus (2620-3370 masl) | |
| Native species | |
| Adiantum braunii Mett. ex Kuhn. | Perennial grass |
| Alchemilla procumbens Rose. | Perennial grass |
| Alnus acuminata Kunth subsp. glabrata (Fernald) Furlow. | Tree |
| Arachniodes denticulata (Sw.) Ching. | Perennial grass |
| Arbutus xalapensis Kunth | Tree |
| Argemone ochroleuca Sweet. | Annual grass |
| Arracacia aegopodioides (Kunth) J.M. Coult. and Rose. | Annual grass |
| Asplenium formosum Willd. | Grass |
| Baccharis conferta Kunth. | Bush |
| Baccharis salicifolia (Ruíz Pav.) Pers. | Bush |
| Baccharis sordescens DC. | Bush |
| Begonia gracilis Kunth. | Grass |
| Bidens aurea (Ait.) Sherff. | Perennial grass |
| Brachypodium mexicanum (Roem. and Schult.) Link. | Perennial grass |
| Bromus dolichocarpus Wagnon. | Perennial grass |
| Bromus carinatus Hook. and Arn. | Perennial grass |
| Erigeron longipes DC. | Perennial grass |
| Montanoa tomentosa Cerv. | Bush |
| Oxalis corniculata L. | Perennial grass |
| Oxalis latifolia Kunth. | Grass |
| Phacelia platycarpa (Cav.) Spreng. | Perennial grass |
| Pseudognaphalium semiamplexicaule (DC.) Anderb. | Perennial grass |
| Quercus spp | Tree |
| Salvia gesneriflora Lindl. and Paxton. | Bush |
| Sicyos microphyllus Kunth. | Annual grass |
| Solanum americanum Mill. | Annual grass |
| Solanum corymbosum Jacq. | Perennial grass |
| Tridax trilobata (Cav.) Hemsl. | Annual grass |
| Tripogon spicatus (Nees) Ekman. | Perennial grass |
| Urtica dioica L. | Perennial grass |
| Verbena gracilis Desf. | Perennial grass |
| Introduced species | |
| Adiantum andicola Liebm. | Perennial grass |
| Conyza bonariensis (L.) Cronquist. | Annual grass |
| Eleusine indica (L.) Gaertn. | Annual grass |
| Erodium cicutarium (L.) L’Hér. ex Aiton. | Annual grass |
| Eruca sativa Mill. | Annual grass |
| Melinis repens (Willd.) Zizka. | Perennial grass |
| Mentha sp. L. | Perennial grass |
| Prunella vulgaris L. | Perennial grass |
| Rumex acetosella L. | Perennial grass |
| Rumex obtusifolius L. | Perennial grass |
The Basin of Mexico Hydromorphological Quality Assessment Index (HYQI)
The index was divided into three sections, and each section added 40 points, so the index accumulated 120 points (Table I; also see Table SI in the supplementary material). The three evaluation sections are as follows: (i) basin quality, which evaluates the state of the riparian zone, including the quality of the vegetation, its level of erosion, and land use; (ii) hydrology, which evaluates the natural conditions of the river and the alterations that exist in the natural flow of water in the channel, and (iii) anthropogenic alterations, which evaluates the human activities that take place in the riparian zone and reduce the ecological quality. The basin quality section evaluates the native plant cover in percentage, for which a guide to plant species was developed as an appendix to the HYQI. Forests of Abies religiosa, Pinus hartwegii and Quercus spp. grow in the upper areas of the watershed, with mixed forests in the middle and lower areas. Each vegetation type has a subdivision of native and introduced species and their way of life.
The HYQI evaluation showed 44 sites with an optimal rating (120 to 100 points) where potential reference conditions for the Mexico Basin can be recognized. The remaining 19 sites were rated as having medium to poor quality conditions. The hydromorphological quality generally decreases with altitude, urbanization, and silvopastoral activity. The vegetation cover was represented by 70 % of native species (or more) in the reference sites. The riparian vegetation was modified in general by the invasion of irregular human settlements that alter and destroy the river’s bank through the following activities: (i) opening of trails for tourism or cattle, (ii) construction of bridges, (iii) channeling of the river through canals or tubes that carry water for on-site activities, (iv) reforestation with exotic plants, and (v) accumulation of organic and inorganic waste.
The evaluated sites were grouped into two sets by hierarchical agglomerative clustering, the first one including those that registered the potential reference conditions (Figs. 2 and 3), and the second one encompassing those where channeling of the river, presence of crops, lack of vegetation cover in the riparian zone, and a high percentage of introduced species were recorded. In addition, an increase in the concentration of phosphorus and nitrogen dissolved in the water was recorded, making it unfit for human consumption (SSA 1996). Concerning the evaluation of springs, specific characteristics of human disturbance related to the creation of dams, installation of water extraction pipes, deforestation, and the presence of fecal organic matter from sheep and cows were detected.
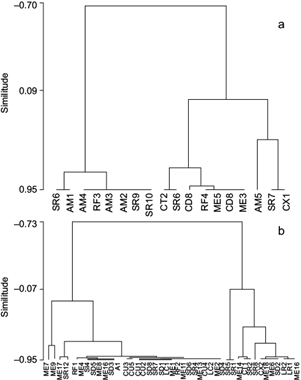
Fig. 2 Hierarchical agglomerative cluster recognizing two clusters of sites: (a) over 2800 masl, and (b) under 2800, based on the hydromorphological quality index, dissolved inorganic nitrogen, and soluble reactive phosphorus data. (AM1: La Castañeda, AM2: La Castañeda II, AM3: La Castañeda III, AM4: La Castañeda IV, AM5: La Castañeda V, CT1: Rancho Nuevo I, CT2: Rancho Nuevo II, CX1: Miraflores, CX2: Santa Catarina, CU1: Los Organillos, CU2: Capoxi spring, CU3: San Pedro spring, CU4: Presa Iturbide spring, CU5: Capoxi, LC1: La Caldera, LC2: Xopachi, LR1: Monte Alegre 1, LR2: Monte Alegre 2, ME1: Chautitle, ME2: Chautitle waterfall, ME3: Confluencia, ME4: Eslava spring, ME5: Santa Teresa, ME6: Truchero, SI1: Las Palomas, SI2: Truchero 2, SR1: Agua Dulce, SR2: San Rafael channel, SR3: Compañía 1, SR4: Compañía 2, SR5: Cosamala 1, SR6: Cosamala 2, SR7: UAM station, SR7: San Rafael channel 1, SR8: San Rafael, SR9: San Rafael channel 2, SR10: San Rafael path, SD1: Arroyo Desierto, SD2: Convento, SD3: La Capilla Santa Rosa, SD4: Santa Rosa 1, SD5: Santa Rosa spring, SD6: Santa Rosa 2, SD7: Truchero, SD8: Valle de Monjas, A1: Apatlaco, RF1: El Llano 1, RF2: El Llano 2, RF3: La Cabañita, RF4: La Planta, ME7: Cañada de Cuervos spring, ME8: Cañada de Cuervos, ME9: Cieneguillas dam, ME10: Cieneguillas 1, ME11: Cieneguillas 2, ME12: Temascalco, ME13: La Rosita Alto, ME14: La Rosita spring, ME15: Ermita spring, ME16: San José spring, ME17: La Bodega spring, ME18: Potrero spring.)
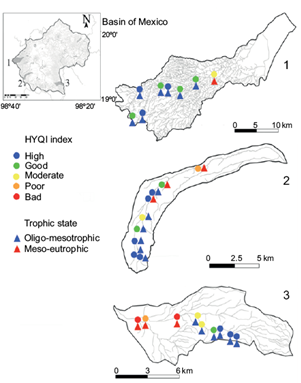
HYQI validation
In general, the hydromorphological quality was consistent with the trophic status (Table V). Headwaters presented good and high qualifications, while an evident decrease in the value of hydromorphological quality was related to the lowland sites. The HYQI value was found to be significantly correlated with nutrient enrichments with DIN and SRP. Modifications in the canal structure and the extraction and retention of water in the rivers were the causes that confirmed the moderate HQ value in the middle and lower portions of the three sub-basins.
TABLE V PHYSICAL, CHEMICAL, AND HYDROMORPHOLOGICAL CHARACTERISTICS, AS WELL AS HYQI VALUES OF VALIDATION SAMPLING SITES IN THE BASIN OF MEXICO.
| Sub-basins and sites | Altitude (masl) | K25 (µS/cm) | DO (%) | SRP (mg/L) | DIN (mg/L) | HYQI |
| 1. San Rafael-Tlalmanalco | ||||||
| Diamantes waterfall | 3266 | 174 | 8.1 | 0.45 | 0.05 | 120 |
| Negro waterfall | 3094 | 161 | 8.4 | 0.31 | 0.04 | 120 |
| Vereda | 2956 | 151 | 8.1 | 0.31 | 0.04 | 102 |
| Canal | 2915 | 142 | 7.9 | 0.38 | 0.04 | 95 |
| Agua Dulce | 2788 | 151 | 8.2 | 0.33 | 0.09 | 63 |
| Dos Aguas | 2676 | 123 | 7.7 | 0.34 | 0.12 | 55 |
| San Rafael | 2525 | 261 | 5.8 | 2.58 | 21.52 | 18 |
| UAM | 2429 | 415 | 3.0 | 3.24 | 15.4 | 37 |
| Tlalmanalco | 2400 | 677 | 2.7 | 2.52 | 52.06 | 24 |
| 2. Cuautitlán | ||||||
| Spring* | 3379 | 39 | 7.6 | 0.15 | 0.13 | 111* |
| Iturbide spring* | 3317 | 60 | 7.7 | 0.14 | 0.23 | 72 |
| Iturbide | 3205 | 59 | 8.4 | 0.13 | 0.16 | 104 |
| El Paraíso | 2703 | 51 | 8.0 | 0.36 | 0.21 | 120 |
| El Polvorín | 2612 | 70 | 7.2 | 0.21 | 0.21 | 76 |
| Cantera | 2578 | 72 | 7.5 | 0.15 | 0.38 | 65 |
| Transfiguración | 2515 | 70 | 7.6 | 0.29 | 0.23 | 92 |
| Yondese | 2396 | 113 | 7.6 | 0.42 | 0.32 | 85 |
| Nicolás Romero | 2333 | 175 | 6.8 | 1.75 | 1.94 | 53 |
| 3. Santo Desierto | ||||||
| San Miguel | 3310 | 57 | 7.7 | 0.26 | 0.06 | 117 |
| Conejos | 3314 | 72 | 7.4 | 0.13 | 0.11 | 111 |
| Confluencia Alta | 3123 | 75 | 7.5 | 0.17 | 0.15 | 108 |
| Camino | 2840 | 82 | 8.2 | 0.14 | 0.42 | 93 |
| Convento | 2907 | 115 | 5.7 | 0.36 | 0.29 | 66 |
| Escuela | 2702 | 110 | 7.79 | 0.14 | 0.24 | 102 |
| Truchero | 2734 | 130 | 7.8 | 0.08 | 0.24 | 91 |
| Cancha | 2719 | 369 | 5.7 | 2.48 | 2.12 | 46 |
| Guadalupe Victoria | 2491 | 347 | 1.6 | 2.49 | 30.04 | 37 |
K25: specific conductivity; DO: dissolved oxygen; SRP: soluble reactive phosphorus; DIN: dissolved inorganic nitrogen.
DISCUSSION
Within the Basin of Mexico, factors such as topography, high altitude, slope orientation, slope, and soil units are conducive to the development of a wide range of environments and a diverse plant community. The physicochemical, hydromorphological, and biological data analyzed in this study showed that, in general, the upper basin areas of the rivers maintain a good ecological quality status, partly due to the declarations of protection under the denomination of Conservation Soil or Protected Natural Area, which prevents the massive establishment of human activities within each sub-basin and the excessive extraction of water for urban areas. However, the existence of springs and rivers exposed to different transformations, mainly due to water extraction, agricultural activities, and urbanization, was recorded. It is important to identify the volumes of water that circulate in each sub-basin, and maybe a policy of maximum volume extraction by hoses can be established, especially in springs and first-order rivers in the upper portions of the basin, where the discharge is minimal. The 391.3-km total length of the studied rivers suggests an important contribution of water for environmental conservation and its potential human use in the basin. Of these, 71% are channeled for their historical or current use. However, the lack of supervision and resource management strategies prevents reliable data on the quantity and quality of available water. Among the most frequent disturbances are gabion dams and hydraulic diversions through hoses of different materials and thicknesses. These disturbances are widely scattered throughout the basin and there are no studies on their real impact on biological communities and the consequences on the functioning of aquatic ecosystems. These alterations are frequent and are not limited to a particular section of the basin; they can be found in the upper basin which, in theory, should be the best preserved and exempt from this infrastructure. The flow rate and precipitation in the Magdalena River sub-basin have shown a slight increase in the flow trend and a decrease in precipitation amount in the last 20 years (Caro-Borrero et al. 2017). This may result from a higher runoff caused by the presence of non-porous material, a sign of urban expansion in the conservation soil. Therefore, sub-superficial and deep-water infiltration may be compromised, affecting the perennial character of the system (Caro-Borrero et al. 2017).
The deterioration in the middle section of the Basin of Mexico responds to activities with a greater impact in terms of pollution since there are urban or garbage discharges directly related to the contributions of nutrients, detergents, insecticides, and waste from agricultural activity. According to the Official Mexican Standard NOM-127-SSA1-1994 (SSA 1996), the nutrient concentrations in the rivers and springs were within the maximum permissible limits for dissolved inorganic nitrogen and soluble reactive phosphorus in terms of water for human consumption. However, according to Dodds (2003), the sections of the rivers within the middle basin are oligo-mesotrophic, and in the lower basin area, they are meso-eutrophic. This shows a lack of standardization in the concentration levels allowed according to international parameters.
The characterization of the hydromorphological quality had some drawbacks that are frequent in Mexico and, in general, in Latin America. Government mapping information is incomplete, and/or no updates are available. In the in-situ validation of land use, there was no consistency with the presence of agricultural, livestock, trout farms, human settlements, and commercial areas present in the riparian zone. This reflects the rapid and uncontrolled advance of economic activities within forest areas and the most worrying within areas with some conservation status. Regarding the type of vegetation, it was represented in a general way by the main types of forest that make up the basin: Pinus, Abies, and mixed, with the dominance of Quercus spp. (Espinosa and Sarukhán 1997; Rzedowski and Calderón 2005, Ávila-Akerberg 2010). However, hydromorphological evaluation indices require spatial and temporal recognition of the richness and diversity of the vegetation associated with the riverbank (Munné et al. 2003, Barbour et al. 1999, Encalada et al. 2011). This vegetation is not represented in the cartography due to the low-resolution spatial scale available (1:50 000), and this lack of specificity could lead to a lack of knowledge of the endangered plant diversity, which has potentially been lost given the reported activities.
The hydrological condition of permanence of the rivers is undervalued in the hydrological chart of the INEGI (2013) since only five of the 13 sub-basins studied are registered as perennial. The representation of infrastructure such as embankments, gabion dams, piping, and channeling of rivers is not indicated and much less updated. Some of these channels are even evident in the urban area of Mexico City, where water currents are indicated in the hydrological chart with natural flow or without artificial modifications. This point is important because many current public policies with a socio-environmental focus, such as the temporary employment program, finance the construction of infrastructure, such as small dams within the riverbeds, without taking into account the works of previous interventions. In this sense, the information available from INEGI (2013) does not record or update the changes that the naturalness of rivers and land use in the Basin of Mexico. The advance of the urban sprawl within the conservation soil of Mexico City in recent years is a main factor in the decline of the water capacity to recharge the aquifers, and it increases the risk of converting the basin into a potential input of contaminants to the aquifer (Cram et al. 2008).
On the other hand, architectural remnants were found that date back to the 19th century and recall the operation of an active and prosperous textile and wood industry within the basin. Especially, diversion channels and electricity-generating turbines (dynamos) were found in the sub-basin of the San Rafael-Tlalmanalco, Magdalena-Eslava, and San Rafael-Río Frío rivers (Caro-Borrero et al. 2015). This may indicate that despite a historical hydraulic intervention, the structural and functional components of the aquatic ecosystem can be partially recovered (Carmona-Jiménez and Caro-Borrero 2016).
All the points previously exposed denote the government’s outdatedness with respect to environmental data. It implies that an additional effort for the selection of potential sampling sites has to be made, since every time that monitoring is needed, it is necessary to go to the field without the certainty that the sites have conditions of little anthropogenic disturbance (Bordallo and Casado 2011). The land use and hydrological charts work as a general reference but are not punctual for the location of potentially natural areas. Based on the results of the in-situ validation, we propose that potential reference sites should be selected in accordance with the altitudinal gradient, the zoning of protected areas, and the evaluation of the reference hydromorphological conditions, and not only based on the government cartographic information.
Rivers and springs are influenced by different biotic and abiotic factors, as observed in the Basin of Mexico, where all surface waters are subject to human activity at the local or regional level, causing pressure on the entire ecosystem. For example, if the rivers/springs can have a good physical-chemical quality and a degraded physical structure, the result will be a habitat that is not suitable for benthic community development (Río and Bailey 2006, Ollero et al. 2007, Garófano-Gómez et al. 2011, Villamarín et al. 2014).
The foregoing shows that government urban planning has not considered the maintenance of natural areas and ecological flow as a source of ecosystem services for the Basin of Mexico. These services include the provision of water, carbon capture and storage, climate regulation, buffering against floods and droughts, and the possibility of developing productive activities such as agriculture, livestock, recreation, and tourism. In the last 50 years, with the accelerated urbanization of Mexico City, a great extension of the forested area has been lost in order to solve the social pressures of housing and mobility. Although the Basin of Mexico has areas with steep slopes > 20º, which are considered natural barriers, they are no longer an obstacle to human settlement. The Sierra de Guadalupe to the north of the basin; the Sierra de Santa Catarina, Ajusco, and Chichinautzin to the south; Lake Texcoco, to the east, and the mountainous area of the Sierra de Las Cruces and Monte Alto, are examples of this phenomenon of urbanization, (Gutiérrez and González 2010). Many of these areas have irregular settlements that greatly reduce the possibility for soils to allow aquifers to regenerate and maintain their own riparian vegetation (Cram et al. 2008).
CONCLUSIONS
According to the hydromorphological quality protocol proposed for the Basin of Mexico, conditions of high and good quality were recognized, related to the protected natural area of the headwaters of the basin where the rivers originate. However, these conditions are not always present due to human interventions related to the extraction of water from springs and rivers, destruction of riparian vegetation, and alteration of the riverbed. Hydromorphological quality should be associated with water quality in the official Mexican protocols that protect the health of the riparian ecosystem, as in other legislations in the world. The evaluation and validation should be based on an updated census of the springs and rivers of the Basin of Mexico.

