


 nueva página del texto (beta)
 Inglés (pdf)
 Artículo en XML
 Referencias del artículo
 Enviar artículo por email
 Citado por SciELO
  Similares en
SciELO
Similares en
SciELO 
 Permalink
INTRODUCTION
Talking about dengue is mentioning a permanently latent condition in our latitudes given the existing geographical conditions, temperature, and humidity conducive to the presence of the Aedes aegypti mosquito and its breeding sites, the vector of the disease. In the case of Cali, recent data collected in this research shows how, in a little more than five years, most cases of dengue fever are out of the endemic channel showing epidemic outbreaks, which raises questions not only about the strategies implemented institutionally for risk management but also about how actions could be deployed more effectively in this regard. This work, assuming risk as a social product, recognizes sociospatial variables that influence the spatiotemporal behavior of dengue in the city of Cali and that, based on their mathematical modeling, make it possible to provide governmental entities with effective measures that allow the number of dengue cases in the city to be maintained at acceptable levels so that health entities can respond and the population of Cali does not live in imminent risk of death from this virus.
The starting point is that the risk of an epidemic depends not only on the existence of the threat, the infected mosquito, but also on the conditions of the vulnerability of the society, given in this case, by the degree and sense of mobility between the various sectors that make up the city, which significantly increases its exposure. In the end, we want to avoid disaster, which would be the overshoot of the Acceptable Risk Level (Thomas J., 2018) that would define individual, social, economic, and productive damages beyond the tolerance limit defined by the endemic channel. Damages that, beyond the obvious deaths that are intended to be avoided, allude on the one hand to time and resources lost due to the inactivity of the sick, and on the other hand, the costs associated - time and resources, too - to care by the health service, the family environment and society itself.
In fact, nowadays it is possible to recognize that any type of border between regions is not an impediment for infectious diseases to be transmitted from one place to another; therefore, mobile population groups serve as biological bridges between geographically distant regions and allow diseases that were not endemic in certain regions to gain importance in those areas that provide all the natural conditions for the proliferation of the disease (Guerrero Espejo A. &., 2004). Thus, when trying to control an infectious disease that crosses all types of borders, strategies should focus on mobility as a determinant of public health, and not only on containing specific diseases. This leads to an international cooperation effort in epidemiological surveillance and declaration of the existence of diseases (Hernández Pastor, 2013). Precisely, the SARS-COV-2 virus has shown that a disease, COVID-19, initially reported in one city, Wuhan - China, can spread to all parts of the world. This disease, which had a late reaction in public health actions at the global level, recognized since February 12, 2020, made the WHO declare a pandemic, which was a consequence of weak reports and policies in each of the countries aimed at reducing the risk of contagion (Zu, 2020).
Dengue is a viral infection that exemplifies both the problems due to urban expansion and climate change. This disease has increased considerably in recent years due to high rural-urban migration, which is usually accompanied by uncontrolled growth of cities and, consequently, by a lack of basic sanitary infrastructure in the areas where new settlers move in, in addition to poor management of domestic water in certain populations. The increase in solid waste, such as tires and plastic containers where water accumulates and larvae grow, is one of the main danger factors. This, added to global warming caused by climate change, causes the mosquito vector, Aedes, to have more breeding sites and expand its endemic area, leading to an increase in dengue cases and the spread of the disease to places where it did not exist before (Hernández Pastor, 2013).
If Social Risk Management -SRM- is understood (Thomas J., 2011) as the institutional and social process through which policies, actors, strategies, instruments, and actions are articulated to eliminate or mitigate the elements and levels of exposure of communities to potential destructive events while increasing their resistance, response capacity, adjustment, and recovery in the face of the potential adverse effects of such events. Therefore, given the nature of this threat, it is easier for the public sector to act on the factors that affect exposure rather than on fragility, since the latter is a function of genetic and sociodemographic factors over which it is more difficult and complex to have control, in fact, it is impossible to control some of them.
But, in addition, GSR also implies the “recognition and social awareness that certain economic, political, institutional, social, and cultural practices configure unbalanced, exclusive, and inequitable scenarios that expose the population to potentially destructive events in a differential manner and violate, limit, or reduce, in the case of the most fragile, their ability to cope with them...” (Thomas J., 2011). This leads us to review the role of social and institutional activities in the construction of daily mobility in the city, a factor that triggers the spatial spread of the epidemic, given the domestic behavior of the mosquito (Interviews, 2013); that is, certain knowledge and control over mobility factors would allow greater control over the spatiotemporal behavior of the epidemic.
Table 1 Annual dengue cases by district in Cali.
| Year
Comunnes |
2000 | 2001 | 2002 | 2003 | 2004 | 2005 | 2006 | 2007 | 2008 | 2009 | 2011 | 2013 | 2014 | 2015 | TOTAL |
| 1 | 3 | 85 | 206 | 89 | 62 | 33 | 31 | 38 | 25 | 98 | 23 | 331 | 135 | 140 | 1299 |
| 2 | 10 | 197 | 478 | 233 | 95 | 108 | 54 | 51 | 60 | 354 | 106 | 594 | 267 | 454 | 3061 |
| 3 | 12 | 203 | 535 | 221 | 100 | 113 | 28 | 33 | 15 | 142 | 34 | 418 | 177 | 273 | 2304 |
| 4 | 6 | 137 | 438 | 179 | 65 | 80 | 38 | 31 | 31 | 224 | 30 | 446 | 189 | 315 | 2209 |
| 5 | 5 | 136 | 381 | 151 | 57 | 126 | 31 | 38 | 39 | 353 | 74 | 576 | 309 | 334 | 2610 |
| 6 | 1 | 114 | 335 | 152 | 60 | 168 | 73 | 69 | 38 | 446 | 77 | 772 | 410 | 758 | 3473 |
| 7 | 9 | 118 | 311 | 127 | 51 | 88 | 38 | 41 | 37 | 243 | 58 | 468 | 268 | 659 | 2516 |
| 8 | 5 | 116 | 322 | 99 | 37 | 207 | 66 | 84 | 75 | 401 | 62 | 789 | 250 | 624 | 3137 |
| 9 | 5 | 94 | 294 | 75 | 27 | 136 | 26 | 56 | 30 | 196 | 41 | 487 | 148 | 240 | 1855 |
| 10 | 3 | 76 | 212 | 68 | 23 | 187 | 68 | 121 | 53 | 334 | 62 | 709 | 242 | 516 | 2674 |
| 11 | 4 | 63 | 169 | 59 | 32 | 97 | 54 | 108 | 43 | 308 | 75 | 612 | 327 | 750 | 2701 |
| 12 | 2 | 33 | 131 | 47 | 15 | 104 | 42 | 67 | 48 | 215 | 49 | 405 | 186 | 755 | 2099 |
| 13 | 1 | 29 | 102 | 33 | 10 | 108 | 44 | 112 | 85 | 357 | 131 | 779 | 529 | 2740 | 5060 |
| 14 | 1 | 29 | 66 | 22 | 12 | 81 | 18 | 53 | 78 | 229 | 45 | 586 | 238 | 859 | 2317 |
| 15 | 1 | 17 | 48 | 20 | 6 | 140 | 73 | 56 | 71 | 324 | 59 | 737 | 435 | 1268 | 3255 |
| 16 | 0 | 11 | 15 | 8 | 8 | 90 | 64 | 48 | 34 | 258 | 53 | 636 | 323 | 897 | 2445 |
| 17 | 1 | 7 | 18 | 7 | 3 | 156 | 60 | 77 | 62 | 410 | 83 | 656 | 325 | 637 | 2502 |
| 18 | 0 | 2 | 8 | 4 | 0 | 77 | 34 | 128 | 59 | 396 | 76 | 742 | 309 | 681 | 2516 |
| 19 | 0 | 2 | 3 | 0 | 0 | 136 | 68 | 95 | 55 | 285 | 99 | 613 | 241 | 375 | 1972 |
| 20 | 0 | 0 | 1 | 0 | 0 | 62 | 29 | 90 | 41 | 114 | 33 | 439 | 136 | 194 | 1139 |
| 21 | 3 | 130 | 272 | 90 | 52 | 95 | 16 | 80 | 59 | 205 | 47 | 629 | 259 | 920 | 2857 |
| 22 | No
data |
No
data |
No
data |
No
data |
No
data |
22 | 8 | 9 | 6 | 76 | 13 | 34 | 34 | 42 | 244 |
Source: PVEDSSC, Cali.
Thus, based on the above, this work aims to establish strategies to improve the current management of dengue epidemics in the city of Cali - Colombia from mathematical modeling and optimal control theory considering the mobility of people between areas with different types of threats.
MATERIALS AND METHODS
First, the dynamics of dengue will be shown under the view of Risk Theory, whose definitions and applications are necessary for the interpretation of the subsequent results; then, the chosen mathematical model and its use in the formulation of the optimal control problem will be presented in this work.
Source of Information
In the municipality of Cali, the city government issues epidemiological bulletins that monitor the behavior of dengue. Based on these bulletins, the endemic channel is calculated, which represents a graphical representation of the current incidence over historical incidence. It allows for the early detection of abnormally high or low numbers of disease cases (Coutin Marie, 2010). This tool enables us to understand the endemic or epidemic behavior and thereby recognize when the number of actual or expected cases (according to the analysis conducted) exceeds or would exceed normal conditions, potentially surpassing the installed response capacity, and resulting in high social and economic costs, understood as damages and losses (acceptable risk level). Moreover, it helps to identify the need to design mitigation strategies to reduce the cases and/or their impacts.
Therefore, if the infection rate per district is not considered, the threat analysis for each area could be misleading, as absolute figures might distort the real situation-in this case, the risk of infection. To provide a more accurate perspective, we calculated the proportion of infected individuals in each district based on its population, and then determined the percentage represents relative to the total number of infections recorded in that same district over the year (see Table 2 and Fig. 1).
Table 2 Annual infection rate and its percentage relative to total yearly infections by district in Cali.
| Comunnes
Year |
1 | 2 | 3 | 4 | 5 | 6 | 7 | 8 | 9 | 10 | 11 | 12 | 13 | 14 | 15 | 16 |
| 2000 | 0,005 | 0,010 | 0,028 | 0,010 | 0,006 | 0,001 | 0,010 | 0,005 | 0,009 | 0,003 | 0,004 | 0,003 | 0,001 | 0,001 | 0,001 | 0,000 |
| 2001 | 0,139 | 0,190 | 0,470 | 0,219 | 0,146 | 0,063 | 0,137 | 0,118 | 0,169 | 0,067 | 0,061 | 0,044 | 0,016 | 0,018 | 0,013 | 0,011 |
| 2002 | 0,324 | 0,445 | 1,230 | 0,703 | 0,397 | 0,182 | 0,360 | 0,328 | 0,529 | 0,186 | 0,161 | 0,174 | 0,055 | 0,041 | 0,036 | 0,014 |
| 2003 | 0,135 | 0,211 | 0,505 | 0,288 | 0,153 | 0,080 | 0,147 | 0,101 | 0,135 | 0,059 | 0,056 | 0,062 | 0,018 | 0,013 | 0,014 | 0,008 |
| 2004 | 0,091 | 0,084 | 0,227 | 0,104 | 0,056 | 0,031 | 0,059 | 0,038 | 0,049 | 0,020 | 0,030 | 0,020 | 0,005 | 0,007 | 0,004 | 0,008 |
| 2005 | 0,052 | 0,108 | 0,250 | 0,140 | 0,124 | 0,098 | 0,116 | 0,207 | 0,275 | 0,177 | 0,096 | 0,153 | 0,062 | 0,052 | 0,110 | 0,093 |
| 2006 | 0,048 | 0,054 | 0,062 | 0,067 | 0,030 | 0,042 | 0,050 | 0,066 | 0,054 | 0,064 | 0,053 | 0,061 | 0,025 | 0,011 | 0,056 | 0,066 |
| 2007 | 0,057 | 0,050 | 0,073 | 0,055 | 0,036 | 0,039 | 0,054 | 0,083 | 0,117 | 0,113 | 0,105 | 0,098 | 0,064 | 0,033 | 0,042 | 0,049 |
| 2008 | 0,036 | 0,059 | 0,033 | 0,056 | 0,037 | 0,021 | 0,049 | 0,074 | 0,063 | 0,049 | 0,042 | 0,070 | 0,049 | 0,049 | 0,052 | 0,034 |
| 2009 | 0,136 | 0,341 | 0,310 | 0,405 | 0,332 | 0,249 | 0,326 | 0,396 | 0,415 | 0,309 | 0,297 | 0,316 | 0,204 | 0,142 | 0,231 | 0,256 |
| 2011 | 0,030 | 0,099 | 0,074 | 0,055 | 0,068 | 0,042 | 0,079 | 0,061 | 0,088 | 0,057 | 0,071 | 0,073 | 0,074 | 0,027 | 0,040 | 0,051 |
| 2013 | 0,400 | 0,536 | 0,905 | 0,826 | 0,523 | 0,414 | 0,647 | 0,774 | 1,065 | 0,645 | 0,577 | 0,602 | 0,441 | 0,347 | 0,481 | 0,605 |
| 2014 | 0,158 | 0,237 | 0,382 | 0,352 | 0,278 | 0,218 | 0,373 | 0,245 | 0,326 | 0,219 | 0,306 | 0,277 | 0,298 | 0,139 | 0,278 | 0,304 |
| 2015 | 0,158 | 0,396 | 0,588 | 0,590 | 0,298 | 0,399 | 0,924 | 0,609 | 0,533 | 0,465 | 0,699 | 1,129 | 1,542 | 0,497 | 0,796 | 0,837 |
| Comunnes
Year |
17 | 18 | 19 | 20 | 21 | 22 | ||||||||||
| 2000 | 0,001 | 0,000 | 0,000 | 0,000 | 0,004 | 0,000 | ||||||||||
| 2001 | 0,006 | 0,002 | 0,002 | 0,000 | 0,168 | 0,000 | ||||||||||
| 2002 | 0,014 | 0,008 | 0,003 | 0,002 | 0,316 | 0,000 | ||||||||||
| 2003 | 0,005 | 0,004 | 0,000 | 0,000 | 0,095 | 0,000 | ||||||||||
| 2004 | 0,002 | 0,000 | 0,000 | 0,000 | 0,050 | 0,000 | ||||||||||
| 2005 | 0,146 | 0,079 | 0,133 | 0,094 | 0,108 | 0,266 | ||||||||||
| 2006 | 0,054 | 0,034 | 0,065 | 0,044 | 0,018 | 0,093 | ||||||||||
| 2007 | 0,067 | 0,124 | 0,090 | 0,135 | 0,085 | 0,102 | ||||||||||
| 2008 | 0,053 | 0,055 | 0,052 | 0,061 | 0,061 | 0,066 | ||||||||||
| 2009 | 0,340 | 0,360 | 0,266 | 0,170 | 0,207 | 0,806 | ||||||||||
| 2011 | 0,065 | 0,065 | 0,091 | 0,049 | 0,045 | 0,130 | ||||||||||
| 2013 | 0,492 | 0,598 | 0,552 | 0,640 | 0,581 | 0,321 | ||||||||||
| 2014 | 0,238 | 0,242 | 0,215 | 0,197 | 0,235 | 0,313 | ||||||||||
| 2015 | 0,456 | 0,518 | 0,332 | 0,280 | 0,819 | 0,376 | ||||||||||
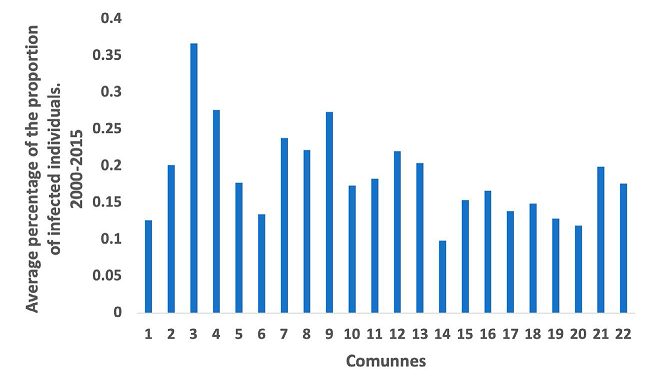
Upon casually reviewing this table, it is apparent that District 13 has the highest number of total cases with 5,060 cases, while District 3 has one of the lowest with a total of 2,304 cases. This would suggest, initially, that District 13 has a high dengue infection threat, while District 3 has a low threat. However, when the data is converted to proportions by dividing the total number of infected individuals in each district by its total population, it becomes evident that District 3 has a higher percentage of dengue infections, which is not apparent from the absolute numbers.
Therefore, if the proportion of infections per district is not taken into account, the analysis of the threat for each district would be misleading, as there would be a distortion in the data suggesting a particular situation, in this case, the infection. Thus, by using the population projection of Cali in Figures for the year 2006, it is possible to calculate the percentage of the proportion of people infected with dengue per district and per year (See Table 2 and Fig. 1).
This process allows us to identify three dengue threat zones in Cali: high, medium, and low. These zones are effectively established by considering the calculated proportions and grouping together the districts that exhibit similar data patterns. To achieve this, the correlation matrix tool of the SPSS software is utilized. It takes each district and compares its values with all the others, aiming to demonstrate a statistical relationship among the data (See Annex). Therefore, the program would indicate which districts have similar patterns in terms of the proportion of infected individuals.
Risk Theory
Given that the spatial behavior of dengue involves certain environmental, social, and cultural factors that operate differently according to their functional dynamics, and that conducive behaviors to contagion are generated as a result, it is possible to identify threats and vulnerabilities in that context. Therefore, the Risk Theory approach provides an appropriate interpretative framework. Furthermore, from the perspective of Risk Management, it is possible to propose controls that are in line with the social conditions of the population to reduce the likelihood of an epidemic.
Dengue is considered a biological threat, therefore, places where all the conditions for its presence are met will be threatened by the spread of this virus, that is, at risk of epidemics of this disease. Precisely because it is infectious, its spread depends on the mobility of its infectious agents, making this aspect strategic when controls to mitigate this threat are propored.
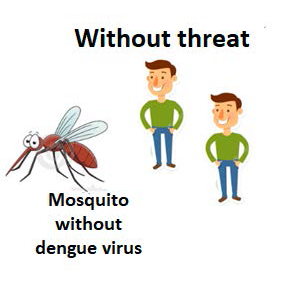
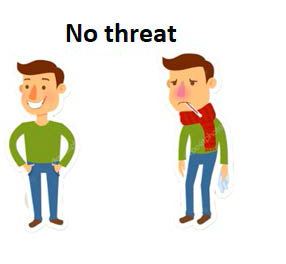
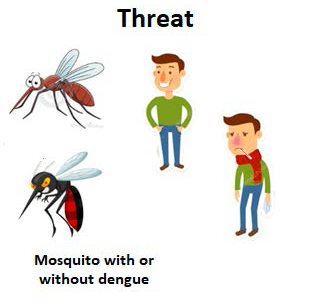
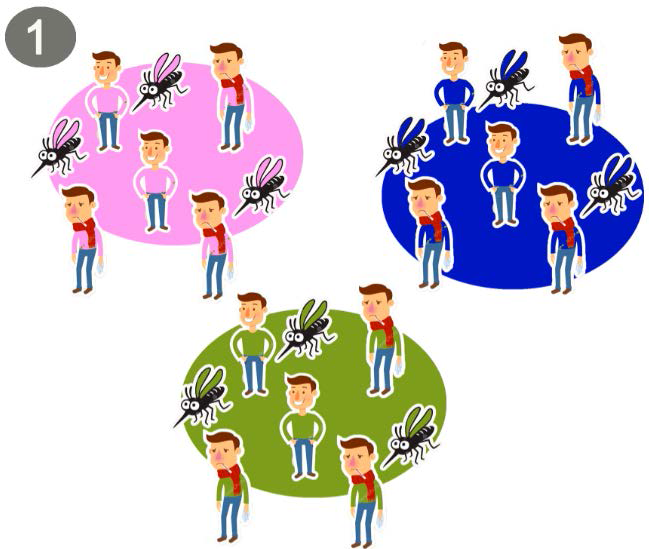
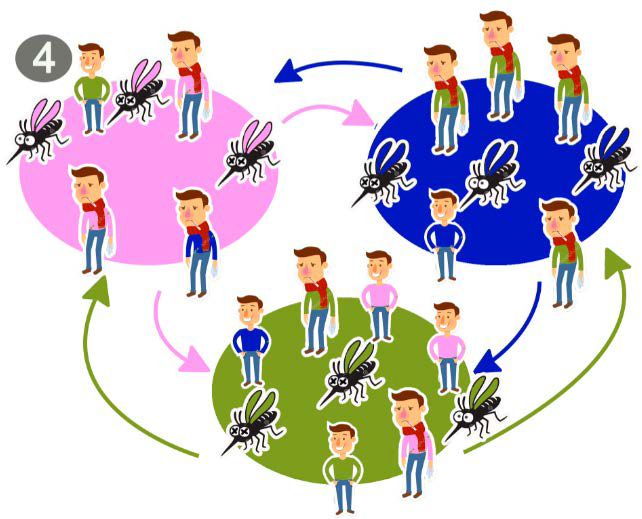
This threat is tied to the infected mosquito and not its habitat, as not necessarily all habitats favorable for the mosquito (vector) will have infected mosquitoes (Figs. 2 and 3). The convergence of two events or situations is required: first, the habitat that defines favorable conditions for the presence of the mosquito, and second, an infected mosquito carrying the virus. Therefore, a population is considered to be under the threat of dengue if it has the vector that transmits the disease and the virus is circulating, whether the carrier is a human or the carrier is the vector (Fig. 4).
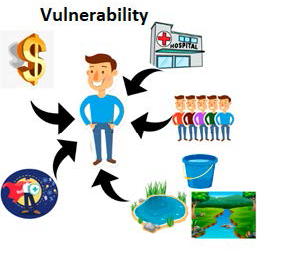
Likewise, vulnerability is linked to two factors traditionally recognized in the literature and validated in the case of dengue: exposure and fragility (Blaikie, 1996) (Maskrey, 1993). The former is understood as the conjunction in time and space of the threat (infected mosquito) and a person who may become infected. The latter refers to the specific condition of susceptibility after being inoculated by the vector to develop the disease. In the case of the population, as mentioned by (Niño, 2018), it is generalized here. As seen in Figure 5 (Heydari, 2017) (Ferdousi, 2015), a population will be fragile regarding a dengue epidemic if its members, in their various combinations, do not have good access to health services to control positive cases of dengue, if they have poor water management that aids the vector in increasing its reproduction rate, if the distribution of the infected population allows the vector a higher probability of becoming infected by biting a human, if the immune system of the population members is deficient, and if their economic activities induce constant population mobility that influences the transmission of the virus to different areas. However, the distribution and concentration of the population are recognized as a preponderant factor of exposure, therefore, in this case, it is an important factor of both vulnerability and threat.
Therefore, by combining the threat and fragility of a population exposed to the dengue virus, under specific conditions of exposure, population dynamics, and geographical conditions, it will be at risk of infection and likely to suffer a dengue epidemic. This, when materialized, would be a disaster given the high social and labor costs that its consequences would entail, surpassing the Acceptable Risk Level defined by the endemic channel.
Mathematical Model
The mathematical model used was based on the study carried out by Ronald Ross, known as the father of epidemiological models thanks to his work on malaria modeling. In 1950, George McDonald took up the work done by Ross, under similar principles and objectives. In 1956, McDonald published a model as an extension of the model built by Ross, which since then has been known as the Ross McDonald model (Anderson R, 1991) and is still current in works such as (Hernández. E. A. G., 2020) (Paredes, 2018) (Sepúlveda-Salcedo, 2015).
(Arias Castro, 2020) based on Ross Macdonald’s model established a metapopulation model that considered the effect of the mobility of people between zones on the spread of the disease. In this paper, we worked based on this model applied to three zones, which are determined depending on the level of high, medium or low dengue threat. In equations 1, we present how the populations of infected humans and mosquitoes, respectively, in zone are changing over time considering the movement of humans from all zones. The parameters and variables are described in Table 3. This model has six equations.
Equations 1. Equations of the dynamics for humans and mosquitoes in zone i interacting with zones j and k, where i, j, k ∈ {1,2,3} and are different from each other.
Table 3 Description of model parameters and variables.
| Symbol | Description |
| μ | Human recovery rate |
| αμ | Mosquito mortality rate |
| β | Mosquito biting rate |
| λMH | Probability of a human being infected by a mosquito |
| λHM | Probability of a mosquito being infected by a human being |
| ρ | Probability of human displacement |
| πiH | Infected human population in zone |
| πiM | Infected mosquito population zone |
| ωiφ | Connection between zone and zone |
As can be seen in Figure 6, there are three zones, in which there are dengue-infected and non-infected mosquito and human populations in each zone. Therefore, for each zone, there is a disease dynamic involving such parameters as the recovery rate in the human population, the mosquito mortality rate, the mosquito bite rate, the probability of a susceptible mosquito being infected by contact with an infected human, and the probability of a susceptible human being infected by an infected mosquito.
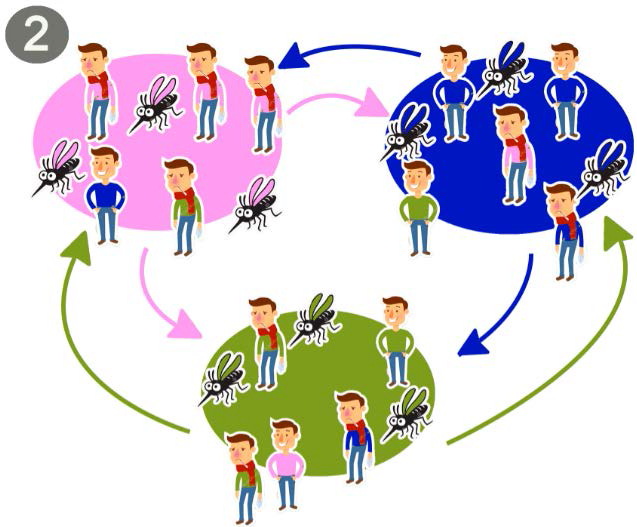
Now, a proportion of the human population in each zone moves to the others with a connecting force between them (Fig. 7), given the daily interactions that occur based on the satisfaction of the population’s daily needs (residence, work, study, access to various goods and services), and a probability that infected humans will move (Arias-Castro, 2020).
Thus, the assumptions of the model are as follows:
Populations, both mosquitoes and humans remain constant over time, for such reason birth and death rates are equal.
The strength of the connection between zones varies depending on how attractive one or the other is for populations of the other to move to.
Human and vector populations are homogeneous in susceptibility and exposure.
Incubation times within humans and mosquitoes are ignored, so individuals involved in the model are infected at the time of contracting the virus.
The acquisition of immunity in humans is ignored.
Mortality and birth in humans is ignored.
Mosquitoes do not recover.
Only susceptible individuals become infected.
Not all infected individuals remain in their original location; some continue to move across the city, potentially spreading the virus.
The model does not consider deaths caused by the disease, either in humans or in mosquitoes (Moore, 2022).
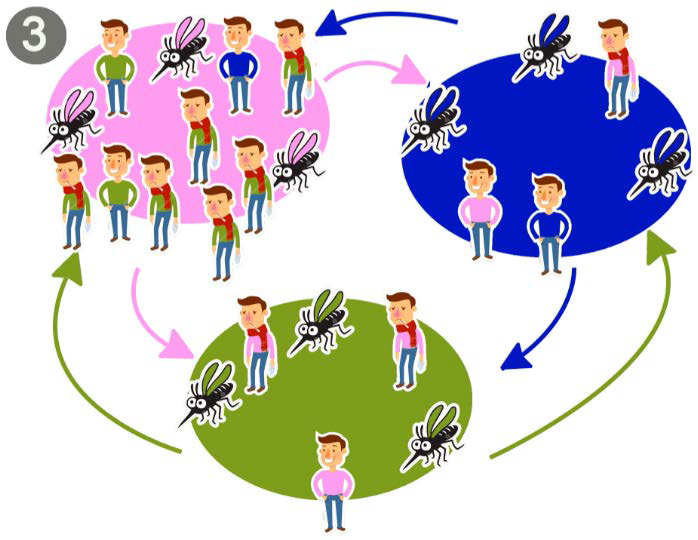
It is important to be clear about how new infections occur. Humans have two ways of becoming infected through the actual bite produced by an infected mosquito from their area or from the area to which they moved (Fig. 8). Mosquitoes also have two ways of becoming infected by biting an infected person from their area, or one that has arrived in their area.
It should be noted that, with this approach, the human population of each zone changes over time, denoted as effective populations (Arias-Castro, 2020).
Optimal Control
As our objective is to establish strategies for dengue dynamics considering areas with different types of dengue threat, we proceeded to introduce some control variables to the proposed model. Then, the Optimal Control Theory allows us to study the evolution of the time-dependent system controlled, in part, by the decisions of an external agent (Lenhart, 2007).
Our goal is to minimize the number of infected humans in each of the zones and the cost associated with the use of controls. Since there are different ways to control the disease, reducing the number of humans infected with the virus provides the city with a plan to mitigate the risk of the disease and, therefore, of a potential catastrophe (epidemic). Among the most used control measures are lethal ovitraps (Morrison, 2008), spatial repellents (Morrison, 2008), insecticide (Morrison, 2008), larvicide (Morrison, 2008), biological controls like Wolbachia bacteria (Cardona-Salgado, 2020) or species that feed on the aquatic phase of the mosquito’s life evolution (Rodríguez Cruz, 2002) (Arias Castro, 2020), educational campaigns (Rodríguez Valdés, 2012).
For Santiago de Cali, the mayor’s office has established strategies for the control of dengue fever, including information campaigns, education campaigns, control of Aedes aegypti larvae, and control of adult populations of the vector. It is important to note that when epidemic outbreaks occur in the city, the response strategy to reduce the outbreak is the application of insecticide in common areas and in homes where there are reports of cases (Cali, 2019).
For this reason, when the occurrence of a dengue epidemic is established as a disaster, the mayor’s office of Cali assumes, as a control measure, the use of insecticide to minimize the mosquito population, as a response to the epidemic, but not as a preventive measure. In this article, we want to establish control strategies when there is an epidemic outbreak and therefore, we will consider as control the use of insecticides to reduce the mosquito population in each zone. Thus, as shown in Figure 9 (the mosquitoes eliminated by spraying have cross-shaped eyes), a control is established that reduces the number of mosquitoes in each zone. Consequently, the only dynamic that is altered is that of the mosquitoes and is given by
Equations 2. Equation of infected mosquitoes in the zone with control given by the increase in mosquito mortality rate, and are different for each other.
In addition to implementing controls, we are interested in reducing infected humans with a minimum cost. Consequently, we have an optimal control problem to solve since we have a dynamic to control with a target to minimize. This optimal control problem has solution, based on Pontryagin’s maximum principle, optimal controls are characterized, and numerical simulations are performed with GPOPS II software to obtain the strategies to be implemented.
Table 5 Controls and effectiviness in the mathematical model.
| Variable | Name |
| v1 | Zone 1 control |
| v2 | Zone 2 control |
| v3 | Zone 3 control |
| η1 | Zone 1 Effectiveness control |
| η2 | Zone 2 Effectiveness control |
| η3 | Zone 3 Effectiveness control |
We want to analyze different control strategies depending on their effectiveness and associated costs. Each strategy may result in a different number of infected individuals. Our objective is to determine which strategy provides the best costeffectiveness-that is, the greatest health benefit (in terms of infections avoided) per unit of cost. To compare the strategies, we use cost-effectiveness ratios, specifically:
and
, (Phillips, 1997),
the ACER index indicates the cost per unit of benefit for each individual strategy, while the ICER index measures the additional cost per additional unit of benefit when moving from one strategy to a more effective (and possibly more expensive) one.
RESULTS
Dengue threat zones
The results of the SPSS correlation process showed that districts 1, 2, 3, 4, 5, 8, and 9 have similar behavior in their data, with an average proportion of infection of 0.23%; this zone was denoted high threat (red) because it contains the highest proportion of cases in the city; Communes 6, 7, 10, 11, 12, 13, 14, 15, 16 and 21, also with a strong correlation in their data, make up the medium threat zone (yellow), with an average proportion of infection of 0.17%, and communes 17, 18, 19 and 22, the low threat zone (green), with an average proportion of infection of 0.14%. It should be clarified that commune 20 showed a strong correlation with most of the communes, except with communes 1, 3, 13, and 22, being communes 1 and 3 closes to it; therefore, by spatial coalescence criterion, this commune was assigned to the low threat zone, since it has communes 18 and 19 as neighbors.
However, neighboring communities show similar patterns in their data. Therefore, when a community presents a high level of contagion, it is very likely that its neighboring communities will also be affected. This spatial correlation indicates that implementing epidemiological controls by treating each commune as an isolated case will not yield the expected results. The clear spatial interconnection must be considered in public health strategies. Based on these patterns, the previously defined three dengue threat zones in the city of Cali are illustrated in Figure 10.
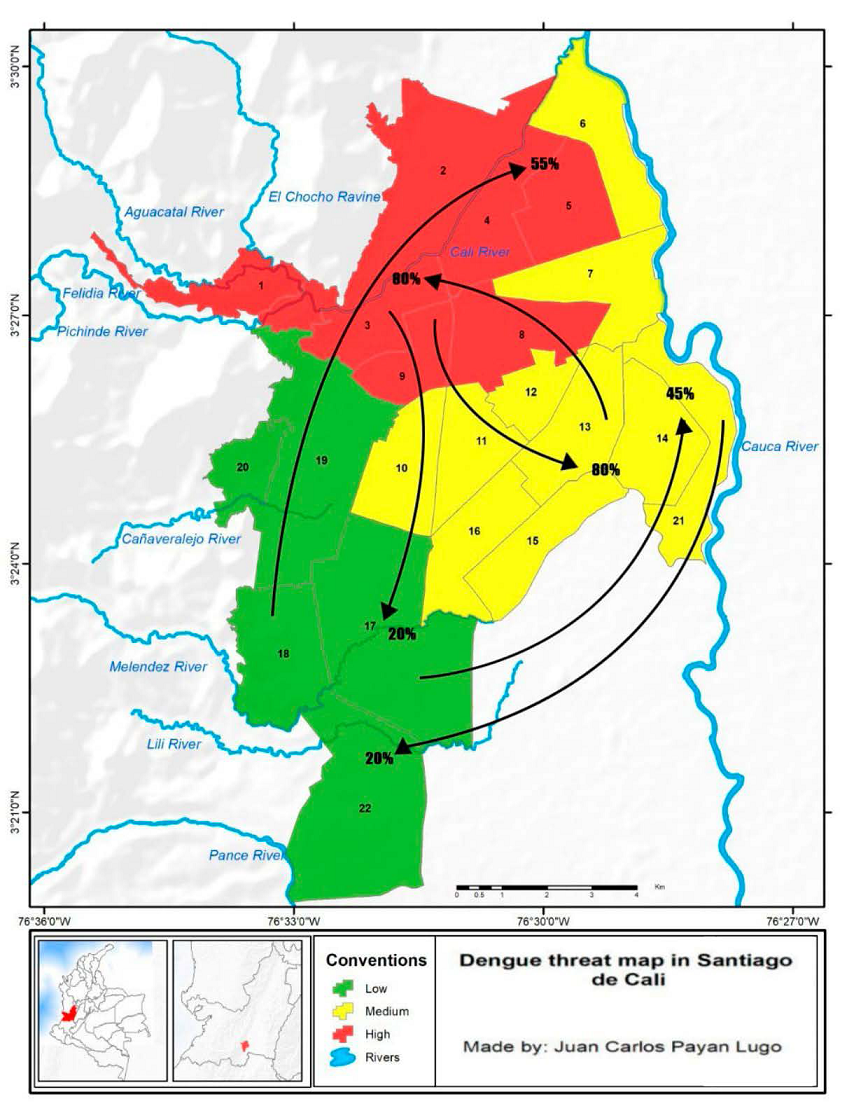
Once the zones were defined, the average of the proportion data for each of the three zones was calculated using data from all the years, in order to determine which zone had the greatest impact of the disease. However, this calculation is not shown in Figure 10, which only illustrates the previously defined dengue threat zones.
Strength of connectivity between the different threat zones
The strength of the connection of the zones is then established based on the mobility of the zones between the three determined zones. This analysis is based on the origin-destination survey (DAPM, 2009), which seeks to determine how connected the three zones are to each other (see Tables 6, 7, and 8), in order to obtain the spread of the disease in Cali and thus establish dengue control strategies accordingly. Table 8 and Figure 11 show the connection forces between the three zones for the city of Cali.
Table 6 The number of people surveyed by zone (DAPM, 2009).
| Zone | High | Medium | Low |
| Total, Respondents | 3302 | 4233 | 1697 |
Table 7 The proportion of displaced and non-displaced people in each zone (DAPM, 2009).
| Displaced | Quiet | |
| High Zone | 56% | 44% |
| Medium Zone | 61% | 39% |
| Low Zone | 88% | 12% |
Table 8 Percentage of people moving to each zone considering the amount of population moving from each zone; based on the origin and destination survey (DAPM, 2009).
| Origin/Destination | High Zone | Medium Zone | Low Zone |
| High Zone | 80% | 20% | |
| Medium Zone | 80% | 20% | |
| Low Zone | 55% | 45% |
We note that the high zone is the most strongly connected, then there is the medium zone, and finally, the low zone. This could be one of the reasons for the spread of dengue fever in Cali.
Table 6 reports the number of inhabitants in each zone at the time the survey was conducted. Table 7 provides the proportion of the population in each zone that engages in daily commuting and the proportion that does not. Finally, Table 8 indicates the distribution of commuters from each zone to the other zones. For instance, among commuters from the high zone, 80% travel to the medium zone and 20% to the low zone.
Control strategies
With the results of sections 3.1 and 3.2, the parameters of the mathematical model and the initial populations given in Table 10, and assuming that controls with a low (cheap), medium, or high (expensive) effectiveness could be used in each zone, numerical simulations were carried out using the GPOPS II program (Lasluisa, 2019). A total of 64 strategies were obtained as a result of the different combinations in the types of control to be carried out.
Table 9 Color description of populations and controls by zone in the simulations.
| VARIABLE | NAME | LINE COLOR |
| P1H | Infected human population zone 1 | RED |
| P2H | Infected human population zone 2 | YELLOW |
| P3H | Infected human population zone 3 | GREEN |
| P1H | Infected mosquito population zone 1 | RED |
| P2H | Infected mosquito population zone 2 | YELLOW |
| P3H | Infected mosquito population zone 3 | GREEN |
| u1 | Zone 1 control | RED |
| u2 | Zone 2 control | YELLOW |
| u3 | Zone 3 control | GREEN |
Table 10 Initial values of populations and associated parameters for Cali.
| VARIABLE | NAME | VALUE |
| P1H | Infected human population zone 1 at | 0,001 |
| P2H | Infected human population zone 2 at | 0,00073 |
| P3H | Infected human population zone 3 at | 0,00061 |
| P1H | Infected mosquito population zone 1 at | 3* P1h |
| P2H | Infected mosquito population zone 2 at | 3* P2h |
| P3H | Infected mosquito population zone 3 at | 3* P3h |
| μ | Human recovery rate | 0,1 |
| αμ | Mosquito mortality rate | 0,03 |
| λh | Probability of an infected mosquito infecting a susceptible human | 0,08 |
| λm | Probability of an infected human infecting a susceptible mosquito | 0,06 |
| ρ | Probability of healthy people moving out of their area | 0,6 |
| w12 | Connection strength from zone 1 to zone 2 | 0,448 |
| w13 | Connection strength from zone 1 to 3 | 0,112 |
| w21 | Connection strength from zone 2 to zone 1 | 0,48 |
| w23 | Connection strength from zone 2 to zone 3 | 0,12 |
| w31 | Connection strength from zone 3 to zone 1 | 0,4785 |
| w32 | Connection strength from zone 3 to zone 2 | 0,3915 |
| N1 | Total population zone 1 | 525.609 |
| N2 | Total population zone 2 | 1.180.768 |
| N3 | Total population zone 3 | 484.312 |
The identification of these simulations is done by a three-digit number, the first one represents the type of control applied in the high zone (zone 1), the second, the one applied in the medium zone (zone 2), and the third, the one applied in the low zone (zone 3), where 0 means no control, 1 means a low effectiveness control, 2 means a medium effectiveness control and 3 means a high effectiveness control. For example, simulation 032 represents the situation where no control was applied in the high zone, a high effectiveness control was applied in the medium zone and a medium effectiveness control was applied in the low zone.
It is important to mention that the numerical simulations took into account the parameters estimated by (Arias, 2018) and that the proposed control is to increase vector mortality using insecticides, the cost of which varies according to their effectiveness. Also, keep in mind that the model was carried out for 90 days and that the total number of inhabitants in each area was obtained from “Cali en cifras 2021”. See table 10.
First, we present the uncontrolled dynamics (000), then we will present some of the most relevant strategies in our development.
Case 1 Strategy 000. Without controls taking into account mobility and without mobility
Intuitively, one would expect that in the numerical simulations, the area with the highest incidence of dengue would correspond to the previously described high-threat zone. However, it’s important to clarify that when risk materializes, its greatest impact does not always occur in high-threat zones, as risk involves more than just threat-it also encompasses other variables.
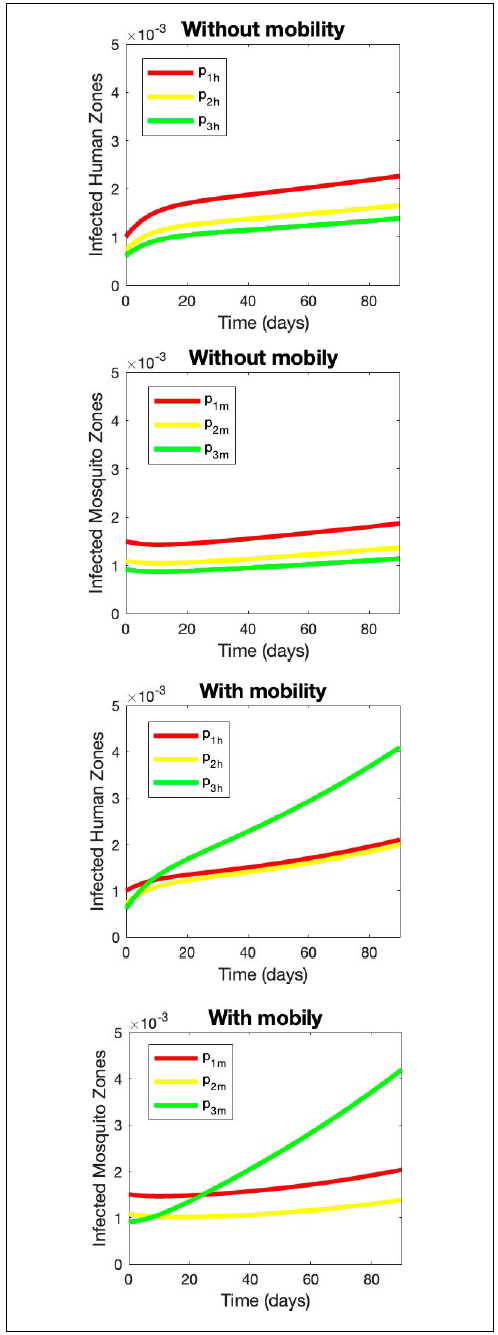
In our simulations, we first analyzed the scenario without any control measures (000) and without considering human mobility (see Fig. 11). As expected, the high-threat zone showed the highest proportion of dengue infections, while the low-threat zone exhibited the lowest proportion of infections in both humans and mosquitoes.
However, when human mobility is incorporated, the results shift: the low-threat zone now presents the highest proportion of infections in both humans and mosquitoes. Although counterintuitive, this outcome can be explained by examining level of outbound movement (see Table 7) is precisely the low-threat zone. People from this area travel to medium- and high-threat zones, becoming infected there rather than in their own community.
Furthermore, the proportion of infections in the high-threat zone decreases compared to the scenario without mobility. This is because, when mobility is considered, this zone receives the largest influx of people from other areas, reducing the mosquito-to-human ratio. As a result, the likelihood of a local resident being bitten by an infected mosquito decreases.
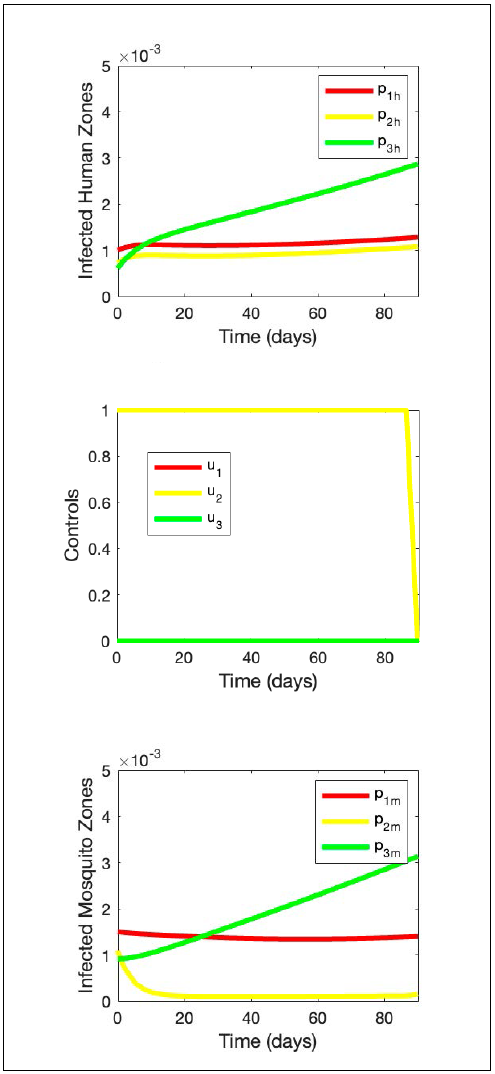
Case 2 Strategy 010. Only low control in zone 2 Comparing the results of strategy 010 (Fig. 12) with those of strategy 000 (Fig. 11), it is observed that:
The control affects the population of infected humans, reducing their proportion across the three zones and keeping the cases in the high and medium zones at an almost constant level; however, in the low zone, the proportion of infected individuals continues to exhibit an increasing trend.
The population of infected mosquitoes shows an increasing behavior in the low zone and decreases in the high and medium zones, reaching practically zero in the medium zone; so, there are fewer infected mosquitoes in these two zones, which explains the reduction of infected humans.
Control should be maximally applied almost every 90 days.
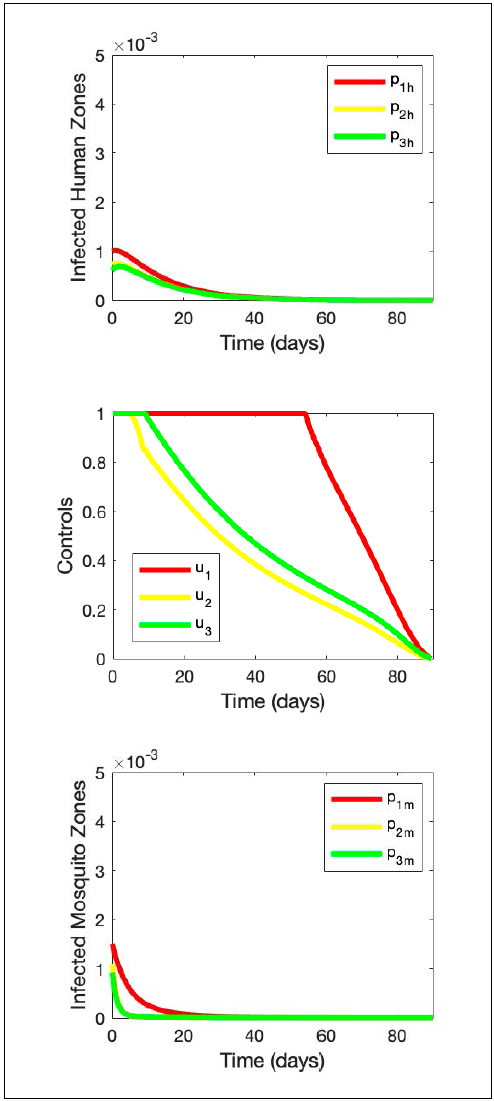
Case 3 Strategy 133. Low control in zone 1 and high control in zones 2 and 3
This simulation (Fig. 13) shows that:
Both the population of infected humans and infected mosquitoes in the three zones are reduced to zero.
Control should be applied at maximum capacity in all three zones, in the high zone for about 40 days, in the middle zone for about 20 days, and in the low zone for about 10 days, and then gradually reduce the application of controls (see Fig. 13).
Cost Benefit Analysis
As we said before, we have 64 strategies and each of them has an impact on dengue dynamics. Since we are interested in proposing a strategy to be applied, we must establish a criterion that allows us to compare them. Therefore, we must identify the benefit of each strategy and then, using the ACER index (see Table 11), determine the best strategy according to its benefit and cost, where the cost of a strategy is given by the cost of the application of controls and the cost to the health system for the number of infected.
Table 11 Results of ACER strategies.
| Strategy | Cost | Benefit | ACER |
| 010 | 266,53 | 0,0691 | 3859,12 |
| 100 | 266,47 | 0,0470 | 5675,54 |
| 020 | 441,14 | 0,0717 | 6152,76 |
| 133 | 850,54 | 0,1013 | 8395,36 |
In this case, the final benefit of each strategy is given by the reduction in cumulative incidence due to the applied controls, this reduction is in comparison with the uncontrolled dynamics. Consequently, according to the ACER index, cost per benefit of the strategy, the best strategy to apply in the city is 010 (see Fig. 12), controlling only the medium zone.
In addition, we used the ICER index (see Table 12), which indicates the cost-benefit ratio to compare two strategies. The results of this index are not exclusive, so any of the four strategies shown could be applied in the city depending on the need and resources of the city, considering that those with a higher ICER would be more expensive but with a better benefit. The best strategy according to ICER is the same as that of ACER, 010. In addition, if we wish to move to a strategy with higher benefit, the next strategy is strategy 133 (Fig. 13), where the index corresponds to the cost per unit of additional benefit of switching from one strategy to another.
DISCUSSION
The mitigation of the risk of a dengue epidemic in Cali requires a spatial and mathematical analysis of the variables that define both the threat of the disease and the vulnerability of communities- particularly those related to mobility and exposure. The mathematical simulations carried out (64 in total) establish possible control scenarios that help identify, in terms of cost-effectiveness, the most efficient integrated treatment for the zones defined according to the historical pattern of infection. A Social Risk Management (SRM) strategy for the dengue epidemic in Cali should rely on the ACER index, to evaluate the cost per unit of benefit of each strategy, and on the ICER index, to compare the additional cost and benefit between different strategies. This approach supports the selection of the most cost-effective intervention to reduce the likelihood of epidemic outbreaks, which carry high social, economic, and cultural consequences. Furthermore, the endemic channel should be formally established as the baseline or acceptable level of risk at the start of the intervention, with the goal of gradually reducing it over time as the strategy continues to be applied.
Although 64 control scenarios were simulated, we selected 4 representative strategies for detailed analysis, as they were optimal according to the ICER and ACER criteria. This selection enables a rigorous comparison of intervention approaches and ensures a focused yet comprehensive interpretation of the results, without compromising the validity of the conclusions.
The interpretation for the dengue epidemic of the concepts of hazard, vulnerability, and risk, as well as the disaster itself that it would imply, leaves open the discussion on them and their scope, both in Epidemiology and in Risk Theory.
On these bases, this work broadens the vision of Risk Construction and Management, as it decenters the analysis of the topics traditionally addressed in them, earthquakes, tsunamis, landslides, volcanoes, among the most significant ones, as if natural events of another genesis could not trigger disaster situations. Likewise, it formulates methods that can be replicated in homologous epidemiological situations and in particular regions of Colombia and the world, broadening their potential scope.
A particular interpretation of the concepts of threat, vulnerability, and risk is also proposed for the dengue epidemic, as well as for the disaster itself. The discussion on them and their scope, both in Epidemiology and in Risk Theory, remains open.
Given the significance that the study evidence of the spatial factors and their interaction (mobility between zones), it would be important not only to carry out the analysis taking into account the communes of the city but also to make it more detailed for the neighborhoods and thus obtain more precise results, gaining effectiveness in the GSR but at the same time making the analysis more complex, given the requirements in the information and its collection and in the management of the data itself.
The mathematical model used allowed studying the dynamics of the disease considering the variables incorporated, which was successful since it was adjusted to the dynamics seen in the city of Cali.
The importance of this type of modeling lies, firstly, in its low cost in relation to field studies that involve enormous time and resources to obtain data that must then be finally processed. Secondly, it makes it possible to recognize, simulate, compare, and conclude various situations in a complex context. And thirdly, it admits a greater number of data that essentially validate the results, through a method that can be replicated in similar scenarios. However, this does not mean that models such as this one does not require field studies, as they complement them, providing input information that allows them to be refined or validated for their subsequent application.
This mathematical modeling can be manipulated using optimal control theory, in which control that increases the mortality rate of the mosquito population using insecticides or larvicides was proposed. Although these chemicals can potentially also affect the nearby fauna and the human population; when used according to the proposed modeling and the projected scenarios, their effectiveness is increased and their spatiotemporal exposure is reduced, reducing the negative environmental externalities.
The strategies chosen in this work were based on the threat zones and how to vary the application of these controls in them. First, traditional simulations were carried out to show the behavior of the dynamics with each of the interventions. Secondly, a costbenefit analysis was carried out with these simulations to make a more robust choice proposal that allows to better propose the strategy for risk reduction and prevent the occurrence of epidemic outbreaks of dengue fever in the city of Cali at a low cost.
The potential of works such as this one is great for epidemiological studies, risk studies, and even mathematical models applied to solve social issues.
CONCLUSIONS AND RECOMMENDATIONS
From the integration of mathematics, geography, and medicine in this work, it is possible to draw the following conclusions:
It is necessary for these types of situations to incorporate both the human and the vector in the concept of threat because both define the possibility of exposure to the disease.
The concept of vulnerability includes social factors such as population distribution, access to water, and access to health services, among others. These factors could be incorporated into the mathematical model in future work.
The mathematical model was adjusted to the dynamics of Cali, which made it possible to analyze it at a low cost.
It was possible to characterize the threat of dengue fever in the city and the connection between the defined zones. High zone communes 1, 2, 3, 4, 4, 5, 8 and 9, middle zone communes 6, 7, 10, 11, 12, 14, 15, 16 and 21, low zone communes 17, 18, 19, 20 and 22.
The cost-benefit analysis shows that control of the middle zone has a better impact, considering ACER index. Based on the ICER values, the strategies 010, 133, 233, and 333 form a sequence in which each successive strategy provides additional benefit at an acceptable additional cost. Although ICER does not directly indicate the “optimal” strategy, it helps identify the most cost-effective pathway when moving between alternatives. Therefore, this sequence is recommended for consideration in progressive implementation scenarios. (Lasluisa, 2019)
Given the significance that this study evidenced regarding spatial factors and their interaction (mobility between zones), it would be important not only to conduct the analysis considering the city’s districts (comunas), but to delve further into the neighborhoods to obtain more precise results, increasing effectiveness in Risk Management. However, this would also complicate the analysis due to the requirements in information gathering, data management, and their compilation.
Since the concept of vulnerability includes social factors such as access to water and healthcare services, as well as the epidemiological profile of the population, these variables should be incorporated into complementary models in future exercises.
There is a need for closer collaboration between academia and the public sector in this matter, so that the development of this type of work and its results go beyond purely academic settings and influence public policy. Undoubtedly, this will benefit the public sector in implementing more assertive, efficient, and cost-effective measures, as well as benefiting academia in its ability to respond to the needs and demands of society and contribute to solving regional problems for the benefit of society as a whole.

