Artículos
From a health crisis to economic and labor crises: spatial patterns of the impact of COVID-19 on formal employment in Mexico


-
Publication dates-
September 20, 2021
April , 2021
- Article in PDF
- Article in XML
- Automatic translation
- Send this article by e-mail
- Share this article +
Abstract
After a brief review of the implications for Mexico of the influenza A (H1N1) pandemic in 2009 and similar studies on the impact of COVID-19 on the labor market, this study addresses the early development of the epidemic in Mexico and the actions taken by the federal government to face this issue. Its impacts on the economy in general and on the labor market in particular are analyzed below. The focus is on its consequences on formal employment based on data from the Mexican Social Security Institute (IMSS) to determine spatial patterns and their relationship with economic activities. The dramatic loss of jobs in traditional beach+sun resorts that hit particularly hard the Cancun, Riviera Maya and Riviera Nayarit destinations has occurred along with a crisis in the accomodation and catering services in large cities such as Mexico City. The near-total closure of manufacturing activities, particularly in the automotive industry, has severely affected the Bajío corridor, while the northern border underwent a major industrial diversification triggered by the crisis. Construction is also seriously affected, impacting both the scarce formal employment in small rural municipalities and jobs in large metropolitan areas and cities; especially the Monterrey metropolitan zone and oil-extraction areas such as Cd. del Carmen and Tampico-Altamira-Cd. Madero. Last, the decline in formal employment in certain agricultural regions, mainly areas of commercial agriculture, is not attributable to the epidemic but to the seasonal nature of this activity.
Key words::
spatial patterns, Mexico, COVID-19, labor market, economic crisis
INTRODUCTION
The current pandemic triggered by COVID-19 is the closest major health-crisis following the 2009 pandemic caused by the influenza A (H1N1) virus. In Mexico, Influenza A was first detected in April and was quickly followed by several social- distancing measures similar to those adopted for COVID-19 (DOF, 04/25/09 and 04/30/09; Gaceta Oficial del D.F., 04/25/09), including the following: suspension of school activities, initially only in Mexico City and the State of Mexico and only for two weeks, although it was extended a few more days in some educational levels and States; and the suspension of on-site work in the Federal Public Administration and the non-essential productive sector from May 1 to 5. However, the epidemic extended for the rest of 2009, with three waves or peaks in April, June, and particularly September-October, after which it declined even before the start-up of the vaccination process (Oehmichen-Bazán and Paris, 2010; Vargas-Palacios, 2017); by August-September 2010, the epidemic was deemed to have ended (DOF, 24/09/10). Its consequences in terms of infections and deaths were much lower compared to COVID-19: 45.8 thousand persons infected and 271 deaths as of 19 October 2009, with an estimated 400 thousand infections and 5 thousand deaths worldwide, most of them in the Americas (Ministry of Health, 2009)
-
Oehmichen-Bazán and Paris, 2010El miedo ante el riesgo global: apuntes sobre la emergencia sanitaria del virus A/H1N1 y el turismoNuevas Tendencias en Antropología, 2010
-
Vargas-Palacios, 2017An Economic Evaluation of the A(H1N1) Flu Vaccine in Mexico, 2017
-
Ministry of Health, 2009Situación actual de la epidemia. 20/10/2009, 2009
In spite of the short duration of the closures, the estimated economic impact was an additional fall in GDP of 0.7 percentage points and the loss of 256 thousand jobs, with similarities to the current crisis given the greatest losses in tourism (and associated activities such as restaurants and air transportation) and commerce. The most affected areas were Mexico City and its metropolitan area, -which, due to its demographic concentration, is the subject of larger-scale social-isolation actions- and Quintana Roo - because of its strong dependence on tourism -; the estimated reductions in GDP due to the pandemic in these areas were -1.4% and -4.9%, respectively (ECLAC, 2010). However, these effects were diluted within the most serious consequences of the 2008-09 global financial crisis in Mexico, which started in late 2008 and peaked in the second quarter (hereafter 2Q) of 2009, coinciding with the pandemic outbreak.
-
ECLAC, 2010Evaluación preliminar del impacto en México de la influenza AH1N1, LC/MEX/L.958, 2010
In relation to the short-term impact of COVID-19 on the labor market, several authors emphasize its differential impact, with a greater loss of jobs affecting the most vulnerable workers: the lowest-wage, informal, or self-employed workers; the least qualified jobs; young workers; micro and small businesses; part-time or hourly jobs; jobs requiring face-to-face contact; or ethnic minorities. Many of these categories are intertwined, so this phenomenon is reinforced. This differential impact is not unique to developing countries in Latin America (Weller et al., 2020; Cereda et al., 2020), but is also evident in economies such as the United States, the United Kingdom, Canada, or Australia (Bell and Blanchflower, 2020; Lemieux et al., 2020; Uren, 2020). Beyond the initial shock caused by the pandemic, it contributed to speed-up and deepen changes already ongoing in the developing labor market, including the steady polarization between best- and worst-paid workers fueled by a technological transformation driven by increasing digitization (Weller, 2020; Uren, 2020) evident, for example, in the possibility of remote working. A relevant question in this scenario is whether certain jobs (routine and low-skilled) that have disappeared will return, adding the reduction in wages to the loss of jobs, which have jointly lowered the purchasing capacity of many households and led to increased poverty.
-
Weller et al., 2020El impacto de la crisis sanitaria del COVID-19 en los mercados laborales latinoamericanos, 2020
-
Cereda et al., 2020COVID-19, labor market shocks, and poverty in Brazil: a microsimulation analysis, 2020
-
Bell and Blanchflower, 2020US and UK labour markets before and during the COVID-19 crashNational Institute Economic Review, 2020
-
Lemieux et al., 2020Initial Impacts of the COVID-19 Pandemic on the Canadian Labour MarketCanadian Public Policy, 2020
-
Uren, 2020The unequal burden of the COVID-19 labour market collapse, 2020
-
Weller, 2020El impacto de la crisis sanitaria del COVID-19 en los mercados laborales latinoamericanos, 2020
-
Uren, 2020The unequal burden of the COVID-19 labour market collapse, 2020
These situations are particularly serious in Latin America because of its structural features: greater presence of the informal sector, greater levels of poverty and inequality, less coverage (or absence) of unemployment insurance. The estimated fall in per-capita GDP and the higher poverty levels represent a regression of 10 and 14 years back, respectively, prompting the need to establish a basic emergency income and even a food bond (CEPAL-OPS 2020).
-
CEPAL-OPS 2020Salud y economía: una convergencia necesaria para enfrentar el COVID-19 y retomar la senda hacia el desarrollo sostenible en América Latina y el Caribe, 2020
OBJECTIVES AND METHODS
This research analyzes the impact of COVID-19 on the Mexican labor market in general and on formal employment in particular. To this end, two main statistical sources were used: first, INEGI, with its National Survey of Occupation and Employment (ENOE1) and its Telephone Survey of Occupation and Employment (ETOE), which are administered quarterly and monthly, respectively. To note, although INEGI points out that these surveys are not strictly comparable, it recognizes the value of ENOE data as a baseline for analyzing the evolution of labor market during the epidemic. Second, IMSS data on employees with health insurance coverage, which are the “hard core” of the country’s formal employment and with two advantages over INEGI data: IMSS data are not a sample, but the record of all workers affiliated to this government institution; also, IMSS data are spatially disaggregated at the municipal level (except for Mexico City). This second feature supports another objective of this work: explore spatial patterns related to the impact of the epidemic on formal employment.
However, two aspects of IMSS data deserve clarification: 1) According to the June 2020 ETOE, IMSS-affiliated workers account for just over one- third of the total number of workers in Mexico (34.8%); 2) unlike ENOE and ETOE, IMSS data refer to jobs rather than workers, and a given worker can perform one or more jobs.
These statistics are supplemented by other official data published on a monthly basis, as COVID-19 has highlighted the importance of having data that are not only reliable but up-to-date produced on biweekly, monthly, or even daily basis, which largely restrains data availability. In this respect, the research documented herein is based on data available up to mid-August 2020, date of drafting of this paper, thus setting a temporal coverage of the analysis up to June-July 2020.
The statistical sources were supplemented with the review and analysis of official publications and newspaper articles to provide a broader, dynamic, and up-to-date account of the epidemic’s evolution and its economic and labor consequences.
EVENTS LEADING TO THE SUSPENSION OF NON-ESSENTIAL ACTIVITIES
The first case of a COVID-19 infection in Mexico was reported on February 28, nearly two months after the authorities in Wuhan (China) notified WHO of the first cases of COVID-19; this report triggered the so-called Phase 1 in Mexico. Until late February, the epidemic hit mainly China, with relatively minor impacts in other Asian countries (South Korea, Japan), an area of the world with which Mexico has a limited exchange of visitors. However, the epidemic expanded to Europe, especially Italy and Spain, in March; on March 11, COVID-19 was declared a pandemic by WHO. It is then that the virus started spreading across America, although in March and until mid-April, Europe became the epicenter of the pandemic. The significant number of commercial flights between the United States and Europe was the primary route of entry of the virus to Mexico. From mid- late April, the epicenter of the pandemic moved to America, mainly into the United States, followed by Brazil, Mexico, and Peru.
In the face of the epidemic, the Mexican federal government implemented a number of actions. On March 14, the Ministry of Education mandated to postpone the Easter holidays; that same day, it announced further actions that made up the so-called National “Healthy Distance” Season that came into effect on Monday March 23; the so-called Phase 2 started the following day. By that date, infections amounted to around one thousand hundred, with only ten deaths. The government published several agreements and decrees containing various initiatives (DOF, 03/24/20; 03/27/20) and finally declared a health emergency (DOF, 03/30/20). These measures included voluntary home lockdown, suspension of school activities, and the recommendation to work from home.
One day later, the “Agreement that Sets Out Extraordinary Actions to Address the Public-Health Emergency Caused by the SARS-CoV2 Virus” (DOF, 03/31/20) was published, which mandated the immediate suspension of non-essential activities until April 30; according to this agreement, health care, safety, food, energy and water gene- ration and supply, transportation of passengers and goods, telecommunications, and the financial system were considered as essential activities.
The actions implemented, however, were insufficient to stop the spread of the virus. Four weeks later (April 21) Phase 3 was declared, when 1.6 thousand infections and 15.8 thousand deaths accumulated; the suspension of non-essential activities was extended until May 30 (DOF, 04/21/20).
RESUMPTION OF ECONOMIC ACTIVITIES
Before the end of the National Healthy Distance Season and the beginning of the so-called New Normality on June 1, the federal government implemented a four-level “epidemiological signal”, an indicator aiming to outline the strategy for the resumption of activities from that date. This indicator, which is reviewed on a weekly basis, determines the economic activities that are allowed and their level of activity, according to the epidemiological situation of each State (DOF, 05/14/20). The need to reach a consensus with State governments on this sanitary signal led to tensions between State and Federal governments, magnified by party affiliations and the particular economic interests of each State government. Thus, the Association of Governors of the National Action Party (GOAN) readily threatened to issue its own local epidemiological signals because it considered the restart of activities to be hasty.
Only one day after the State epidemiological signals were issued, mining, construction, and manufacturing of transportation equipment were added to the list of essential activities (DOF, 05/15/20). The relevance of the car manufacturing industry in Mexico and its liaison with the American production chain, which was already resuming activities, backed this decision. However, it was restrained by the Morena advocate Miguel Barbosa, governor of Puebla, who in view of the lack of suitable sanitary conditions, issued a couple of decrees halting the restart of these productive activities, thus affecting the Volkswagen and Audi manufacturing plants in Puebla. It was until June 29 that Volkswagen resumed operations.
In reality, the resumption of economic activities was very limited, even with setbacks as a result of the epidemic. After a two-month suspension of activities and given the need to revitalize the economy, only the State of Zacatecas was awarded the orange grade in the first week of application of the epidemiological signal initiative, later downgraded in the second week (June 8 to 14), so all States were in the red category. In the third week (June 15 to 21), sixteen states got the orange grade, but only thanks to a modification of the criteria established initially;2 it is only until August 17 that a State, Campeche, got the yellow grade. In spite of this situation, each state regulated the epidemiological signal, which allowed the re-start of certain activities or the modification of the percentage of allowances within a given color signal; this is the case of Mexico City within the orange signal.
The epidemiological circumstances were not ideal for the resumption of activities on June 1 since they were even worse than at the start of the economic shutdown3, and in fact led to various “steps backward”. Thus, several states were down- graded from orange to red (Zacatecas, Chiapas, Guanajuato, Coahuila, Veracruz, and others). Another example is the closing of businesses over a weekend in the Mexico City Historical Center. the application of the epidemiological signal per suburb in Mexico City from July 13; or the split of the State of Quintana Roo into north (orange grade) and south (red grade) regions. This resulted not only in new suspensions of activities, but also in increased uncertainty, with businesses discontinuing activities from one week to another.
Regarding the economic actions applied by the federal government, the experience from previous economic crises -especially the one in late 1994 and the role of FOBAPROA in rescuing the financial system- is mentioned as an example of the mistakes and corruption of the neoliberal model. There has been an evident and public lack of consensus and agreements between the government and large companies on the economic measures to adopt, as expressed by both the President of Mexico and the Business Coordinating Council: no fiscal incentives, a moratorium on the payment of taxes, or much less debt/tax forgiveness or bailouts will be allowed or granted (El Universal, 03/25/20; Forbes, 04/27/20; La Jornada, 04/27/20), consistent with the electoral promise of not increasing public debt. The actions taken by the federal government include the provision of micro-credits, mainly through the Ministry of Economy (SE) and its Financial Support Program for Family Microenterprises (PAFMF, also known as the “Credit-to-the- Word” Program) and its Micro-credit Program for Welfare (Tandas for Welfare).4 Additional to these actions are micro-credit programs implemented by State governments and private banks favored by the Bank of Mexico through various actions, such as reducing and releasing resources from the monetary regulation deposit and boosting their channeling to credits for businesses and individuals (Bank of Mexico, Press Release, 03/20/20 and 04/21/20; Deloitte, 05/14/20).
However, according to the IMF (2020), the resources allocated to the set of measures implemented in Mexico is minimal compared to other countries, even within the Latin American context: these account for a mere 1.2% of GDP, making of Mexico the country with the fifth-lowest percentage of the 56 reported, below Peru (17.0%), Brazil (11.9%), Chile (10.1%), and Argentina (4.8%), and even Honduras (4.3%), or Colombia (1.8%).
-
IMF (2020)Database of fiscal policy responses to CO- VID19. June 2020, 2020
With regard to actions to mitigate job losses or their consequences, Mexico is among the few OECD countries that lacks and has not launched programs to provide economic support to persons who lose their jobs, such as those in place in the United States.5 It also lacks and has not implemented schemes to prevent or minimize layoffs, that is, government funds to subsidize the labor costs of companies forced to reduce the number of hours worked or active workers. With COVID-19, these schemes are widely used in some OECD countries such as France (Activité Partielle), Germany (Kurzabeit), or Spain (ERTEs), and they largely explain why job losses and unemployment rates in these countries are increasing at a far lesser rate than in countries that have not launched these schemes, such as the United States or Canada (OECD, 2020b; 2020c).
-
OECD, 2020bSupporting people and companies to deal with the COVID-19 virus: options for an inmediate employment and social-policy response, 2020
-
2020cEmployment Outlook 2020. Worker security and the COVID-19 crisis, 2020
FROM A PUBLIC-HEALTH CRISIS TO ECONOMIC AND LABOR CRISES
The virtual paralysis of economic activities in Mexico and worldwide was rapidly reflected in various indicators such as GDP, with declines in 2Q 2020 reaching record levels over decades in these countries (Table 1). The economic collapse is such that Mexico more than doubled the record fall for 2Q 1995, a situation aggravated by being preceded by four consecutive quarters of GDP decline. Only Spain (-22.10%) and the United Kingdom (-21.72%) have experienced a worse collapse than Mexico.
Table 1
GDP variation versus the same quarter of the previous year, 2019-2020 (percent).
GDP variation versus the same quarter of the previous year, 2019-2020 (percent).
| Country/Region | 2019 | 2020 | Highest pre-COVID decline | |||||
| Quarter |
Quarter |
Quarter |
Quarter |
Quarter |
Quarter |
(Year-Quarter) | Start Series |
|
| Mexico | 0.08 | -0.02 | -0.46 | -0.79 | -2.13 | -18.68 | -8.61 (1995-T2) | 1961 |
| United States | 2.27 | 1.96 | 2.08 | 2.34 | 0.32 | -9.14 | -3.92 (2009-T2) | 1948 |
| NAFTA | 1.98 | 1.76 | 1.78 | 1.96 | -0.02 | -10.79 | -4.26 (2009-T2) | 1963 |
| Brazil | 0.77 | 1.44 | 0.69 | 1.62 | -1.43 | -11.39 | -5.48 (2015-T4) | 1997 |
| Argentina | -6.00 | -1.33 | -0.46 | -0.33 | -5.29 | - - | -15.22 (2002-T1) | 1994 |
| Colombia | 2.62 | 3.61 | 3.45 | 3.35 | 0.41 | - - | +0.09 (2009-T1) | 2006 |
| Chile | 1.89 | 1.85 | 2.77 | -2.39 | 0.40 | -13.69 | -4.00 (1999-T2) | 1996 |
| Germany | 1.10 | 0.11 | 0.76 | 0.40 | -2.23 | -11.26 | -7.03 (2009-T1) | 1961 |
| Italy | 0.27 | 0.39 | 0.46 | 0.08 | -5.56 | -17.74 | -7.03 (2009-T1) | 1961 |
| Spain | 2.19 | 2.03 | 1.93 | 1.78 | -4.07 | -22.10 | -4.36 (2009-T2) | 1961 |
| European Union (27 countries) | 1.71 | 1.54 | 1.60 | 1.21 | -2.53 | -14.15 | -5.37 (2009-T1) | 1996 |
-
OECD (2020a)OECD Statistics, 2020
One of the early actions taken against the epidemic over the world was the restriction on mobility, both at personal (home lockdown) and country (border closure) levels. In this regard, Mexico is perhaps one of the countries with less restrictions enforced: home lockdown is voluntary and the closure of land borders with the United States was agreed only as of March 21 (Canada joined in afterward), but essential trips were still allowed; the vital trade between the two countries was maintained. The closure of air borders was imposed when Europe and other countries close their borders. The impact on tourism - one of the pillars of the Mexican economy, with 8.7% of GDP and 6.0% of paid employment - was immediate (Figure 1):
-
In May, passenger arrivals in Mexican airports fell by 93.4% interannually, translating into the loss of 6.1 million passengers, one-third from abroad (SCT, 2020).
-
In the same month, hotel occupancy plum- meted to 3.1% (0.4% in beach destinations), equivalent to a 57% fall versus the same month of 2019 (SECTUR, 2020).
-
Finally, GDP associated with accommodation and catering recorded a 7.9% decline in real-year terms in 1Q 2020 that plummeted to -70.4% in the second quarter (INEGI, 2020a), with estimates of a 46% decline at the end of 2020 (El Economista, 05/14/20; Sin Embargo, 05/26/20).
-
SCT, 2020Estadística operacional de aerolíneas. Estadística operacional por origen-destino, 2020
-
SECTUR, 2020Reporte monitoreo hotelero, abril 2020, 2020
-
INEGI, 2020aBanco de Información Económica. Cuentas Nacionales, 2020
Thumbnail
 Note: Percent change versus the same month of the previous year, except for “Hotel Occupancy”, whose evolution is expressed in percent points.Source: Own elaboration.
Figure 1
Evolution of economic indicators, January 2019 - June 2020
Evolution of economic indicators, January 2019 - June 2020
Meanwhile, home lockdown and the consequent reduction in gasoline consumption, together with fears of a global recession, stirred the oil and exchange markets. Compared to an average of 54 USD per barrel in January, the Mexican mix collapsed to 12 USD in April and then recovered in August to 40 USD (Figure 1), still far from the 49 USD per barrel estimated in the federal government’s budget, representing a significant reduction versus expected oil revenues. This adds to the effect on Pemex’s deteriorating finances, reflected in its downgrading by Fitch and Moody in April and with foreseeable consequences on sovereign-debt ratings in the coming future.
The fall in oil revenues adds to the reduction in the collection of IEPS on gasolines and diesel and other taxes, leading to a 4.7% reduction in real-year budget income by the public sector, with major declines since April (Figure 1).
In the exchange market, the Mexican peso is one of the worst-affected currencies alongside the Brazilian real, with a 18.1% depreciation against the dollar between January and August; its maximum devaluation occurred on March 24 (35.1%), when the exchange rate was 25.1 pesos per dollar (Figure 1). This devaluation involves both opportunities and risks. On the one hand, it can raise the competitiveness of the export industry; on the other, it can boost inflation and aggravate the financial issues of companies with dollar debts, including Pemex and the federal government itself, which could be perceived either as a risk or a business opportunity for foreign investment.
Meanwhile, the contraction in employment, which will be discussed below, has forced many former formal workers to make partial withdrawals from their pension funds (Afores), with with- drawals reaching historical maxima from April to July, 75.1% higher than figures for the same months of 2019 (Figure 1).
On the positive side, remittances continued growing (10.0% per year in January-July), with historic maxima in March and June, buffering the fall in foreign revenues from oil exports, the automotive sector, and tourism.
In conclusion, the economic outlook is grim. As in many other countries, the major question is how deeper down the recession will fall and how long it will last, with Mexico evolving from an already unfavorable situation as it suffered five consecutive quarters of GDP decline. There will be major social consequences, with an estimated increase of 8.9-9.8 million persons under poverty to reach 70.0-70.9 million, representing an overwhelming 56.0- 56.7% of the population (CONEVAL, 2020a).
-
CONEVAL, 2020aLa política social en el contexto de la pandemia por el virus SARS-CoV2 (COVID-19) en México, 2020
IMPACT OF THE PANDEMIC ON THE LABOR MARKET
The effect of COVID-19 on the economy in general and on employment in particular has been not only profound but also dazzling; according to OECD (2020c), its impact on the labor market in the first few months was ten times higher than the impact of the 2008 financial crisis. In quarterly terms, Mexico lost nearly 10 million jobs in 2Q 2020, accounting for 18.0% of total employment - the highest rate of the four countries in Table 2.6 According to the ETOE, this decline occurred sharply in April, when 12.5 million jobs were lost, equivalent to the jobs created over the past fourteen years. The extraordinary situation and the disheartening difficulties to find short-term employment explain that a significant proportion of workers shifted directly from occupation to inactivity.7 A slight recovery of occupation occurred in May (+284 thousand jobs), later accelerating with the reopening of certain activities in June (+4.8 million jobs) and July (+1.5 million), thereby recovering 52.1% of the jobs lost (INEGI, 2020b).
-
OECD (2020c)Employment Outlook 2020. Worker security and the COVID-19 crisis, 2020
-
INEGI, 2020bEncuesta Telefónica de Ocupación y Empleo, 2020
Table 2
Evolution of the number of employed persons, 2Q 2020 vs. 2Q 2019.
Evolution of the number of employed persons, 2Q 2020 vs. 2Q 2019.
| Thousands of persons employed | Percentage | |||||||
| Mexico | USA | Brazil | Spain | Mexico | USA | Brazil | Spain | |
| Total |
-9869 |
-19 287 |
-9995 |
-1198 |
-18.0 |
-12.3 |
-10.3 |
-6.0 |
Who have been the worst-affected workers? Considering the various economic activities, tourism (accommodation, catering) is the worst-hit sector in almost all countries. In Mexico, this adds to its slow recovery according to ETOE data: as of June 2020, it only recovered 16.2% of the jobs lost in April, compared with the 40.4% recovery at country level, a situation that contrasts with construction, also severely affected but with a faster job recovery rate (53.6%). The best development has taken place in the primary sector, which by June even exceeded its number of workers in March; on the opposite end are the financial and insurance sectors, whose loss of workers continued even in June. a circumstance that also replicated in the extractive industries (electricity, water, and gas).
Certainly, job losses may be markedly different within each sector, for which ETOE data do not allow a sufficient disaggregation, as in the case of the manufacturing and commerce sectors. Other monthly surveys addressing both activities (EMIN and EMEC) shed light on this through their indices of employed persons. The retail, self-service stores (supermarkets and convenience stores), and Internet commerce are among the few economic activities showing an increasing number of per- sons employed in April, as opposed to a moderate decline of jobs in grocery and food shops where self-employment and unpaid family employment predominate. This stems from their classification as essential activities, so these shops have remained open. Some of the biggest losses involve the beverages sector (suspension of beer production), perfumes and jewelry, stationery (suspension of face-to-face classes in schools), and departmental stores, the latter managed by a few big companies. In the manufacturing sector, some branches of the food industry show a modest increase in employees in April and May from its classification as an essential activity, along with the tobacco industry and some specific branches such as communication equipment or fertilizers. The automotive industry deserves special mention for its economic weight. While experiencing a near-total shutdown,8 this sector maintained its jobs in contrast with other similar industries that resorted to layoffs (manufacture of car bodies and trailers, railway and aerospace equipment), although the scenario from IMSS data is certainly different, as discussed below.
Beyond the analysis by type of activity, job losses affected women more severely than men in April, although both showed a similar recovery in June. As for age groups, although older adults (65 years and older) and young people (15-24 years old) were initially the most affected groups, the faster recovery of jobs in older adults made of young adults worst-hit age group in June, followed by mature adults (45-64 years old) (Table 3).
Table 3
Monthly evolution of the number of employed persons, March-June 2020.
Monthly evolution of the number of employed persons, March-June 2020.
| Employed persons (thousands) | Variation, employed persons (thousands) | Variation, employed persons (percent) | ||||||||||
| March | April | May | June | Mar- |
Apr- |
May- |
Mar- |
Mar- |
Apr- |
May- |
Mar- |
|
| Total | 55,756 | 43,295 | 43,579 | 48,328 | -12,461 | 284 | 4,749 | -7,427 | -22.3 | 0.7 | 10.9 | -13.3 |
| Men | 33,515 | 26,464 | 26,183 | 29,162 | -7,051 | -281 | 2,979 | -4,322 | -21.0 | -1.1 | 11.4 | -12.9 |
| Women | 22,241 | 16,831 | 17,396 | 19,166 | -5,410 | 565 | 1,770 | -2,702 | -24.3 | 3.4 | 10.2 | -12.4 |
| 15 to 24 years 1/ | 8,818 | 5,584 | 5,798 | 6,425 | -3,234 | 215 | 627 | -2,393 | -36.7 | 3.8 | 10.8 | -27.1 |
| 25 to 44 years 1/ | 25,873 | 20,761 | 21,293 | 23,709 | -5,112 | 532 | 2,416 | -2,164 | -19.8 | 2.6 | 11.3 | -8.4 |
| 45 to 64 years 1/ | 17,558 | 15,120 | 14,336 | 15,347 | -2,438 | -784 | 1,011 | -2,211 | -13.9 | -5.2 | 7.1 | -12.6 |
| 65 years and over 1/ | 3,068 | 1,807 | 2,141 | 2,806 | -1,261 | 334 | 665 | -261 | -41.1 | 18.5 | 31.1 | -8.5 |
| Not specified 1/ | 36 | 24 | 11 | 41 | -12 | -13 | 30 | 5 | -33.2 | -55.4 | 279.3 | 13.0 |
| Up to one minimum wage | 12,261 | 11,164 | 11,182 | 11,504 | -1,097 | 18 | 322 | -757 | -8.9 | 0.2 | 2.9 | -6.2 |
| >1 to 2 minimum wages | 20,202 | 15,125 | 14,318 | 17,810 | -5,076 | -808 | 3,492 | -2,392 | -25.1 | -5.3 | 24.4 | -11.8 |
| >2 to 3 minimum wages | 8,917 | 6,321 | 5,531 | 6,423 | -2,596 | -790 | 892 | -2,494 | -29.1 | -12.5 | 16.1 | -28.0 |
| >3 to 5 minimum wages | 3,979 | 3,338 | 3,266 | 3,075 | -641 | -73 | -191 | -904 | -16.1 | -2.2 | -5.8 | -22.7 |
| >5 minimum wages | 1,738 | 1,181 | 1,136 | 1,094 | -557 | -45 | -43 | -644 | -32.0 | -3.8 | -3.8 | -37.1 |
| Unpaid | 2,678 | 1,263 | 2,239 | 2,453 | -1,415 | 976 | 214 | -225 | -52.9 | 77.3 | 9.6 | -8.4 |
| Not specified | 5,981 | 4,903 | 5,908 | 5,970 | -1,078 | 1,005 | 63 | -10 | -18.0 | 20.5 | 1.1 | -0.2 |
| Non-farming | 47,263 | 35,712 | 36,171 | 39,856 | -11,551 | 459 | 3,685 | -7,407 | -24.4 | 1.3 | 10.2 | -15.7 |
| Micro-businesses | 22,772 | 14,728 | 16,471 | 17,636 | -8,044 | 1,743 | 1,165 | -5,136 | -35.3 | 11.8 | 7.1 | -22.6 |
| Small businesses | 8,492 | 6,211 | 5,618 | 6,874 | -2,281 | -592 | 1,256 | -1,617 | -26.9 | -9.5 | 22.3 | -19.0 |
| Medium-sized businesses | 5,489 | 5,041 | 4,705 | 5,504 | -448 | -336 | 798 | 14 | -8.2 | -6.7 | 17.0 | 0.3 |
| Large businesses | 5,112 | 3,805 | 3,473 | 4,098 | -1,307 | -332 | 625 | -1,014 | -25.6 | -8.7 | 18.0 | -19.8 |
| Government and others | 5,398 | 5,927 | 5,904 | 5,744 | 529 | -23 | -160 | 346 | 9.8 | -0.4 | -2.7 | 6.4 |
| Underemployed | 5,084 | 11,003 | 13,048 | 9,691 | 5,919 | 2,045 | -3,358 | 4,606 | 116.4 | 18.6 | -25.7 | 90.6 |
| Informal | 31,047 | 20,662 | 22,590 | 25,627 | -10,385 | 1,928 | 3,037 | -5,420 | -33.4 | 9.3 | 13.4 | -17.5 |
| Formal | 24,709 | 22,633 | 20,989 | 22,701 | -2,076 | -1,644 | 1,712 | -2,008 | -8.4 | -7.3 | 8.2 | -8.1 |
| Hours worked per week | 43.0 | 37.8 | 37.6 | 39.4 | -5.2 | -0.3 | 1.8 | -3.7 | -12.1 | -0.7 | 4.8 | -8.5 |
| Income (Mxn) per hour worked | 42.7 | 59.9 | 50.6 | 48.0 | 17.2 | -9.2 | -2.6 | 5.4 | 40.3 | -15.4 | -5.2 | 12.5 |
| Monthly income (Mxn) per employee 1/ | 6,759 | 6,771 | 6,423 | 6,480 | 12 | -348 | 57 | -279 | 0.2 | -5.1 | 0.9 | -4.1 |
| Underemployment rate | 9.1 | 25.4 | 29.9 | 20.1 | 16.3 | 4.5 | -9.9 | 10.9 | NP | NP | NP | NP |
-
INEGI (2020b)Encuesta Telefónica de Ocupación y Empleo, 2020
As regard business size, micro and small businesses were the hardest hit group, together with large companies, while medium-sized businesses were affected to a lesser extent; although micro businesses started recovering earlier, they remained as the worst-hit group in June. In parallel with micro businesses, informal employment also started an early recovery (May); however, its catastrophic loss of jobs in April - four times as high as in formal employment - means that by June it continued showing losses well beyond those in the formal employment sector. According to income level, the highest-income workers (>5 minimum wages [MW]) not only suffered the greatest job losses in April in percentage terms, but still lost jobs in May and June, similar to the case of middle-income workers (3-5 MW), who were far less affected at the onset of the crisis (April). Meanwhile, low-income (1-3 MW) and unpaid workers, which suffered huge losses in April, started recovering in May and June, probably driven by their pressing economic need, which explains their better evolution relative to high-income workers (Table 3). In short, the recovery of jobs between April and June is led mainly by informal employment, micro and small businesses, and low-wage jobs, all of which is a clear evidence of the deterioration of the labor market.
However, the impact of the crisis is reflected not only in job losses but also in other indicators, for example, income. In this regard, the ETOE reports a marked increase in hourly income in April, contrasting with the stagnation followed by the decline in monthly income per worker. This situation is explained by the steeper drop in labor income relative to the decline in hourly income,9 added to the significant increase in temporary absences of employed workers, from 957 thousand in March to 9.5 million in April. It can be speculated that in April, workers who did work would have received their full (or nearly full) income despite having worked for fewer hours, although this situation reversed as the epidemic continued. One indicator that better reflects the situation is the dramatic de- cline in total labor income: it underwent a -34.1% fall in nominal terms, even higher than job losses in the same month (-22.3%), with a cumulative decline of almost -20% from March to June.
Finally, the underemployment rate reached historic maxima: It rose three-fold in April and remained close to 20% in June, meaning that one- fifth of employees who manage to keep their jobs were willing to work longer hours to compensate for their lower income. This need is clearly reflected in the increase in labor poverty, that is, the percentage of the population whose labor income is lower than the cost of the food basket, an indicator that also reached record levels in April, May, and June, of about 50% (CONEVAL, 2020b).
-
CONEVAL, 2020bPobreza laboral con la ETOE, 2020
SPATIAL PATTERNS OF THE FORMAL- EMPLOYMENT CRISIS
The analysis in this section is based on the employment data as recorded by IMSS (2020), considered in this work as formal employment under a criterion that is more operational than conceptual. While it is recognized that these jobs do not constitute all formal employment in Mexico, as already mentioned, they represent its “hard” and most abundant core. It is worth bearing in mind that, according to the June 2020 ETOE, IMSS-affiliated workers account for just over one-third of the total number of employed persons in the country.
-
IMSS (2020)Asegurados, 2020
A first distinctive feature relative to the data analyzed above is the earlier onset of the crisis: according to IMSS data, job losses did not start in April but in March, a fact not captured by the ETOE; 131,000 formal jobs were lost in March, although the number of formal jobs usually in- crease in this month. However, the hardest blow occurred in April, with the loss of 555 thousand jobs, a trend that continued well into May (-345 thousand jobs) to slow down in June (-83 thou- sand) and July (-4 thousand). This unprecedented loss of 1.12 million formal jobs over four months reflects the loss of formal employment created in the past two and a half years and its retreat to December 2017 levels. Nonetheless, starting in June and thanks to the economic reopening policy, some regions of Mexico showed signs of recovery. with 130 municipalities recording the creation of more than 100 jobs.
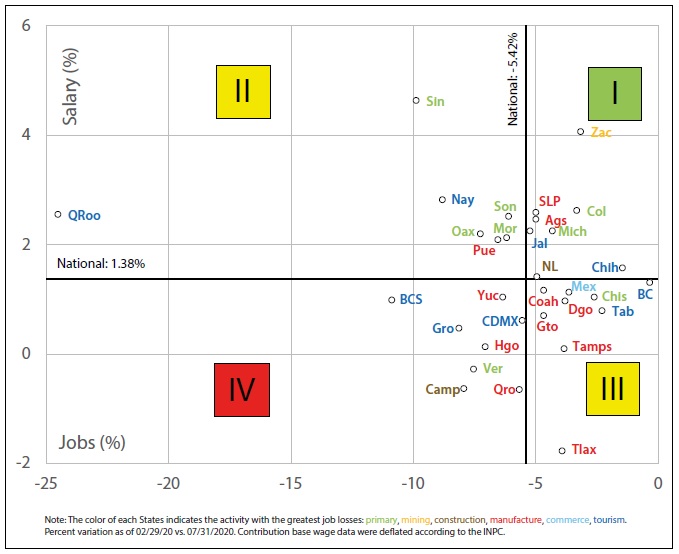
Repercussions at the State level
All the States of the country lost jobs (Figure 2), with Quintana Roo at the top, dragged by tourism (-66.5 thousand) and the construction industry (-14.0 thousand) associated with tourism. A positive sign was the apparent increase in the contribution base wage (SBC) as layoffs mainly affected low-wage jobs -- a misleading figure, given the loss of one-quarter of formal jobs. States with losses also related to tourism rank second, Baja California Sur (-10.9%), fourth, Nayarit (-8.8%), and fifth, Guerrero (-8.1%), although temporary accommodation, catering, and recreation services also played a major role in the loss of jobs in border States such as Baja California, Chihuahua, or Nuevo Leon (linked to border tourism), as well as in other States including Jalisco, Yucatán, Tabasco, and Mexico City.
Thumbnail
 Source: IMSS (2020).
Figure 2
Evolution of formal employment and contribution base wage (SBC), March-July 2020.
Evolution of formal employment and contribution base wage (SBC), March-July 2020.
Job losses were widespread in the tourism sector in all States, but primary and manufacturing activities showed an unequal evolution, depending on the entity. Ranking third in job losses was Sinaloa (-9.8%), mainly driven by primary activities, a situation that also occurred in States with farming as one of the major economic activities: Chiapas, Oaxaca, Veracruz, Michoacán, Morelos, Colima, and Sonora. However, primary activities showed a rise in the number of jobs in Guanajuato (+8.3 thousand), Puebla (+2.3 thousand), Coahuila (+2.2 thousand), and Baja California Sur (+1.5 thousand), as well as the transportation and communications sectors in the State of Mexico (+3.8 thousand) and construction in Tabasco (+1.9 thousand) under the boost of the new Pemex refinery.
This uneven development is also reflected in the manufacturing sector, with increases in some States and significant losses in others.
This is explained by the relative success of the plastic industry, chemical-pharmaceutical and electrical and electronic sectors in certain areas, contrasting with marked losses in the automotive industry. The different weight of these sectors across states and municipalities results in an uneven evolution of employment. In the so-called Bajío corridor (linked to the automotive sector) and the northeast of the country, the manufacturing sector leads the losses: Aguascalientes, Querétaro, San Luis Potosí, Guanajuato, Hidalgo, Puebla, Tlaxcala, Coahuila, Durango, and Tamaulipas. By contrast, the manufacturing industry gained jobs in northwestern States including Baja California (+12.4 thousand jobs), Sinaloa (+1.8 thousand), Sonora (+1.4 thou- sand), and Chihuahua (+1.0 thousand).
Despite this situation, the manufacturing States along the northern border and in the Bajío region better withstood the crisis, with exceptions in quadrants I and III (Figure 2), while the worst-hit States were those where tourism or primary activities prevail (quadrants II and, above all, quadrant IV). The presence of Mexico City and Queretaro in quadrant IV (barely) stands out by presenting a worse evolution than the national total in both jobs and the SBC. This situation partly reflects the differential job recovery rate in June-July: while northern-border States started their recovery earlier and more vigorously (Chihuahua, Baja California, Baja California Sur, Tamaulipas, Nuevo León, Nayarit, and also Nayarit, Zacatecas, and Tabasco), job losses continue in most States, especially in Campeche, mainly in manufacturing, trade, and transport.
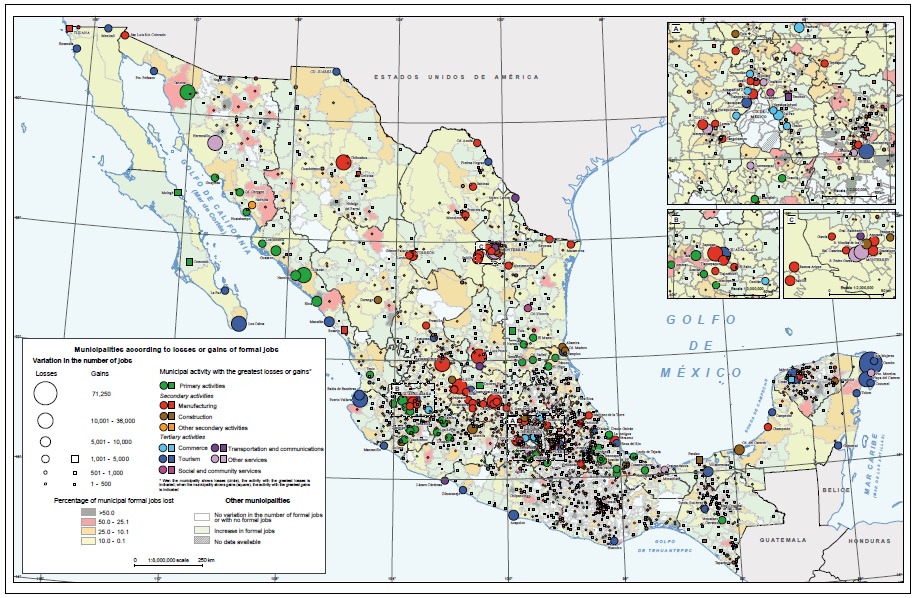
Spatial patterns at municipal level
The analysis at municipal level (Figure 3) allows confirming and adding perspective to the State dynamics outlined above. The widespread loss of employment in Mexico’s large beach resorts was led by Cancun (Benito Juarez), which, given the lack of per-alcaldía data for Mexico City, becomes the municipality with the highest job losses in the country (-71.2 thousand). It is followed far behind by Monterrey, with -34.5 thousand jobs. Almost half of the losses in Cancun are related to tourism, a situation that also impacted the rest of the Mayan Riviera (Playa del Carmen, Cozumel, Isla Mujeres, and others), thus becoming the worst-hit area of Mexico. This situation is also widespread across the Yucatan peninsula, with State capital cities (Mérida, Campeche, and Chetumal) also suffering tourism-related job losses. In the case of the Mérida metropolitan zone (MZ), the fall of jobs is evident in manufacturing and construction in addition to tourism, especially in Tixpehual, while Umán is an exception for its increase in trade-related employment.
Thumbnail
 Source: IMSS (2020).
Figure 3
Evolution of formal employment by municipality, March-July 2020. Note: There are no data by alcaldía for Mexico City, where overall losses reach up to 190 thousand jobs (5.5% of the country total), mostly in tourism services. The Tourism category includes temporary accommodation, food and beverage preparation and service, and recreational services.
Evolution of formal employment by municipality, March-July 2020. Note: There are no data by alcaldía for Mexico City, where overall losses reach up to 190 thousand jobs (5.5% of the country total), mostly in tourism services. The Tourism category includes temporary accommodation, food and beverage preparation and service, and recreational services.
Besides the Mexican Caribbean, the crisis is also widespread across the Pacific beach destinations, with the Riviera Nayarit as the second worst-affected destination (Bahía Banderas, mainly in Puerto Vallarta), and Los Cabos, which highly depends on U.S. tourism. No beach destination is saved, from Puerto Peñasco to the north to Huatulco to the south, including Mazatlan, Zihuatanejo, Acapulco, although with numerically minor losses in small-size destinations.
Accommodation and catering services are also the worst affected activities in many State capitals, from Mexico City to Merida, Tuxtla Gutiérrez, Puebla, Xalapa, Guadalajara, Guanajuato, La Paz, and Mexicali, where these services are provided to both the tourist and the local population.
After tourism (-21.7%), primary activities are most affected (-15.7%), although losses are numerically lower versus manufacturing, construction, or commerce. It is worth noting that the evolution of primary activities is driven by the seasonal nature of agriculture, particularly sugarcane harvest, rather than by the crisis triggered by the epidemic, so spatial and temporal patterns in 2020 are similar to those in 2019. Spatially, it is possible to detect four regions that concentrate the loss of jobs in agriculture:
-
The coastal areas of Sonora and Sinaloa, where Culiacan lost 18.8 thousand agricultural jobs and Caborca 12.6 thousand, followed by Navolato, Elota, and Guasave, with losses around 6-9 thousand agricultural jobs.
-
The corridor from Tepic (Nayarit) to Uruapan (Michoacán), including the center of Jalisco and northern Colima, where sugar cane and avocado are cultivated. This corridor includes the municipalities of Tala, Zapotlan El Grande and Tamazula in Jalisco; Tangancícuaro and Zamora in Michoacan; and Cuauhtémoc in Colima.
-
The southern-central sugarcane region of Veracruz (except the Veracruz MZ), from Ursulo Galván to the north to Hueyapan to the south, stretching across some municipalities of Oaxaca, which suffered losses in agricultural employment in excess of 2,500 jobs in Cosamaloapan, Tres Valles, Lerdo de Tejada, and San Juan Bautista Tuxtepec.
-
Finally, the Huasteca region, including the municipalities of Ciudad Valles (-2.6 thousand agricultural jobs), El Naranjo (-2.3 thousand), Tamasopo (-1.9 thousand), El Higo (-1.8 thousand), Pánuco (-1.3 thousand), and El Mante (-1.3 thousand), where the loss of agricultural jobs is also related to the end of the harvest period.
West of the latter region, primary activities became the main economic factor explaining the increase in formal employment in the municipalities of Tula and Ciudad del Maíz, also explaining the positive evolution of Mulegé and Comondú in Baja California Sur.
On the other hand, the fall in employment in the manufacturing industry delineates a clear corridor along the Bajío, broadly encompassing from the municipalities of Aguascalientes and San Luis Potosi, to the north, to Toluca and Lerma in the State of Mexico, and Tepeapulco and Tepeji in Hidalgo, to the south. It is a corridor dominated by the automotive sector but where losses also reached the textile, clothing. and leather and foot- wear industries. In this corridor, the greatest losses in manufacturing were recorded in Leon (-16.5 thousand), followed by Querétaro (-9.4 thousand), San Luis Potosi (-5.6 thousand), and Aguascalientes (-5.6 thousand), and in municipalities such as El Marqués, Celaya, San Francisco del Rincón, and San Juan del Rio.
Employment losses in the transportation equipment industry also explain to a large extent the negative evolution of employment along the northern border, especially in its eastern portion, although its lesser dependence on this industry led to a less negative dynamics versus El Bajío. This industry led the loss of manufacturing jobs in Matamoros, Reynosa, and the Monclova-Frontera and Sabinas areas, as well as in Satillo-Ramos Arizpe and the municipality of Chihuahua. Meanwhile, in the Torreón-Gómez Palacio-Lerdo area, job losses affected primarily the cloth-manufacturing, transportation equipment and food industries. In other areas on the northeast border such as Nuevo Laredo, Piedras Negras and Ciudad Acuna, the fall in manufacturing employment was relative minor, affecting mostly the metal-processing sector.
The evolution of employment on the northwestern border was less negative than on the eastern side. Although the loss of manufacturing employment continued in San Luis Rio Colorado, it was minimal in Tecate and Ensenada, even showing a positive balance in Mexicali and especially in Tijuana, the municipality of Mexico that ranked second in formal employment growth, after Texcoco. Tijuana recorded a collapse of the transportation equipment industry (-2.5 thousand jobs), which was largely overcompensated by the electric and electronic equipment industries (+7.6 thousand jobs).
For its part, the construction sector was initially not considered essential, being the third worst-hit in percentage terms (-12.2% of job losses) after tourism and primary activities. The evolution of employment in this sector shows a disperse pattern, showing both modest increases and decreases in formal employment in many rural municipalities. This sector also contributed to the significant fall in employment in some urban and metropolitan areas, either as the worst-hit sector (Monterrey MZ, with municipalities such as Pesquería and San Nicolás de los Garza; or State capital cities like Durango, Morelia, and Colima), or as the second- or third-most affected activity, as in the metropolitan areas of Guadalajara, Cancun, Queretaro, Tampico, Mérida, and León. Oil extraction municipalities showed a clearly negative dynamics (Tampico- Ciudad Madero-Altamira, Tula, Coatzacoalcos- Minatitlán, Salina Cruz, and Ciudad del Carmen), except for Paraíso, where the new Dos Bocas oil refinery is under construction.
The three major metropolitan zones of the country deserve special attention. These share a significant impact on tertiary activities in their core areas, namely tourism in Mexico City and the municipality of Guadalajara, and professional and technical services in the municipality of Monterrey. While the impact of the loss of manufacturing employment at the periphery of the Monterrey (Guadalupe, García, and Apodaca) and Guadalajara (Zapopan, Tlajomulco, Tlaquepaque and El Salto) MZs is noticeable, this impact is limited in the northwestern area of the Valley of Mexico (VM) MZ (municipalities of Tlanepantla, Cuautitlán Izcalli, and Tultitlán) due to its marked deindustrialization. This distinct economic structure is clearly reflected at the metropolitan level, where manufacturing is the most affected sector in the Guadalajara MZ, while the Monterrey MZ suffered the worst impact on construction, particularly in the peripheral municipalities of Pesqueria and San Nicolás de los Garza. In the VMMZ, the greatest fall was linked to tourism by the weight of Mexico City in the metropolitan total, while its periphery shows a more diverse dynamics given its large extension and complexity. The manufacturing losses in the northwestern area add to the loss of jobs in commerce in both the eastern (Chalco, Nezahualcóyotl, and La Paz) and the western (Tepozotlán, Huixquilucan, and Atizapán de Zaragoza) peripheral areas. In turn, the dynamics at the northeastern periphery appear to be linked to services, which on the one hand boosted the losses in Coacalco (professional and technical services) and Ecatepec (education), and on the other, the profits of Texcoco (communications), which became the municipality with the greatest increase in formal employment in the country.
In summary, job losses are widespread in most municipalities of Mexico, beyond the minimal increases or decreases that characterize small rural municipalities. There are certainly some exceptions, but they are rare: Texcoco (promoted by communications), Tijuana (electrical and electronic equipment), Paraíso (construction), Dolores Hidalgo (agriculture), Rosario (food industry), Umán (commerce), Mulegé-Comondú (agriculture) and Tula-Ciudad del Maíz (agriculture). Only 23 municipalities showed an increase of more than 500 jobs (from 500 to 2.6 thousand), contrasting with 229 municipalities that lost more than 500 jobs (from 500 to even 30 thousand); the latter include the cases of Monterrey (-35.8 thousand) and, above all, Cancún (71.2 thousand), which lost almost one-quarter of formal jobs.
CONCLUSIONS
The present research work evidences the huge impact of the health and economic crises on the Mexican labor market, revealing major differences at both the territorial and sectoral levels. This lays the foundations to support recovery policies, which should be adapted to specific territories and sectors. This recovery will largely depend on the remission of the epidemic, and thus on the evolution of demand given the depth of the crisis.
Tourism is the hardest-hit sector, and will probably experience a slow recovery given its close dependence on the evolution of the epidemic, both in the destinations as in the areas of tourist departure, with possible restrictions on travel, quarantine enforcement upon returning from these trips, or fear of contagion by tourists. In relation to the latter, the potential aversion of tourists toward mass destinations perceived as highly unsafe emerges both as a risk and as an opportunity: a risk for the crowded sun-and-beach tourist model typical of Mexico; and an opportunity to boost less crowded and more sustainable alternative destinations generally based on inland, rural, nature, and cultural tourism, but away from large cities, for example, the so-called Pueblos Màgicos (Magic Villages) or protected natural areas.
On the other hand, in times of crisis the tourism sector has traditionally been sustained or recovered through domestic tourism, a situation that will certainly become more acute under the current circumstances, as long as restrictions on international mobility are maintained. For this reason, areas such as Los Cabos and especially the Riviera Maya (especially Cancun and Playa del Carmen), which strongly depend on international tourism, may be destinations with a slower recovery, while tourism in large cities (Mexico City, Guadalajara, Puebla) or even some less crowded or beach destinations that are less dependent of international tourism (Ixatapa-Zihuatanejo, Mazatlan, or even Acapulco) may experience a faster recovery. This will depend on whether the epidemic leads to a long-lasting shift in tourist preferences, as well as in promotion strategies to be implemented by tourist destinations themselves - an aspect in which large tourism centers have evident advantages over smaller alternative destinations.
The regions with economic and labor dynamics driven by manufacturing (Bajío and north border) have suffered a lesser impact, and their recovery will be linked to the evolution in the United States - the primary target for the vast majority of the automotive and contract-manufacturing production. In this sense, it is reasonable to state that that dependence on international commerce is even higher than on tourism, especially for certain branches and industrial areas, which have options for a faster recovery compared to tourism.
In other sectors and regions of Mexico, the recovery will depend on the local demand, as in the case of construction in large metropolitan areas (Valle de México, Guadalajara, Monterrey, Puebla-Tlaxcala, Toluca, and others), State capital cities and large cities in general. Exceptions are those locations where construction is linked to tourism or the oil industry (Riviera Maya, Riviera Nayarit, Acapulco or Ciudad del Carmen and Altamira-Tampico-Ciudad Madero), in which case the recovery will depend on these other sectors. Factors in favor include the reduction of interest rates and, therefore, the cost of mortgages; factors against are the contraction of employment and wages.
Indeed, the policies adopted in Mexico in the face of the crisis have been different: contras- ting with the temporary job-protection policies through subsidies that have been applied in many countries, Mexico has opted to maintain its social programs and extend targeted credits to small businesses, which are frequently informal. This can temporarily mitigate the impact of the crisis and sustain the purchasing power of its beneficiaries. This, in turn, would sustain consumption, which may boost recovery; however, the decline in VAT challenges this benefit, as this is an indicator of the evolution of demand. Above all, it remains to be seen whether these micro-credits lead to the creation of stable jobs, given the general short-term permanence of micro-enterprises; and whether the policies implemented are sustainable in the face of the very likely reduction in the federal government income and budget.
In summary, the current situation appears challenging, as evidenced by the declining labor market, falling wages, potential rise in informality, and the persisting high underemployment.
REFERENCIAS
- Bell, D. N. F y Blanchflower, D. G. (2020). US and UK labour markets before and during the COVID-19 crash. National Institute Economic Review, 252, 52-68. Links
- CEPAL. (2010). Evaluación preliminar del impacto en México de la influenza AH1N1, LC/MEX/L.958. Recuperado de https://repositorio.cepal.org/bitstream/handle/11362/25901/1/LCmexL958_es.pdf Links
- CEPAL-OPS. (2020). Salud y economía: una convergencia necesaria para enfrentar el COVID-19 y retomar la senda hacia el desarrollo sostenible en América Latina y el Caribe. Recuperado de https://www.cepal.org/es/publicaciones/45840-salud-economia-convergencia-necesaria-enfrentar-covid-19-retomar-la-senda Links
- Cereda, F., Rubiao, R. M. y Sousa, L. D. (2020). COVID-19, labor market shocks, and poverty in Brazil: a microsimulation analysis. Recuperado de https://openknowledge.worldbank.org/hand-le/10986/34372 Links
- CONEVAL. (2020a). La política social en el contexto de la pandemia por el virus SARS-CoV2 (COVID-19) en México. Recuperado de https://www.coneval.org.mx/Evaluacion/IEPSM/Documents/Politica_Social_COVID-19.pdf Links
- CONEVAL. (2020b). Pobreza laboral con la ETOE. Recuperado de https://www.coneval.org.mx/Medicion/Paginas/Pobreza_Laboral_ETOE.aspx Links
- FMI. (2020). Database of fiscal policy responses to CO- VID19. June 2020. Recuperado de https://www.imf.org/en/Topics/imf-and-covid19/Fiscal-Policies-Database-in-Response-to-COVID-19 Links
- IMSS. (2020). Asegurados. Recuperado de http://datos. imss.gob.mx/group/asegurados Links
- INEGI. (2020a). Banco de Información Económica. Cuentas Nacionales. Recuperado de https://www.inegi.org.mx/sistemas/bie/ Links
- INEGI. (2020b). Encuesta Telefónica de Ocupación y Empleo. Recuperado de https://www.inegi.org.mx/investigacion/etoe/ Links
- Lemieux, T., Milligan, K., Schirle, T. y Skuterud, M. (2020). Initial Impacts of the COVID-19 Pandemic on the Canadian Labour Market. Canadian Public Policy, 46(1), 55-65. Links
- OECD. (2020a). OECD Statistics. Recuperado de https://stats.oeCiudadorg Links
- OECD. (2020b). Supporting people and companies to deal with the COVID-19 virus: options for an inmediate employment and social-policy response. 20 March 2020. Policy table (updated 24 July 2020). Recuperado de https://oeCiudaddam-broadcast.com/pm_7379_119_119686-962r78x4do.pdf Links
- OECD. (2020c). Employment Outlook 2020. Worker security and the COVID-19 crisis. Recuperado de https://www.oecd-ilibrary.org/docserver/1686c758-en.pdf Links
- Oehmichen-Bazán, C. y París, M. D. (2010). El miedo ante el riesgo global: apuntes sobre la emergencia sanitaria del virus A/H1N1 y el turismo, Nuevas Tendencias en Antropología, 1, 161-185. Links
- SCT. (2020). Estadística operacional de aerolíneas. Estadística operacional por origen-destino. Recuperado de http://www.sct.gob.mx/transporte-y-medicina-preventiva/aeronautica-civil/5-estadisticas/53- estadistica-operacional-de-aerolineas-traffic-statistics-by-airline/ Links
- Secretaría de Salud. (2009). Situación actual de la epidemia. 20/10/2009. Recuperado de http://www.salud.gob.mx/unidades/dgcs/sala_noticias/galeria/situacion20102009.pps Links
- SECTUR. (2020). Reporte monitoreo hotelero, abril 2020. Recuperado de https://www.datatur.sectur.gob.mx/SitePages/ActividadHotelera.aspx Links
- Uren, D. (2020). The unequal burden of the COVID-19 labour market collapse. Recuperado de: https://www.ussc.edu.au/analysis/the-unequal-burden-of-the- covid-19-labour-market-collapse Links
- Vargas-Palacios, A. (2017). An Economic Evaluation of the A(H1N1) Flu Vaccine in Mexico. Tesis de Doctorado en Filosofía, Facultad de Medicina, Universidad de Sheffield. Links
- Weller, J. (2020). La pandemia del COVID-19 y su efecto en las tendencias de los mercados laborales. Documentos de Proyectos, LC/TS.2020/67. Santiago: CEPAL. Links
- Weller, J., Gómez, M., Martín, A. y Ravest, J. (2020). El impacto de la crisis sanitaria del COVID-19 en los mercados laborales latinoamericanos, Documentos de Proyectos, LC/TS.2020/90. Santiago: CEPAL . Links