nueva página del texto (beta)
 Inglés (pdf)
 Artículo en XML
 Referencias del artículo
 Enviar artículo por email
 Citado por SciELO
  Similares en
SciELO
Similares en
SciELO 
 Permalink
1. Introduction
The World Health Organization (WHO, 2024) identifies air pollution as a significant environmental health risk. Particulate matter, specifically PM10 (aerodynamic diameter ≤ 10 μm) and PM2.5 (≤ 2.5 μm), is a critical pollutant due to its ability to penetrate the respiratory system, leading to adverse pulmonary and cardiovascular effects (Polichetti et al, 2009; Lelieveld et al., 2015). PM has also been shown to reduce visibility, and to adversely affect climate, ecosystems, and materials (Grantz et al., 2003; Chen et al., 2021; Broomandi et al., 2022; Rodrigues et al., 2024).
Numerous studies have shown that PM concentrations exhibit high spatial and temporal variability, influenced by anthropogenic emissions, meteorological conditions, topographic factors, and natural processes such as dust resuspension and long-range aerosol transport (Liu et al., 2009; Arkouli et al., 2010; Wang et al., 2015; Galindo et al., 2017; Li et al., 2017; Dimitriou and Kassomenos, 2018; Bahino et al., 2024; da Silveira et al. 2024). Although this variability has been extensively documented in diverse geographical contexts, recent studies in Latin America have provided region-specific insights, particularly regarding the influence of seasonal transitions and urban dynamics. For example, in Campinas, Brazil, Bahino et al. (2024) demonstrated that PM concentrations are influenced by seasonal factors, vehicular and industrial emissions, and wind direction. Similarly, Arkouli et al. (2010) reported higher PM2.5 levels during winter in Buenos Aires, with daily peaks linked to traffic emissions. Their findings also underscored the influence of local meteorological conditions on the behavior of airborne PM.
In the Caribbean context, PM variability arises from a complex interplay between local anthropogenic sources, long-range atmospheric transport, and meteorological factors characteristic of tropical climates. Jury (2017) characterized regional atmospheric chemistry and emphasized the regulatory roles of trade winds, thermal inversion, and relative humidity in either the accumulation or dispersion of PM. Notably, Saharan dust has been identified as a major contributor during the boreal summer, when transatlantic atmospheric flows intensify. These processes, which are sporadic and show a significant interannual variability (Raga et al., 2021), have been empirically documented with precision. For example, Cadelis et al. (2014) observed increases in PM10 and PM2.5 levels in Guadeloupe during Saharan dust intrusions, associated with high silica and alumina content, further enhanced by atmospheric stability and persistent trade winds. Morera-Gómez et al. (2018) reported a greater mineral contribution during the summer along Cuba’s Caribbean coast, with markers such as Al, Si, and Ca characteristic of Saharan dust. In the Yucatán Peninsula, Ramírez-Romero et al. (2021) and Rosas et al. (2025) identified dominant mineral components, such as iron and calcium, in PM2.5 and PM10, linked to Saharan intrusion events intensified by meteorological systems, such as tropical waves and cyclones. In this region, PM10 and PM2.5 concentrations up to 500 and 300% higher than background levels were observed during Saharan dust episodes (Ramírez-Romero et al., 2021). These findings align with those of Prospero et al. (2020), who argue that Saharan dust not only affects air quality in the Caribbean but also contributes to intercontinental biogeochemical processes, including the fertilization of the Amazon Basin through phosphorus deposition.
In Puerto Rico, Plocoste et al. (2023, 2024) applied multifractal analysis to reveal persistent and correlated patterns in PM2.5 and PM10 levels, reflecting the interaction between natural (Saharan dust) and local (vehicular and industrial) sources. Their study also highlighted marked seasonality, with concentration peaks from May to August corresponding to periods of transatlantic dust transport.
In continental Caribbean urban areas, the influence of local sources is particularly evident. Duarte et al. (2022) documented high spatial variability in PM concentrations in Barranquilla, Colombia, with higher levels recorded in the city’s southern areas. These patterns were attributed to the convergence of vehicular emissions, biomass burning (BB) in peri-urban zones, and the arrival of air masses from the Sahara Desert, all modulated by meteorological variables such as wind speed and temperature. Likewise, Bolaño-Truyol et al. (2022) analyzed the impact of BB events that occurred between February and March 2018 in municipalities surrounding Barranquilla. Using HYSPLIT modeling and satellite data, they established a direct link between these events and sustained increases in PM2.5 concentrations. Their analysis highlights the significant role of anthropogenic sources in the occurrence of pollution episodes, particularly in coastal areas where multiple emission sources converge.
It is important to mention that, although mineral dust coming from the Sahara Desert represents a significant source of PM in the Caribbean region and is often associated with peak PM10 concentrations (Plocoste et al., 2022; Rosas et al., 2025), Caribbean aerosols are mainly of marine origin (Rodríguez-Vega et al., 2022). In fact, in coastal areas, marine aerosols are always present and predominate on ~ 70% of the days in a year, with a higher frequency during the dry season (Rodríguez-Vega et al., 2022). Marine aerosol production largely depends on the wind; therefore, sea salt concentration increases with increasing wind speed (Dasarathy et al., 2023). Both dust and sea-salt aerosols are mainly distributed in the coarse fraction and present a more limited influence on PM2.5 concentrations (Nicolás et al., 2009; Dimitriou and Kassomenos, 2018; Rodríguez-Vega et al., 2022).
Collectively, scientific evidence indicates that PM variability in the Caribbean results from the combined influence of marine aerosols, intercontinental sources (such as Saharan dust) and local anthropogenic emissions within a dynamic atmospheric system, whose impacts vary depending on seasonal and geographic factors (Silva et al., 2022; Euphrasie-Clotilde et al., 2025).
In the Dominican Republic, studies on air quality and particularly on the temporal behavior of PM10 and PM2.5 concentrations remain limited, hindering the development of effective public policies grounded in scientific evidence. In fact, to the best of our knowledge, the study by Orgaz-Agüera et al. (2022) is the only scientific investigation to have examined PM dynamics in Puerto Plata, Dominican Republic. This work identified traffic and airport operations as notable contributors to PM variability along the tourist coastline of Puerto Plata. While air quality was generally rated as “good”, spatial variations linked to anthropogenic activity were evident, underscoring the need for expanded monitoring and deeper investigation into the city’s particulate pollution dynamics.
Puerto Plata, a coastal city characterized by a humid tropical climate with pronounced rainfall seasonality and a strong tourism-driven economy, has experienced significant urban and economic growth over the past decade, which may be influencing its air pollution levels. However, there remains a lack of robust research on the temporal evolution of PM concentrations in this context. This research gap limits understanding of the impact that seasonal, climatic, and anthropogenic factors have on local air quality. To address this gap, the present study aims to analyze the temporal variability of PM10 and PM2.5 concentrations in Puerto Plata during the period 2020-2024. The analysis is based on data from the monitoring network established by the World Air Quality Index Project team (AIQCN, 2025). The goal is to provide empirical evidence to improve understanding of the sources and dynamics of PM in a largely understudied Caribbean context and to contribute to the design of sustainable air quality management strategies.
2. Materials and methods
2.1 Description of Puerto Plata, Dominican Republic
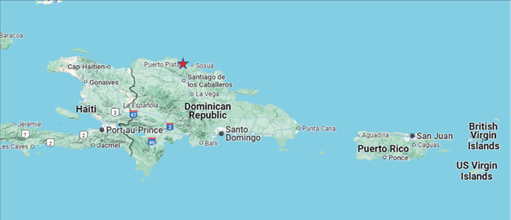
Puerto Plata is a coastal city located in the north of the Dominican Republic (Fig. 1) and is recognized for its historical, cultural, touristic, and industrial significance (Duffy et al., 2015). Its strategic geographic location, situated between the Atlantic Ocean and the Northern Mountain Range (Cordillera Septentrional), defines many of its environmental and socioeconomic characteristics.
Puerto Plata lies within a humid tropical climate zone, influenced by both the Atlantic Ocean and the topography of the Northern Mountain Range. Temperatures range from 22 to 32 ºC throughout the year, with an annual average of approximately 27 ºC (WC, 2025). The annual accumulated precipitation ranges from 1200 to 1500 mm, with the highest rainfall occurring between May and November, peaking from September to November due to the influence of tropical systems. In contrast, June, July, and February consistently exhibit the lowest monthly totals (WC, 2025). Relative humidity remains high, between 80 and 85%, with a slight tendency to increase during the early morning hours (Meteoblue, 2025). The dominant wind direction is east-southeast, with higher wind speeds during summer months (Meteoblue, 2025).
The city has a population of about 162 000 inhabitants, distributed across an area of approximately 500 km², resulting in a population density of 322 inhabitants km-2. Tourism and port-related activities are the city’s main economic sectors (Duffy et al., 2015; WB, 2023). Ship emissions have the potential to degrade coastal air quality and contribute to global atmospheric pollution (Toscano, 2023). The Amber Cove Cruise Port is a key driver of the local economy. Between 2022 and 2024, this port received approximately three million cruise passengers. Additionally, Taino Bay, another cruise port inaugurated in 2021, received around two million visitors (MT, 2025). Within the context of maritime tourism in the Dominican Republic, Puerto Plata has emerged as a strategic hub for international arrivals.
Puerto Plata hosts a thermal power plant, a facility classically recognized as a major point source of atmospheric contaminants. Thermal power plants release not only primary metal-rich particulates but also important amounts of gaseous precursors (mostly SO2 and NOₓ) that undergo atmospheric transformation to form secondary PM, thereby amplifying the local aerosol burden (Hannun and Abdul, 2022).
2.2 Sampling site
The monitoring station is located on Guayacanes Street (19º 48’ 212 N, 70º 42’ 14” W), close to the Atlantic Ocean (Fig. 2), and near several potential sources of air pollutants: the Puerto Plata Port, 723 m southeast; the San Felipe Power Plant, 380 m southwest; the heliport, 473 m southwest; and the Industrial Free Zone, 2057 m southwest of the sampling site.
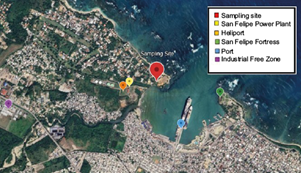
Guayacanes Street is located in an urban area characterized by mixed land use. Its surroundings include single-family and multi-family middle-class residences, small businesses (grocery stores, pharmacies, auto repair shops, and cafés), and educational and community centers. It is a low-traffic route used primarily by residents.
2.3 PM 2.5 and PM 10 data
Primary data were obtained from the monitoring network established by the AIQCN team (AIQCN, 2025), a global platform that provides real-time air quality data from more than 500 000 stations worldwide. More information on the AQICN platform is provided in the supplementary material. It is important to note that the platform does not provide average concentrations but instead reports minimum, maximum, median, Q1, and Q3 values on a daily basis. To estimate daily mean PM10 and PM2.5 concentrations, the equation proposed by Hozo et al. (2005) was used, which allows estimation of the average value (X̅) using the median (m) and the minimum and maximum PM10 and PM2.5 data measured each day (a and b, respectively).
For data collection and storage, a structured database was employed, and data cleaning filters were applied to remove outliers and correct potential instrumental errors, thereby ensuring the validity and accuracy of the data used. To identify and remove extreme outliers, boxplot visualizations based on the Tukey method (Tukey, 1977) were used. According to this technique, the upper cut-off level for the outliers was calculated as Q3 + 1.5 × IQR, where Q3 is the third quartile and IQR is the interquartile range. The boxplots were generated using Excel, which applies this criterion by default. Outliers were detected in 15 cases for PM10 and eight cases for PM2.5 (< 1%). Data were validated by comparison of PM10 concentrations with measurements from gravimetric samplers (supplementary material).
2.4. Statistical analysis
Statistical treatment of PM data was carried out using the SPSS v. 30 software. Nonparametric methods were used to evaluate the differences between periods (Mann-Whitney) and the correlation between PM fractions (Spearman), to obtain statistically significant differences at a confidence level of 95% (p < 0.05).
3. Results and discussion
3.1 Average PM concentrations
As summarized in Table I, the average concentrations of PM2.5 and PM10 in Puerto Plata during the period 2020-2024 were 8.8 and 35.0 µg m-3, respectively. These values, although in the lower range of those reported in other Caribbean urban centers where PM10 levels typically range between 30 and 60 µg m-3 (Duarte et al., 2022; Gómez-Plata et al., 2022; Arregocés et al., 2023; Plocoste et al., 2024), consistently exceeded the WHO annual guidelines of 5 µg m-3 for PM2.5 and 15 µg m-3 for PM10. In Puerto Plata, annual PM2.5 concentrations fluctuated within a narrow range of 8.3-9.7 µg m-3, while PM10 levels varied moderately between 34.2 and 36.0 µg m-3 throughout the study period. This persistent exceedance of international air quality thresholds, coupled with the limited interannual variability, underscores the chronic nature of exposure and the potential for cumulative public health impacts in the region. Relatively low interannual variations in PM2.5 and/or PM10 levels have been previously reported at other insular areas of Europe and the Caribbean (Marconi et al., 2014; Plocoste et al., 2023).
Table I Average levels (µg m-3) of PM2.5 and PM10 in Puerto Plata from 2020 to 2024.
| PM2.5 | PM10 | |||||||
| Mean | SD | Min | Max | Mean | SD | Min | Max | |
| 2020 | 8.7 | 5.2 | 3.0 | 53.4 | 35.8 | 18.0 | 10.4 | 166.4 |
| 2021 | 8.3 | 4.8 | 3.3 | 47.8 | 34.5 | 15.7 | 12.8 | 122.1 |
| 2022 | 8.3 | 5.1 | 3.1 | 42.8 | 36.0 | 16.4 | 11.0 | 135.0 |
| 2023 | 9.7 | 5.8 | 3.4 | 53.2 | 34.2 | 15.1 | 10.7 | 111.4 |
| 2024 | 9.0 | 5.1 | 3.1 | 51.6 | 34.3 | 16.7 | 11.7 | 123.8 |
| Global | 8.8 | 5.1 | 3.0 | 53.4 | 35.0 | 16.4 | 10.4 | 166.4 |
| Weedays | 8.6 | 4.8 | 3.0 | 53.4 | 34.7 | 16.6 | 10.4 | 166.4 |
| Weekends | 9.2 | 5.8 | 3.1 | 53.2 | 35.5 | 16.0 | 11.2 | 114.8 |
SD: standard deviation.
To further explore short-term variability, weekday and weekend concentrations were compared. PM2.5 levels averaged 8.6 µg m-3 on weekdays and 9.2 µg m-3 on weekends, while PM10 concentrations were 34.7 and 35.5 µg/m3, respectively. In both cases, Welch’s t-test yielded non-significant p-values (0.17 for PM2,5 and 0.56 for PM10). The absence of a weekly cycle may be due to a limited impact of anthropogenic activities on PM levels at the study site (Adame et al., 2014; Proias et al., 2017) or to weekday activity cycles, such as commuter traffic, being counteracted by weekend tourism.
3.2 Temporal variations in PM concentrations
3.2.1 Daily PM concentrations
Figure 3 shows the time series of daily PM2.5 and PM10 concentrations during the study period. The red horizontal lines represent the 24-h WHO air quality guidelines for PM2.5 (15 µg m-3) and PM10 (45 µg m-3), respectively.
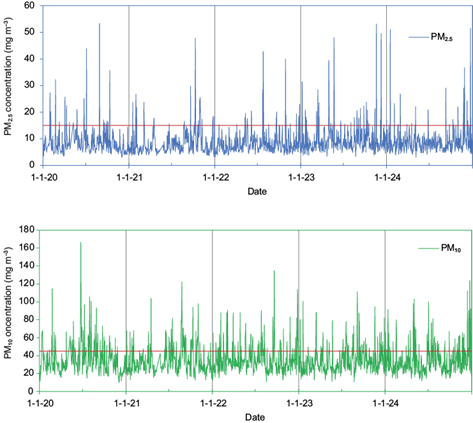
Fig. 3 Daily variation of PM2.5 (top panel) and PM10 (bottom panel) concentrations in Puerto Plata (2020-2024). The red lines represent the 2021 24-h WHO air quality guidelines.
Daily PM2.5 and PM10 concentrations in Puerto Plata from 2020 to 2024 exhibited a variability characterized by relatively stable background levels interspersed with sharp episodic peaks. PM2.5 values most frequently ranged between 5 and 10 µg m-3; however, concentrations up to ~ 50 µg m-3 were occasionally reached, clearly surpassing the WHO 24-hour guideline of 15 µg m-3. Conversely, the lowest values likely corresponded to days influenced by precipitation or strong atmospheric circulation, which could enhance aerosol dispersion or removal. A similar pattern was observed for PM10: background levels ranged from 20 to 35 µg m3, with frequent exceedances of the WHO threshold and peak concentrations near 170 µg m-3, occasionally coinciding with PM2.5 maximum values. Some of these elevated concentrations occurred during late spring and summer months, suggesting that Saharan dust intrusions could be a contributing factor. In fact, 24-h mean PM10 concentrations ranging from 80 to 166 µg m-3 were measured between 22 and 25 June, 2020, during an intense Saharan dust outbreak in the Caribbean region, the so called Godzilla dust event, a phenomenon well-documented in the literature (Rojano et al., 2021; Bolaño-Ortiz et al., 2023; Morales-Medina et al., 2024; Mayol-Bracero et al., 2025). The lowest PM10 levels, sometimes falling below 15 µg m-3, may reflect the influence of rainy or windy conditions.
The dominance of coarse particles of natural origin, not only Saharan dust, which is an episodic source, but also fresh sea-salt aerosols peaking in the coarse size range (Feng et al., 2017; Navarro-Selma et al., 2022), may help explain the relatively weak association observed between PM10 and PM2.5 levels in the study area. A moderate correlation between daily PM10 and PM2.5 concentrations was found (ρ = 0.61, p < 0.05), indicating that they generally originate from different sources and/or that transport, dispersion, and removal patterns differ significantly between both pollutants. In fact, previous studies have reported a different influence of meteorological factors on PM2.5 and PM10 concentrations (Munir et al., 2017; Cholakian et al., 2019; Nicolás et al., 2020; Plocoste et al., 2024). Correlations between PM10 and PM2.5 levels tend to increase with higher PM2.5/PM10 ratios (Coskuner et al., 2018). Therefore, the weak correlation between PM10 and PM2.5 is consistent with the low PM2.5/PM10 ratio observed in Puerto Plata (0.27 over the whole period).
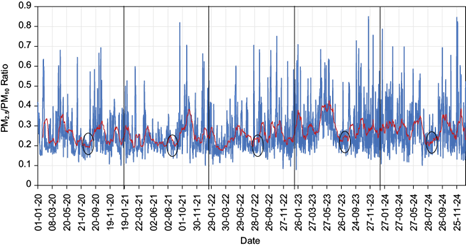
To assess the presence of a seasonal cycle, daily average PM2.5/PM10 ratios were calculated for the entire study period (Fig. 4). The lowest values during 2020-2024 were observed in July (black circles in Fig. 4), with an average ratio of 0.22. This pattern coincides with the peak frequency of Saharan dust outbreaks over the Caribbean Basin. Xu-Yang et al. (2022) reported a pronounced seasonality in Saharan dust deposition, with maximum fluxes occurring between June and July. These findings align with previous studies across the Caribbean region, which have similarly found a reduction in the PM2.5/PM10 ratio during the boreal summer due to the dominance of mineral dust (Euphrasie-Clotilde et al., 2020; Plocoste and Sankaran, 2023).
3.2.2 PM exceedances
The WHO-recommended PM2.5 limit was exceeded on 130 days during the measurement period, while the PM10 limit was exceeded 334 times. This implies that people in Puerto Plata were exposed to PM10 concentrations above the 2021 WHO guideline value on 19% of the days during the study period, with an average of 67 days per year. For PM2.5, fewer than 7% of the days in the study period had concentrations above the WHO limit value. These results indicate that the citizens of Puerto Plata are regularly exposed to PM concentrations above safe levels, especially for PM10.
Figure 5 (left) shows average PM levels for those days exceeding the WHO recommendations. Average PM2.5 concentrations on these days showed a larger increase relative to the global average value than PM10 levels. Thus, the mean value for PM2.5 on exceedance days was 20 µg m-3, more than 2.5 times the average concentration for the whole period (9 µg m-3). On the other hand, the average PM10 concentration during exceedance days was 62 µg m-3, which is less than double the global mean of 35 µg m-3.
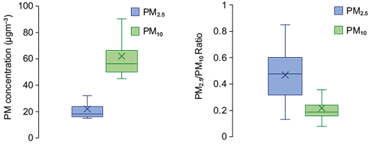
Fig. 5 (Left) PM average concentrations for days exceeding the WHO recommended values. (Right) PM2.5/PM10 ratios for the same days. Boxes represent interquartile ranges (IQRs), horizontal lines indicate medians, and X symbols denote mean values. Whiskers extend to values within 1.5 times the IQR from Q1 and Q3.
During days exceeding the WHO threshold for PM2.5, the average PM2.5/PM10 ratio was notably higher than the global average value of 0.27 (Fig. 5, right), while the mean ratio on PM10 exceedance days was only 0.22. These results suggest that, in general, a simultaneous and proportional increase in fine and coarse particle levels does not occur, indicating different sources and/or formation mechanisms.
3.2.3 Monthly average PM concentrations
Monthly mean concentrations of PM2.5 and PM10 in Puerto Plata during the study period are shown in Figure 6. For PM2.5, monthly median values showed limited variability, ranging from 6 to 9 µg m-3. This suggests a steady influence of local combustion-related sources (Zavala et al., 2013). Previous studies performed in other urban areas of the Caribbean basin have also reported a smooth seasonal variation in PM2.5 concentrations (Duarte et al. 2022; Plocoste et al. 2024). In contrast, PM10 exhibited a more pronounced seasonal variability. Monthly medians varied between 26 and 38 µg m-3, with peak values observed typically between June and September, in line with previous works performed in the Caribbean basin (Duarte et al. 2022; Plocoste et al. 2024). Average PM10 concentrations remained relatively stable between January and April (ranging from 31.5 to 33.8 µg m-3), followed by a sustained increase beginning in May. The highest monthly averages were observed in July (42.0 µg m-3) and August (36.8 µg m-3), with elevated levels extending to September, before gradually declining between October and December. The differences between the highest and lowest monthly average concentrations were statistically significant for both fractions.
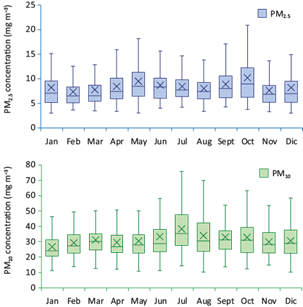
The observed monthly variability aligns with the seasonal dust transport to the Caribbean basin, consistently documented in the literature. Multiple climatological and observational studies have established that the high-dust season spans from May to September, coinciding with the period of maximum transatlantic Saharan dust transport (Prospero and Mayol-Bracero, 2013; Prospero et al., 2014, 2020; Valle-Díaz et al., 2016; Velasco-Merino et al., 2018; Euphrasie-Clotilde et al., 2020). The seasonal profile shown in Figure 6 also reveals broader interquartile ranges during July and August, indicative of episodic but intense dust outbreaks.
Overall, the data reveal that PM10 concentrations are typically higher between June and September, coinciding with the boreal summer, characterized by reduced precipitation and a higher frequency of long-range dust transport from the Sahara Desert (Prospero et al., 2014; Gutleben et al., 2022). In contrast, the lowest PM10 levels are generally recorded during the rainy season, from November to February. This can be explained by the fact that coarse particles are more easily removed by rain than fine particles (Andronache, 2003; Nicolás et al., 2020).
3.3 PM 2.5 / PM 10 ratio
Daily PM2.5/PM10 ratios in Puerto Plata from January 2020 to December 2024, classified according to the dominant aerosol type, are presented in Figure 7. The average ratio throughout the study period was 0.27, indicating a clear predominance of coarse PM. This value is very low compared with those usually found in other cities worldwide (> 0.5), where the contribution of anthropogenic sources to fine PM levels is much higher (Munir, 2017; Fan et al., 2021; Colangeli et al., 2022; Bamola et al., 2024; Santos et al. 2025), but similar to the ratio obtained at other Caribbean urban areas (Silva et al., 2022; Plocoste et al., 2024). However, episodic increases in the relative contribution of fine particles were also observed at the study site. The time series of the PM2.5/PM10 ratio exhibits substantial day-to-day variability, ranging from below 0.2 to above 0.6. To interpret the origin and typology of PM, we adopted the air pollution classification method proposed by Fan et al. (2021). The classification was based on the probability distribution function (PDF) of PM2.5/PM10 ratios, along with skewness and kurtosis, which are statistical measures of a probability distribution’s shape. According to this approach, ratios ≥ 0.6 indicate anthropogenic pollution, typically driven by fine particles from combustion processes, traffic emissions, and industrial activities. Ratios between 0.4 and 0.6 are classified as mixed pollution, reflecting the combined influence of fine and coarse particles. Values below 0.4 are attributed to the dust pollution type, which is predominantly influenced by coarse particles from natural sources such as desert dust, soil resuspension, and sea spray.
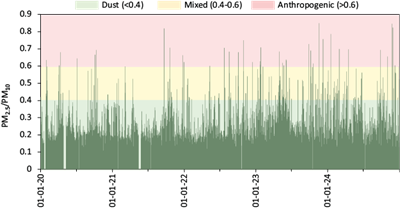
Fig. 7 Daily PM2.5/PM10 ratios in Puerto Plata (2020-2024). Background colors represent pollution type classifications according to Fan et al. (2021): dust (< 0.4, green), mixed (0.4-0.6, yellow), and anthropogenic (≥ 0.6, red).
Based on this classification, the data revealed that 88.6% of the observations fell within the dust-related pollution (PM2.5/PM10 < 0.4). This low ratio is widely associated with natural and mechanically generated aerosols, including resuspended soil dust and particularly Saharan dust intrusions, which have been extensively documented as important contributors to the Caribbean’s atmospheric load (Prospero et al., 2014; Urrutia-Pereira et al., 2021; Plocoste et al., 2023; Rosas et al., 2025), as already commented. In coastal and tropical regions, such as Puerto Plata, particles of marine origin often prevail due to close proximity to the sea, which is a stable source of aerosols throughout the year (Xu-Yang et al., 2022). This source typically shows a PM2.5/PM10 ratio below 0.3 (Ma et al., 2022). A strong influence of marine aerosols has also been found at other Caribbean locations (Valle-Díaz et al., 2016; Rodríguez-Vega et al., 2022; Silva et al., 2022; Ortega-Camacho et al., 2024).
Days classified as mixed (0.4 ≤ PM2.5/PM10 < 0.6) represented 9.1% of the days in the study period, which typically reflect mixed-source scenarios, where both coarse and fine particles contribute appreciably to total PM load. This pattern is commonly observed in urbanizing coastal zones, where background natural sources are combined with moderate anthropogenic emissions from traffic, tourism-related activities, and localized BB (Fan et al., 2021).
Finally, only 2.3% were attributed to the anthropogenic category (PM2.5/PM10 ≥ 0.6), indicating a dominance of fine PM. This fine-particle predominance is often linked to combustion processes (vehicular traffic, industrial activity, BB), secondary inorganic and organic aerosol formation, or long-range transport of fine particles from continental or regional urban centers (Barmpadimos et al., 2011; Jiménez, 2016). The most pronounced PM2.5 peak in Puerto Plata was recorded on November 19, 2023, coinciding with the ADN Bachata World Festival. This event involved intense fireworks displays, which are well-documented sources of fine PM emissions (Nicolás et al., 2009). Similarly, high PM2.5 concentrations were observed between December and February during the study period, a timeframe characterized by increased maritime tourism (https://tourismanalytics.com/dominicanrepublic-statistics.html) and widespread use of pyrotechnics during end-of-year celebrations. These peaks were likely amplified by adverse meteorological conditions typical of this season, such as weak wind regimes and atmospheric stability, which promote near-surface accumulation of pollutants. Although the frequency of these episodes was very limited, their potential health implications can be more severe, given PM2.5’s ability to penetrate deep into the alveolar region of the lungs and enter systemic circulation (Pope and Dockery, 2006; WHO, 2021).
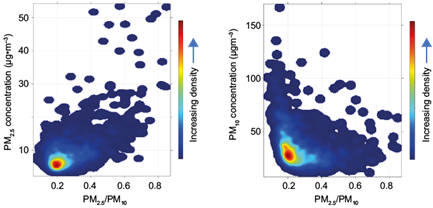
As shown in Figure 8, most days during the study period showed PM2.5/PM10 ratios around 0.2. In general, this coincided with PM2.5 concentrations below 10 µg m-3 and PM10 levels ranging from approximately 20 to 35 µg m-3. In Figure 8 (right panel), it can be observed that some days with low average PM2.5/PM10 ratios had daily PM10 concentrations more than twice the global average, likely due to Saharan dust events. In fact, the highest PM10 concentrations and the lowest PM2.5/PM10 ratios (0.17) were recorded during the Godzilla event.
4. Conclusions
This five-year study represents the first comprehensive temporal assessment of atmospheric PM in Puerto Plata, offering robust evidence of sustained exceedances of WHO air quality guidelines for both PM10 and PM2.5. The findings reveal a stable yet persistently elevated pollution regime, especially for PM10, driven by a mixed-source scenario in which natural aerosols (Saharan dust and marine spray) and local anthropogenic emissions (maritime activities, pyrotechnics) operate under distinct but overlapping temporal patterns.
A clear predominance of coarse particles was observed throughout the study period, with a low PM2.5/PM10 ratio (mean of 0.27), reflecting the persistent influence of marine aerosols. Saharan dust events episodically contribute to increasing PM10 levels during boreal summer months. In contrast, peak concentrations of fine PM were limited to specific tourism-related activities. The absence of significant differences between weekday and weekend PM levels points to continuous background emissions, especially from maritime and other anthropogenic sources.
From a policy perspective, the results underscore the necessity of a dual-focus mitigation strategy: (i) coarse particle advisories and public health alerts during the dust transport season (June-August), considering the episodic impact of Saharan dust and the year-round influence of marine aerosols; and (ii) monitoring and management of fine particle episodes associated with meteorological stability and local emission events, such as fireworks, particularly during the November-February period. Expanding the city’s air quality monitoring network, with special attention to capturing marine aerosol contributions, will be essential for evaluating the effectiveness of mitigation measures and improving public health risk assessments.
Future research should prioritize integrating meteorological parameters into PM variability assessments and advance source apportionment through receptor modeling and chemical speciation. These steps are critical for refining emission source profiles and designing sustainable air quality policies tailored to the unique environmental and socio-economic context of Puerto Plata and the broader Caribbean basin.