


 nueva página del texto (beta)
 Inglés (pdf)
 Artículo en XML
 Referencias del artículo
 Enviar artículo por email
 Citado por SciELO
  Similares en
SciELO
Similares en
SciELO 
 Permalink
1.Introduction
Thunderstorms are disastrous mesoscale weather phenomena with space scale varying from a few to hundreds of kilometers and a life span of less than an hour (30 to < 60 min) (Saha et al., 2014). It has been estimated that nearly 45 000 thunderstorm occur daily in the world, i.e., 16 million thunderstorms each year (Khan and Arsalan, 2007). However, the exact mechanisms that favor thunderstorms are very complex and a combination of multiple factors, with their relative importance varying from one region to another. Thunderstorms are strongly favored by convective instability, moisture availability in the lower troposphere, strong wind shear and a dynamical lifting mechanism (Kessler, 1982). The tropical hot and humid areas of the earth are well understood as a central player in the convective overturn of the atmosphere (Riehl and Malkus, 1958). Therefore, the majority of world’s thunderstorms occur over tropical areas. Many hazardous phenomena occur with thunderstorms, such as strong gusts, lashing rain, hail and even tornadoes (Puranik and Karekar, 2004) and lightning flashes (Manohar et al., 2008; Nath et al., 2009; Kumar and Kamra, 2012a, b). These severe weather events cause extensive structural damages, destruction of crops, uprooting of trees and casualties (Singh and Singh, 2015; Singh et al., 2017). Bhardwaj et al. (2017) observed that about 80% of the total reported thunderstorm casualties in India occur during the pre-monsoon season.
Numerous studies have examined the spatial and temporal variations in thunderstorm activity all over the world (Changnon and Changnon, 2001; Kuleshov et al., 2002; Ghalhari and Shakeri, 2015). Interestingly, significant changes in the frequency of thunderstorms have been observed worldwide in recent decades under changing climatic conditions (Zheng et al., 2010; Zhang and Pei, 2011). The scientific community has tried to uncover the associated causes for these long term-changes (Yu et al., 2016). Furthermore, a strong association has been found between thunderstorms and rainfall activity. The fact that rainfall very often follows thunderstorm activity has also been explored from various viewpoints. The earliest studies that corroborate the association of rainfall with frequencies of thunderstorms were those by Landsberg (1971) and Freier (1978). Their results showed that low rainfall regimes are well associated with low frequencies of thunderstorms. Zipser (1994) studied the correlation between rainfall and the number of thunderstorm days in the tropics, finding variable results in rainfall quantity and thunderstorm days along the north-south strip of West Africa.
India is also a vast tropical country with unique geographical setup, physiography and geomorphology, where there is hardly a month without the occurrence of thunderstorms (Tyagi, 2007; Das, 2015). For that reason, the concern about severe weather events like thunderstorm has stimulated extensive research. Therefore, a considerable amount of literature is available on thunderstorm activity over the Indian region. Earlier, Dallas (1900) studied the thunderstorm frequency over India by using the data of 10 stations. Koteswaram and Srinivasan (1958) examined thunderstorm activity over Gangetic West Bengal and noticed that simultaneous existence of low level convergence and upper level divergence play an important role for thunderstorm formation. Rao and Raman (1961) presented the monthly and annual frequencies of thunderstorms in India. Raman and Raghavan (1961) examined systematically for the first time the diurnal variation in the occurrence of thunderstorm activity over India. Mukherjee et al. (1964) studied thunderstorm occurrence over Guwahati and the adjoining northeast India, identifying a maximum frequency of thunderstorms during the pre-monsoon season, particularly at nighttime. Mukherjee and Sen (1983) studied the diurnal variation of thunderstorms for some selected stations, in order to understand the influence of different physical features such as plains, hills, coasts, islands, etc.
Since the last two decades, many studies have been carried out on thunderstorm activity over the Indian region (Sivaramkrishnan, 1990; Awadesh, 1992; Moid, 1995; Kar and Bandopadhyay, 1998; Manohar et al., 1999; Manohar and Kesarkar, 2003; Kandalgaonkar et al., 2005; Tyagi, 2007; Singh et al., 2011). Despite these contributions, just a few studies are focused on the association of thunderstorms and rainfall occurrence, which is especially interesting in India since this is a primarily agricultural country with an estimated population of 1.25 billion. Manohar et al. (1999), Manohar and Kesarkar (2004) and Kandalgaonkar et al. (2005) have studied the thunderstorm and rainfall activity over the Indian region. These studies are restricted to a smaller number of observatories and a very short period of time, focusing only on thunderstorm activity without discussing the causes of its occurrence and long term changes. Therefore, if the Indian region has experienced any kind of variation in thunderstorm occurrence and rainfall activity, the extent of these changes is still unclear. In the light of the above facts, the present study attempts to examine the relationship between occurrence of thunderstorm and rainfall activity by means of long-term data of a large number of stations spreading over India. This study will mainly concentrate on (1) temporal variations in thunderstorm days and rainfall activity, (2) spatial variations in thunderstorm days and rainfall activity; (3) monsoonal or continental convective systems, and (4) relationship between rainfall amounts and thunderstorm days over India. The expanded time frame and the large network of Indian observatories is an important component of this study. The information herein will also be helpful in detecting long-term trends. It is believed that the results obtained from this study may be welcomed by agriculturists, meteorologists, planners and the scientific community.
2. Materials and methods
2.1 Study area
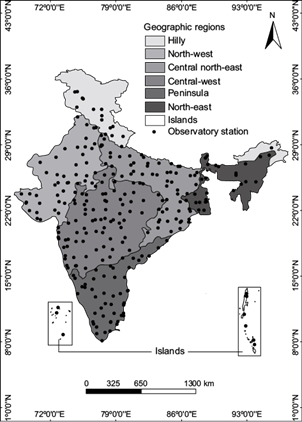
India is a country of subcontinent size with a total land area of about 3 287 263 km2, the seventh largest in the world. It is located between longitudes 68º 07′ and 97º 25′ E and latitudes 8º 04′ and 37º 06′ N (Fig. 1). The country supports a large variety of landscapes, geology, soils, climate, vegetation and natural resources. Because of its vast size, location and diversities of landscapes there are striking contrasts in meteorological conditions. The climate of the country is tropical and sub-tropical and most of the precipitation falls during June-September (80%), with large spatial and temporal variations. The rainfall regimes over the country are affected by El Nino-Southern Oscillation. There are marked variations in average annual temperature in different parts of the country. Further, the formation of synoptic scale weather systems over the country is primarily controlled by the Inter Tropical Convergence Zone (ITCZ).
India has been traditionally vulnerable to hydro-meteorological disasters owing to its unique geoclimatic conditions. Cyclones, floods, droughts, lightning and thunderstorms are frequent phenomena over the Indian region. Therefore, every year thousands of people lose their lives besides damages to infrastructure, agriculture, transport and the environment due to these disasters.
2.2 Data and methods
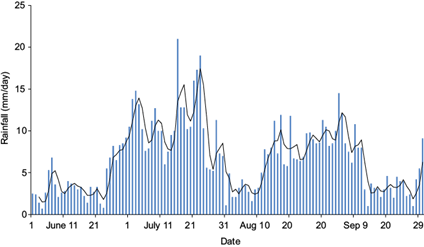
The mean monthly values of thunderstorm days (Thn), rainy days (Thr) and rainfall amounts (Trr) for the periods 1951-1980, 1961-1990, 1971-2000 and 1981-2010 have been used for the present study. Data has been acquired from climatological tables of observatories in India (climatological normals) published by the India Meteorological Department (IMD) for the aforementioned periods. Though it is not a flawless, this database is the primary source of information regarding different weather events for climatologists, meteorologists and hazard scientists to examine severe hazardous events in India. Accordingly, it has been widely used for comprehensive studies on thunderstorm occurrence over the Indian region (Manohar and Kesarkar, 2003, 2004, 2005; Kandalgaonkar et al., 2005; Tyagi, 2007; Singh and Bhardwaj, 2017). Data from 294 meteorological stations have been included in the present study. In this database, “thunder heard” (with or without lightning seen and with or without precipitation) has been considered as a thunderstorm phenomenon occurring at an observing station. Any number of occurrences in 24 h have been counted as “one” day. The distance between the nearest two stations is 20 km or more except in a few cases (Manohar and Kesarkar, 2003). Therefore, this would effectively reduce the chance of a single storm being reported simultaneously by two stations. The database includes all types of thunderstorms, namely convective, orographic, and seasonal. The changes in observation methods and relocation of stations affect the trends (Sonnadara, 2015). However, no changes in observation methods and relocation of these 294 stations have been observed during these periods. These stations are uniformly distributed across the length and breadth of the country (Fig. 1). Its only limitation is that it comprises 30-yr monthly average values obtained from daily thunderstorms with their annual sums, rather than annual time series data. Therefore, interannual variability has not been examined in the present study. Overall, the accuracy of the data could be considered adequate for the present research. In addition, accumulated daily rainfall data for all India on the 2009 monsoon season have been collected to acknowledge the variation in its occurrence at the beginning and end of the monsoon (see www.tropmet.res.in/~kolli/MOL).
For this study, annual, seasonal and monthly mean percentages of Thn, Thr and Trr have been computed for each period. Following Kashid and Maity (2012), the selected 294 stations were classified into seven geographic regions (Fig. 1). To investigate the seasonal variations in Thn, Thr and Trr, a year was divided into four seasons, following the IMD categorization, namely winter (January-February), pre-monsoon (March-May), monsoon (June-September) and post-monsoon (October-December). The monthly, seasonal, annual and regional percentages have been calculated with respect to each period and region separately. The calculated percentages are useful to understand the distribution of Thn, Thr and Trr across the country. Also, an effort has been made to examine the association of Thn occurrence with the onset of the monsoon.
The country as a whole receives about 80% of its annual rainfall during the monsoon season, either as light continuous rain from stratiform-cumulonimbus thick cloud decks lasting a couple of days, or in the form of heavy thundershowers of brisk durations from the more vigorous and more sparsely distributed thunderstorms (Manohar and Kesarkar, 2004). These two distinct categories of cloud systems have been identified by Rutledge et al. (1992) and Williams et al. (1992) in the Australian monsoon research program DUNDEE. Therefore, the index R (ratio of Thn and Thr) has been computed, following Rao et al. (1971), to discover the prevalence of these two cloud systems (monsoonal or continental convective regimes) over the Indian region. Another index, RTR (ratio of Trr and Thn) has also been computed for studying the relation between Trr and Thn (Zipser, 1994).
The derived calculations have been summarized in the form of graphs and maps. For the mapping of spatial characteristics of Thn, Thr, Trr and R, the kriging spatial interpolation technique has been used together with the Geographical Information System (GIS). Kriging has been found to be the most stochastic interpolation method, which is widely accepted as a standard approach for surface interpolation based on scalar measurements at different points (Isaaks and Srivastava, 1989). In addition, Pearson’s correlation analysis has been performed to study the relationship between Thn and Thr and Thn and Trr. On the basis of this process, several conclusions have been drawn, pertaining to Thn, Thr and Trr activity over India.
3. Results and discussion
3.1 Temporal occurrence of Thn, Thr and Trr
3.1.1 Mean annual variations
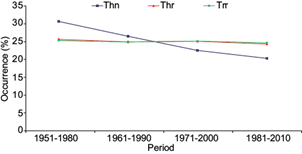
Figure 2 clearly demonstrates that Thn shows a sharp declining trend, whereas Thr and Trr are slightly decreasing. The observed sharp decreasing trend of Thn is not specific to India. Similar decreasing trends in the frequency of Thn activity have been observed worldwide during the second half of the 20th century over parts of the United States (Changnon and Changnon, 2001), parts of Russia and Kazakhstan (Gorbatenko and Dulzon, 2001), tropical Africa (Price and Asfur, 2006), parts of China (Wei et al., 2011; Yu et al., 2016), the Baltic countries (Enno et al., 2014), Yola in northeast Nigeria (Budnuka, 2015), and Pakistan (Mir et al., 2006). Further, Yu et al. (2016) found that a decreasing trend in the frequency of thunderstorms over China is due to a decrease in moisture transported over the region resulting from decreasing monsoonal rainfall. Similarly, a reduction in Thn activity over India can be attributed to the decline of rainfall activity, and also to a reduction in the amount moisture due to a fall in the frequency of monsoon depressions, and the increasing intensity and trends of ENSO, PDO and AMO warm phases (Dash et al., 2004; Lee and McPhaden, 2010; Kulkarni et al., 2013; Krishnamurthy and Krishnamurthy, 2014a, b). Another possible potential source of reduced thunderstorm activity over India needs to be further explored.
3.1.2 Mean seasonal variations
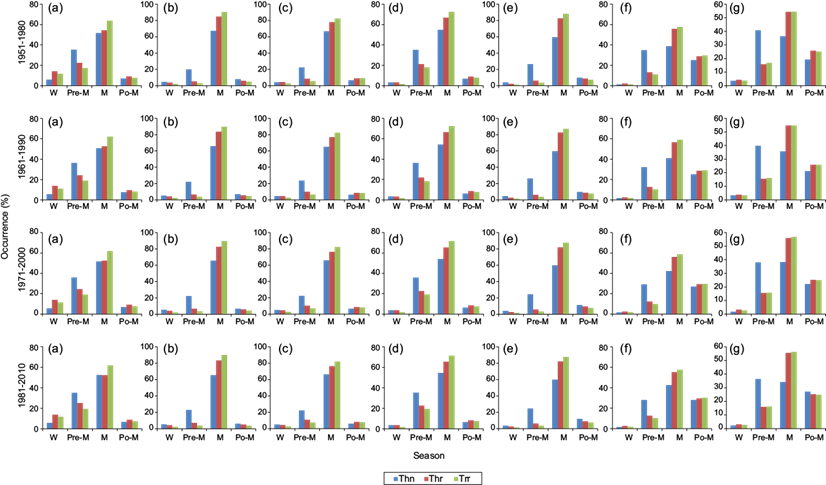
Figure 3a-d shows the seasonal percentages of occurrence of Thn, Thr and Trr over India. The occurrence of Thn in India was found to be higher than that of Thr and Trr during the pre-monsoon season, whereas it is almost equal to Thr and Trr during the post-monsoon and winter seasons. However, during the monsoon season the occurrence of Thr is higher than Thn by 15% and Trr by 20%. The percentage occurrence of Thn during winter, pre-monsoon, monsoon and post-monsoon seasons has been observed to be about 4, 29, 55 and 12%, respectively, whereas the corresponding Thr and Trr percentages are approximately 4, 12, 70, 14, and 2, 10, 75, 13, respectively. From these seasonal percentages, Thn, Thr and Trr have been observed to be maximum during the monsoon season (55, 70, and 75%, respectively) as compared to the other three seasons. The seasonal correlation coefficient (CC) of Thn and Thr was found to be 0.91, 0.91, 0.92, and 0.93, whereas the CCs of Thn and Trr were found to be 0.91, 0.90, 0.91, and 0.92 for the four periods, respectively. The observed higher values of CC may be an outcome of maximum Thn, Thr and Trr activity over India during the monsoon season. However, CC values of Thn/Thr and Thn/Trr for individual seasons have been found to be negative during the monsoon season through all the periods (Table I). The plausible cause for these negative CC values is an increase in rainfall activity by warm monsoon clouds (Kandalgaonkar et al., 2005). They also indicate a lower ocean-continent thermal contrast that motivates a greater entrance of humidity, therefore the occurrence of convective rain during the monsoon season (Roy et al. 2007). In addition, an increase of accumulated daily rainfall at the beginning and end of the monsoon season has been observed (Fig. 4). It has also been observed that CC values for the winter season (January-February) during the period 1951-1980 are negative due to a slight decline in Thr and Trr rather than Thn during February.
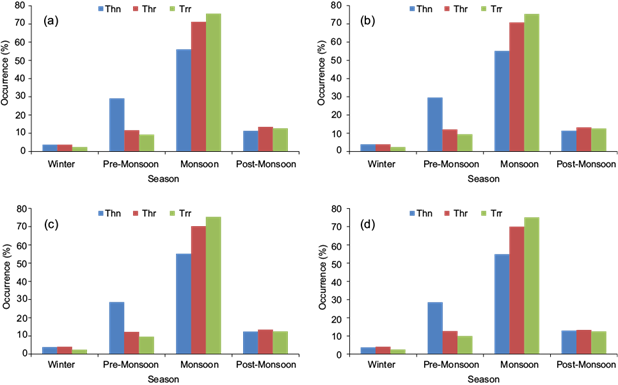
Fig. 3 Seasonal percentage of Thn, Thr and Trr over India during the periods: (a) 1951-1980, (b) 1961-1990, (c) 1971-2000, and (d) 1981-2010.
Table I Correlation coefficients between Thn and Thr and Thn and Trr for individual and all seasons over India.
| Season | 1951-1980 | 1961-1990 | 1971-2000 | 1981-2000 | |||||||
| Thn and Thr | Thn and Trr | Thn and Thr | Thn and Trr | Thn and Thr | Thn and Trr | Thn and Thr | Thn and Trr | ||||
| Winter | -1.00** | -1.00** | 1.00** | 1.00** | 1.00** | 1.00** | 1.00** | 1.00** | |||
| Pre-monsoon | 0.94 | 0.95 | 0.95 | 0.96 | 0.97 | 0.97 | 0.96 | 0.97 | |||
| Monsoon | -0.50 | -0.65 | -0.47 | -0.63 | -0.48 | -0.67 | -0.60 | -0.77 | |||
| Post-monsoon | 1.00 | 1.00 | 0.99 | 1.00 | 0.99 | 1.00 | 1.00 | 1.00 | |||
| All seasons | 0.91 | 0.91 | 0.91 | 0.90 | 0.92 | 0.91 | 0.93 | 0.92 | |||
**Correlation is significant at the 0.01 level (two-tailed).
Furthermore, the percentage occurrence of Thn, Thr and Trr has been observed to be 29, 12 and 10, respectively, during the pre-monsoon season. The occurrence of Thr and Trr during this season over India is associated with thunderstorm activity, which mainly results from strong convection. Apart from this, the rainfall amount depends on the availability of moisture with thunderstorm activity (Koteswaram and Srinivasan, 1958). The higher thunderstorm activity during the monsoon season can be accredited to the availability of abundant moisture in the lower troposphere associated with southwest monsoonal winds over the entire country. During the postmonsoon season, the percentage occurrence of Thr (14%) and Trr (13%) has been observed to be slightly higher than Thn (12%) during each period. It has been observed that Thn during the pre-monsoon produces less Thr and Trr, whereas lower occurrence of Thn during the postmonsoon season produces more rainfall activity Fig. 3a-d. It is important to highlight that while total rainfall decreases during the postmonsoon season, Thn activity does not necessarily lessen. Nevertheless, higher rainfall activity in relation to Thn during the post-monsoon season in India is anomalously associated with extraordinary events such as western disturbances over northern parts and tropical cyclones over the Bay of Bengal (Paul, 2001). During the winter season, the occurrence of Thn, Thr and Trr has been observed to be minimum due to cool and stable climatic conditions prevailing over most parts of the country (Tyagi, 2007).
3.1.3 Mean monthly variations
Figure 5a-d shows that least Thn activity occurs in December and then it increases consistently from January and attains a first peak in of June. It then decreases till August and attains a second peak in September. After September Thn activity diminishes systematically. Strong convection due to vertical sunrays and availability of abundant moisture in the lower troposphere provides favorable conditions for the formation of thunderstorms all over the country during June, whereas, in spite of low temperatures during September, regular clouds and rainfall activity ceases with the withdrawal of the monsoon. Therefore, the earth’s surface receives slightly more solar radiation. Simultaneously, abundant moisture still available in the lower atmosphere releases a large amount of latent heat from clouds to sustain thunderstorm development (Tinmaker et al., 2015). However, the likelihood of thunderstorms development decreases due to moisture deficiency as the season progresses.
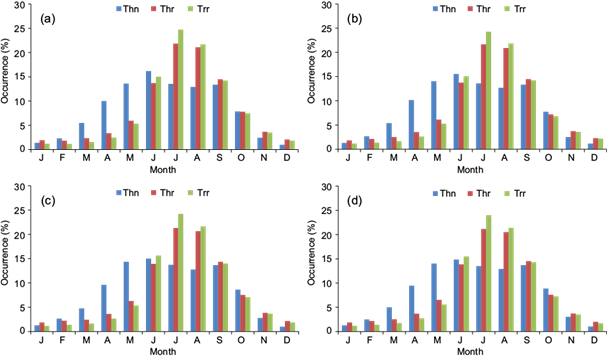
Fig. 5 Monthly percentage of Thn, Thr and Trr over India during the periods: (a) 1951-1980, (b) 1961-1990, (c) 1971-2000, and (d) 1981-2010.
Thr and Trr display a similar increase to Thn during the first half of the year; however, both parameters observed a single peak in July. From July onwards the activity shows a systematic reduction. A careful inspection of this figure highlights that there is one-month lag in the occurrence of peak activity for Thn and rainfall activity (Thr and Trr). This time lag can be attributed to the first period of the onset phase of summer monsoon rainfall over the Indian region (Kandalgaonkar et al., 2005). The preonset period is mostly associated with an increase in the Thn activity (Manohar et al., 1999).
After that, a reduction in Thn activity corresponding to a large increase in rainfall is again associated to the setup of the summer monsoon over the Indian region. These results clearly show that the occurrence of Thn is relatively reduced during the active monsoon season. Formerly, Kothawale and Kumar (2002) showed a strong negative correlation between mean surface temperature and monsoon rainfall. However, surface air temperature is a proxy for the development of Thn (Manohar et al., 1999; Manohar and Kesarkar, 2003, 2005; Kulkarni et al., 2009; Bhardwaj and Singh, 2016). Therefore, a decline in temperature due to heavy rainfall during the monsoon season leads to a decline in the frequency of Thn.
Apart from this, Thn, Thr and Trr have been observed to be minimum form November to February. CC values show that both Thn and Thr (1951-1980 = 0.76, 1961-1990 = 0.76, 1971-2000 = 0.78, 1981-2010 = 0.79) and Thn and Trr (1951-1980 = 0.75, 1961-1990 = 0.74, 1971-2000 = 0.76, 1981-2010 = 0.77) are strongly correlated and significant at 0.01 level during each period.
3.2 Spatial occurrence of Thn, Thr and Trr
The occurrence of Thn, Thr and Trr is primarily controlled by the surface and climatic conditions of a region dictated by proximity to the seas and oceans, topographical features, heating of earth surface, aridity etc. The Indian region is also endowed with variety of conditions which differ from region to region and so is the variation in Thn, Thr and Trr.
3.2.1 Mean annual variations
The mean annual distribution of Thn, Thr and Trr over the Indian region, shown in Figure 6, exhibits almost a similar pattern to the occurrence of Thn, Thr and Trr during 1951-1980. However, a sharp decline in the frequency of Thn has been observed during subsequent periods. Likewise, a slight decline in the frequency of Thr and Trr has been observed over all parts of the country, except the northeast, where an increasing trend in rainfall activity can be observed.
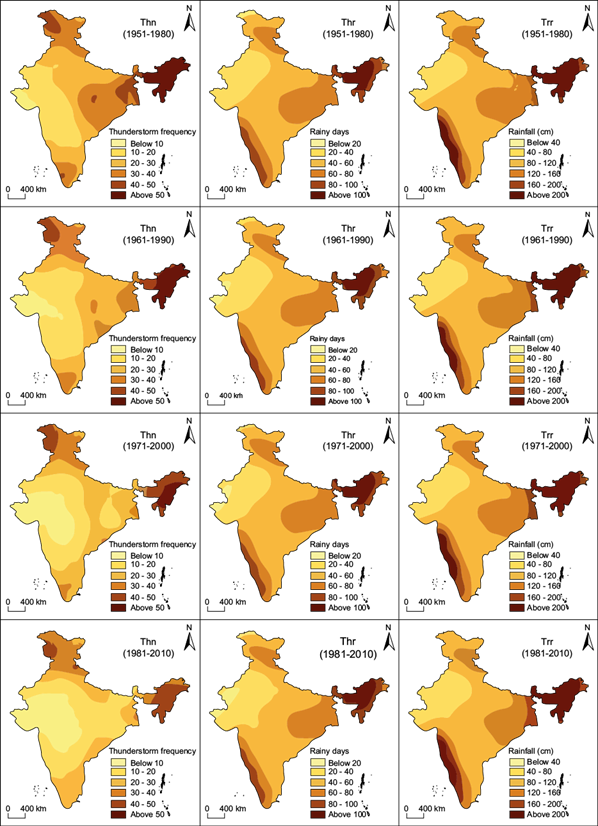
Fig. 6 Mean annual variations of Thn, Thr and Trr over the Indian region during different time periods.
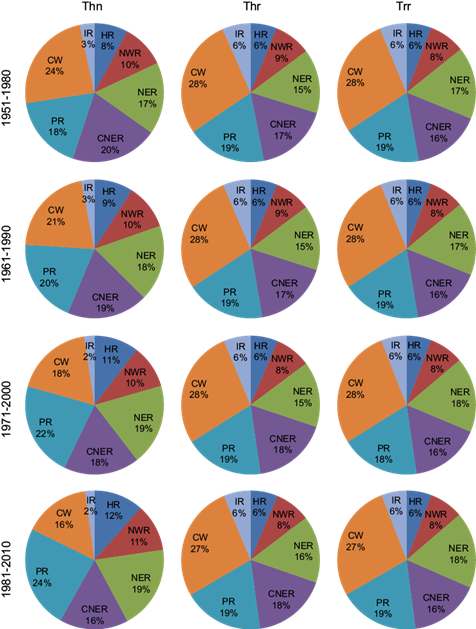
Regionally, about 80% of Thn, Thr and Trr are confined to the central-west, central northeast and northeast, whereas the remaining 20% is limited to hilly, northwest and island regions (Fig. 7). The percentage occurrence of Thr and Trr is almost equal, whereas Thn showed wide variations during each period. The central-west and central-northeast areas have shown a decline, while the peninsula, hilly and northeast regions have exhibited an increase in Thn activity. The percentage occurrence of Thn over the northeast and island regions is almost similar during each period.
3.2.2 Mean seasonal variations
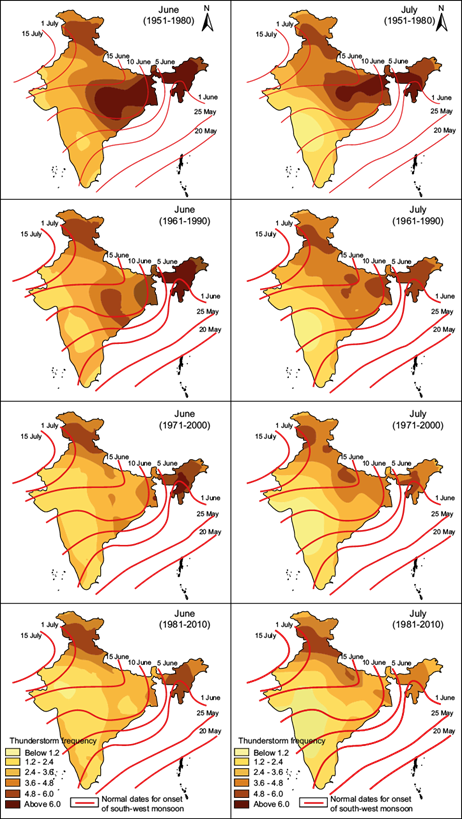
Figure 8a-d shows that the Thn, Thr and Trr are strongly associated to each other and their pattern is similar. However, the areas of their peak occurrence have shown wide variations during different seasons. For example, during the winter season, northern parts of the country register higher Thn, Thr and Trr as a result of western disturbances (Fig. 8a). In the pre-monsoon season, maximum occurrence has been observed over the north, northeast and south (Fig. 8b). Topography, insolation and advection of moisture under favorable wind regimes play a vital role to thunderstorm maxima over these areas. Synoptically, western disturbances and induced lows in north and easterly waves in the south provide favorable conditions for the occurrence of thunderstorm over these areas. Thunderstorms in this season are associated with norwesters over northeast areas (Singh et al., 2011). In the absence of adequate moisture, frequent convective dust storms called aandhi dominate over northwest India. With the onset of the south-west monsoon season, the whole country experiences an upsurge in Thn activity with increases in rainfall, except in southwest India (Fig. 8c). The higher Thr and Trr activity in a narrow belt over the southwest region can be attributed to the north-south extension of the western Ghats, which restrict the spread of moisture-laden south-west monsoon winds. The monsoon trough over the Indo-Gangetic plains is the prominent feature of July, which results in a marked increase of Thn activity over India (Tyagi, 2007), although the western part of the country continues to experience low thunderstorm activity with a slight increase as a result of westward-moving monsoon lows and depressions. During the postmonsoon season, peninsular India registers maximum Thn, Thr and Trr as a result of the retreating monsoon (Fig. 8d).
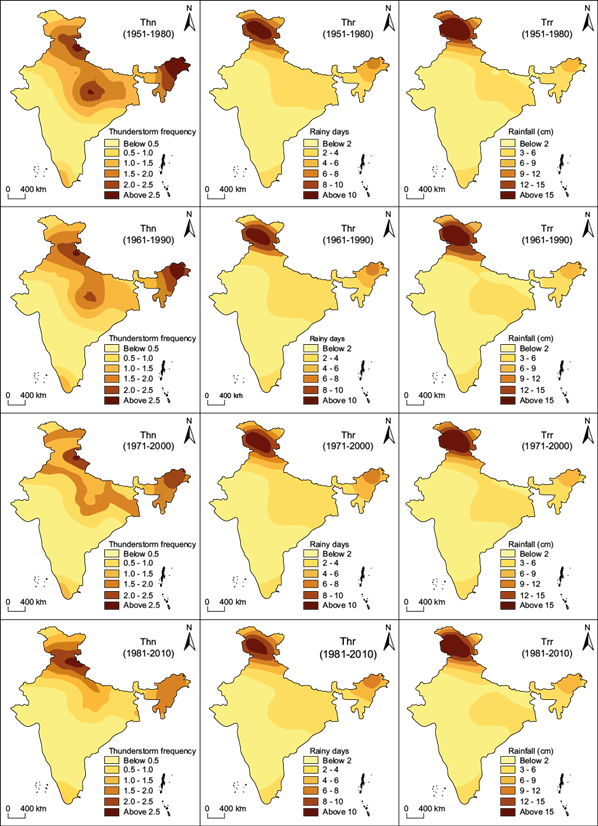
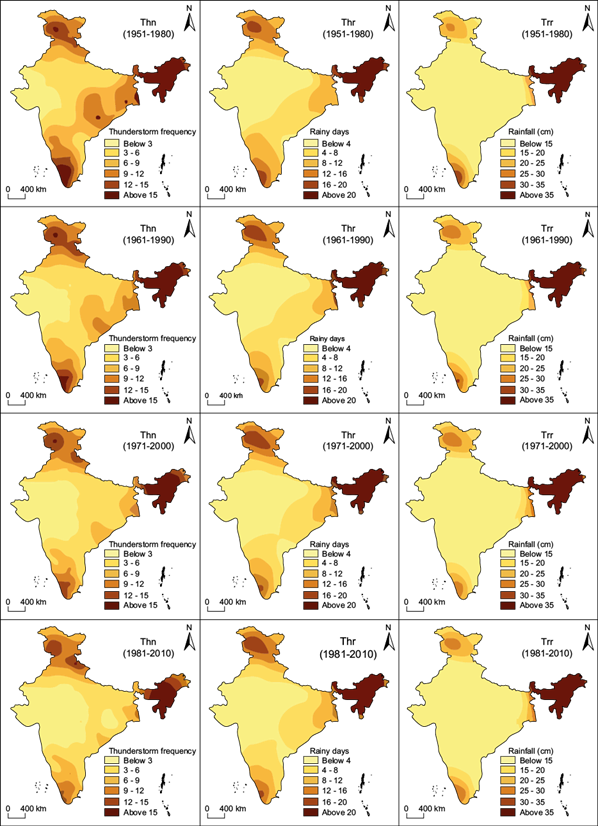
Fig. 8b Distribution of Thn, Thr and Trr during the pre-monsoon season over India in different time periods.
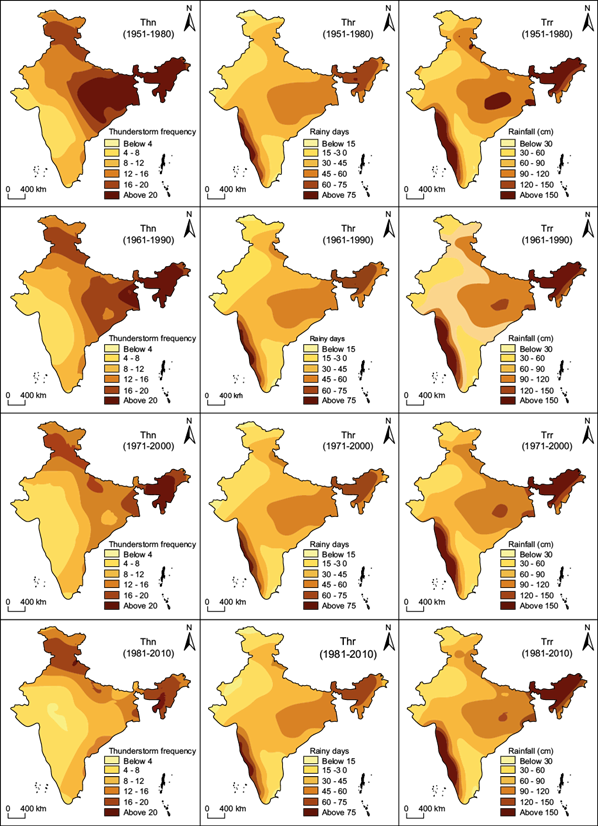
Fig. 8c Distribution of Thn, Thr and Trr during the monsoon season over India in different time periods.
Fig. 8d Distribution of Thn, Thr and Trr during the post-monsoon season over India in different time periods.
Seasonal analysis has revealed that each region undergoes maximum Thn, Thr and Trr during the monsoon season followed by pre-monsoon, postmonsoon and winter except in the hilly and island regions during all periods (Fig. 9a-g). The hilly region registers the Thn peak during the monsoon, followed by the pre-monsoon, postmonsoon and winter seasons, whereas the maximum Thr and Trr activity has been observed during the monsoon, followed by the pre-monsoon, winter and postmonsoon seasons. Interestingly, higher rainfall activity has been recorded in the hilly region (Thr and Trr) during winter compared to the rest of the regions, and the same can be attributed to the occurrence of western disturbances over this region. Islands have registered the highest Thn occurrence during the pre-monsoon season followed by the monsoon, postmonsoon and winter seasons, whereas the highest Thr and Trr occurred during the monsoon season followed by postmonsoon, pre-monsoon and winter seasons. Furthermore, the central-west, peninsula and island regions have shown a minor decline in Thn occurrence during the pre-monsoon season, while an increase during the postmonsoon season has been observed through all periods. However, occurrence of Thr and Trr has remained almost equal in these regions. The hilly and northwest regions have shown a slight increase in rainfall activity (Thr and Trr) during pre-monsoon, whereas a decrease during the monsoon season has been observed. Nonetheless, the occurrence of Thn activity remained almost invariable in these regions.
3.2.3 Mean monthly variations
Figure 10a-g demonstrates the monthly variation of Thn, Thr and Trr occurrence over different geographic regions of India, while other characteristics (range, maxima, minima, CC, etc.) have been described in Table II. A close examination has revealed that northeast and island regions register the Thn maxima during May, central-west in June and northwest in July during each period, while the central northeast, hilly and peninsular regions could not follow this consistency. It is evident from the figure that in the islands, peninsula, central-west and northeast regions two thunderstorm maxima have been recorded. However, a difference in the months of their peaks can be attributed to differences in the onset and retreating of monsoons.
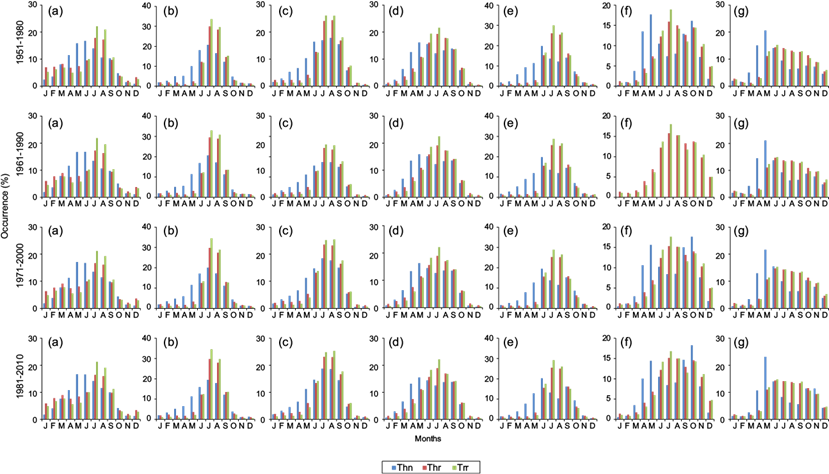
Fig. 10 Monthly percentages of Thn, Thr and Trr over different geographic regions of India: (a) hilly, (b) northwest, (c) central-northeast, (d) northeast, (e) central-west, (f) peninsula, and (g) islands.
Table II Monthly percentages of occurrence of thunderstorms (Thn), rainy days (Thr) and rainfall (Trr) over different geographic regions of India.
| Region | Thn range (%) | Thr range (%) | Trr range (%) | Thn maxima | Thr maxima | Trr maxima | Thn/Thr/Trr occurred b/w June and September (%) | Thn-Thr CC | Thn-Trr CC | |
| 1951-1980 | Hilly | 0.9-16.8 | 2.0-17.8 | 1.4-22.1 | June | July | July | 51.6/54.2/63.7 | 0.61* | 0.54 |
| Northwest | 1.4-20.6 | 0.9-29.9 | 0.7-33.6 | July | July | July | 67.4/84.9/90.3 | 0.88** | 0.87** | |
| Central-northeast | 0.4-17.8 | 0.8-24.4 | 0.4-26.1 | August | August | July | 66.7/78.0/82.6 | 0.90** | 0.88** | |
| Northeast | 0.2-16.2 | 0.6-19.2 | 0.3-21.6 | May | July | July | 54.9/66.8/72.4 | 0.85** | 0.82** | |
| Central-west | 0.7-19.8 | 1.1-26.0 | 0.5-30.0 | June | July | July | 59.5/82.8/88.2 | 0.72** | 0.71* | |
| Peninsula | 0.3-17.7 | 1.0-15.9 | 0.7-18.9 | May | July | July | 38.7/55.7/57.8 | 0.54 | 0.46 | |
| Islands | 1.6-20.6 | 1.3-14.4 | 0.9-15.2 | May | June | June | 36.3/54.2/54.4 | 0.43 | 0.50 | |
| India | 0.9-16.2 | 1.8-21.8 | 1.2-24.7 | June | July | July | 55.9/71.1/75.6 | 0.76** | 0.75** | |
| 1961-1990 | Hilly | 1.1-16.8 | 2.2-17.3 | 1.6-21.9 | June | July | July | 50.7/52.6/62.0 | 0.62* | 0.54 |
| Northwest | 1.5-20.6 | 1.4-29.5 | 0.8-33.0 | July | July | July | 65.9/83.7/89.6 | 0.88** | 0.87** | |
| Central-northeast | 0.5-17.4 | 1.1-24.3 | 0.6-26.0 | July | July | July | 65.2/77.0/82.4 | 0.90** | 0.89** | |
| Northeast | 0.2-15.9 | 0.8-19.2 | 0.5-22.5 | May | July | July | 54.2/66.3/72.5 | 0.86** | 0.80** | |
| Central-west | 0.9-19.7 | 1.2-25.7 | 0.7-28.8 | June | July | July | 59.6/82.6/87.2 | 0.72** | 0.70* | |
| Peninsula | 0.5-16.5 | 1.1-15.8 | 0.8-18.0 | May | July | July | 41.0/56.5/58.8 | 0.59* | 0.50 | |
| Islands | 1.7-21.1 | 1.2-13.7 | 0.8-14.9 | May | June | June | 35.7/54.8/54.7 | 0.45 | 0.49 | |
| India | 1.1-15.5 | 1.8-21.6 | 1.1-24.3 | June | July | July | 55.1/70.8/75.4 | 0.76** | 0.74** | |
| 1971-2000 | Hilly | 1.0-17.1 | 2.1-16.7 | 1.6-21.2 | June | July | July | 51.6/52.3/61.8 | 0.65* | 0.58* |
| Northwest | 1.2-20.1 | 1.1-29.8 | 0.7-34.5 | July | July | July | 65.6/82.7/89.5 | 0.88** | 0.88** | |
| Central-northeast | 0.5-18.4 | 1.1-23.6 | 0.6-25.5 | July | July | August | 65.9/76.4/82.2 | 0.93** | 0.92** | |
| Northeast | 0.3-16.3 | 0.8-18.9 | 0.5-22.1 | May | July | July | 54.0/65.3/71.5 | 0.87** | 0.82** | |
| Central-west | 0.5-19.5 | 1.0-25.2 | 0.6-28.9 | June | July | July | 60.0/81.9/87.6 | 0.72** | 0.71** | |
| Peninsula | 0.5-17.6 | 1.2-15.3 | 0.9-17.6 | October | July | July | 42.2/56.0/58.7 | 0.65* | 0.56 | |
| Islands | 0.8-21.7 | 1.3-14.7 | 0.9-15.3 | May | June | June | 38.2/55.9/56.7 | 0.55 | 0.57 | |
| India | 1.0-15.0 | 1.8-21.3 | 1.1-24.2 | June | July | July | 55.1/70.2/75.4 | 0.78** | 0.76** | |
| 1981-2010 | Hilly | 1.2-16.7 | 2.0-16.4 | 1.5-21.3 | May | July | July | 52.4/52.3/61.7 | 0.71* | 0.61* |
| Northwest | 1.1-19.4 | 1.1-29.7 | 0.6-34.5 | July | July | July | 65.4/83.2/90.2 | 0.89** | 0.88** | |
| Central-northeast | 0.6-18.8 | 1.1-23.2 | 0.6-25.3 | July | July | August | 66.5/76.2/82.1 | 0.95** | 0.93** | |
| Northeast | 0.3-15.5 | 0.8-18.9 | 0.4-22.2 | May | July | July | 54.5/65.5/71.5 | 0.88** | 0.83** | |
| Central-west | 0.5-20.3 | 0.8-25.5 | 0.5-29.1 | June | July | July | 59.9/82.2/87.7 | 0.68* | 0.67* | |
| Peninsula | 0.6-18.2 | 1.2-15.1 | 0.8-16.8 | October | July | July | 42.6/55.2/57.5 | 0.70* | 0.63* | |
| Islands | 1.1-23.2 | 1.3-14.4 | 1.1-14.8 | May | June | June | 34.1/55.6/56.3 | 0.53 | 0.56 | |
| India | 1.0-14.8 | 1.9/21.2 | 1.2-24.0 | June | July | July | 55.0/70.0/75.1 | 0.79** | 0.77** |
*Correlation is significant at the 0.05 level; **correlation is significant at the 0.01 level.
Regarding Thr and Trr, all the regions of the country have an almost similar pattern with only one peak in July during each period, except for the islands and the central northeast region (Table II). Thr and Trr reach their peak in the islands in June, while the central northeast region in July (1951-1980 and 1961-1990) and August (1971-2000 and 1981-2010). Further, a comparative examination of thunderstorm activity over the regions in lower and higher latitudes between the premonsoon and monsoon is interesting. Thunderstorm activity, which is higher in the lower latitudes during the premonsoon, season shifts northwards during the monsoon and concentrates in regions where the ITCZ is located.
Additionally, it has been revealed that regions (northwest, central northeast, northeast, central-west and hilly) with higher Thr and Trr during the monsoon months have high CC values with a 0.01 and 0.05 significance level (Table II). It has been witnessed that entire India experiences Thn activity with sharp increase in the central northeast and northeastern regions with monsoon onset in June (Fig. 11). However, a reduction over the southwest and an increase in the north and northwestern regions have been observed with the advance of monsoon during July. Apart from this, lower CC values at the islands and the peninsula region may be due to the minimum land mass area of the region affecting convection. The slightly higher value of CC at central-west may be due to the occasional development of a low pressure system in the Arabian Sea and westward movement of the monsoon trough (Kandalgaonkar et al., 2005).
3.3 Monsoonal or continental convective systems over India
In this section, a relation between Thn and Thr (R) has been established to investigate the prevalence of monsoonal or continental convective systems over India. Figure 12 illustrates the decreasing trend of annual averaged values of R, which is in correspondence with Thn activity over India (Fig. 2). Figure 13 illustrates that values of R are higher over the entire northern India with maximum at the north and northwest regions. However, a decreasing trend in annual averaged values of R has been observed all over the country. The R value is systematically significantly higher in the premonsoon season alone, while lowest during the monsoon season through all periods (Figs. 14, 15). Meanwhile, during the premonsoon season, frequent and widespread thunderstorms occur but with occasional rainy days. However, in the monsoon season, R is reversed with a large increase of rainy days compared to thunderstorm days. One of the climatological features of India during the premonsoon is a cumulonimbus regime of continental convection, which during the monsoon changes to a cumulonimbus regime of monsoonal convection. From this, it is concluded that the behavior of R may be considered as an index of monsoonality. The difference in R values between the monsoon and other seasons is attributed to a huge gap between an increase in the number of Thr during the monsoon over the premonsoon, against a similar increase in Thn. Apart from this, the number of Thr in the monsoon season increases by 512, 484, 471 and 450% over the premonsoon season, while Thn increases just by 92, 87, 92 and 93% during the four periods, respectively. However, a sharp decline in the R value has been observed in all parts of the country. Exceptionally, a slight increase over northwest India is observed in the monsoon season.
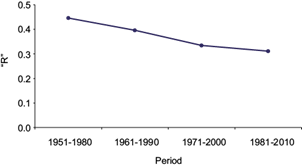
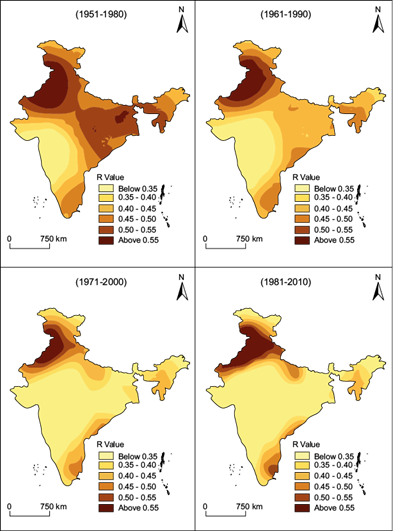
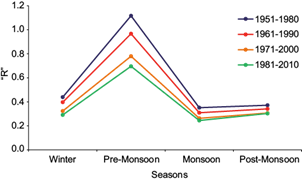
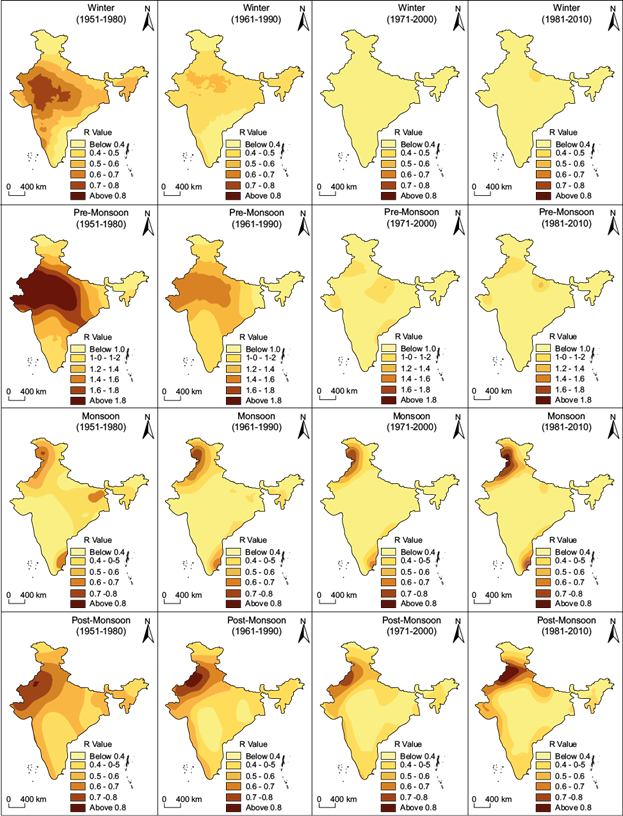
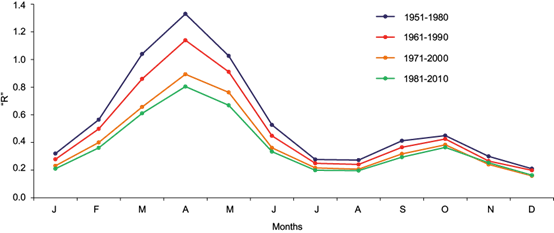
Figure 16 reveals that the lowest R value has been found in December, than it increases consistently from January onwards and attains its first maxima in April; then, it decreases until August, increases in September and attains a second peak in October. After this month, the R value has diminished systematically. The observed systematically increase in the values of R from January to April can be attributed to a rapid increase in the occurrence of Thn in comparison to Thr. After April, R values decrease consistently on account of s sharp increase in Thr (Fig. 5). Further, R decreases in each month from 1951-1980 to 1981-2010, which is attributed to the decreasing trend of Thn activity over India.
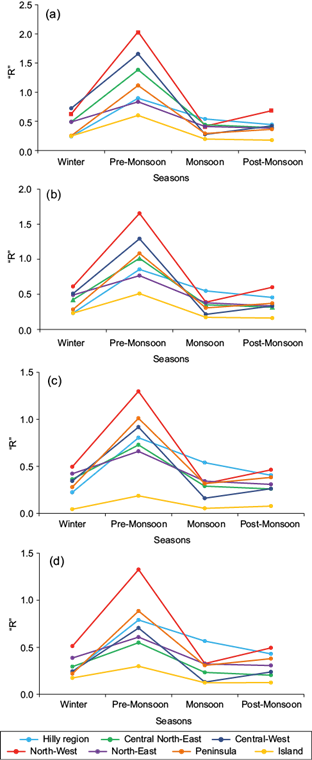
The seasonal values of R for different geographic regions of India are shown in Table III and Figure 17a-d. These values replicate similar observations for all India on each period (Fig. 14), and are in good agreement with the results obtained by Manohar and Kesarkar (2004). This highlights the prominence of the monsoonal convective system over India, which plays a very important role in the performance of south-west monsoons.
Table III Region-wise seasonal mean number of thunderstorm days (Thn), rainy days (Thr) and R over different geographic regions of India.
| Region | Winter | Pre-monsoon | Monsoon | Post-monsoon | ||||||||||||
| Thn | Trr | R | Thn | Trr | R | Thn | Trr | R | Thn | Trr | R | |||||
| 1951-1980 | Hilly | 2.7 | 11.2 | 0.2 | 15.9 | 17.8 | 0.9 | 23.3 | 43.0 | 0.5 | 3.2 | 7.2 | 0.4 | |||
| Northwest | 0.8 | 1.2 | 0.6 | 3.3 | 1.6 | 2.0 | 11.1 | 26.7 | 0.4 | 1.3 | 1.9 | 0.7 | ||||
| Central-northeast | 1.3 | 2.6 | 0.5 | 6.8 | 4.9 | 1.4 | 19.7 | 44.7 | 0.4 | 2.0 | 5.1 | 0.4 | ||||
| Northeast | 1.5 | 3.1 | 0.5 | 17.0 | 20.4 | 0.8 | 26.6 | 64.6 | 0.4 | 3.3 | 8.7 | 0.4 | ||||
| Central-west | 0.9 | 1.3 | 0.7 | 6.0 | 3.6 | 1.7 | 13.4 | 48.6 | 0.3 | 2.2 | 5.2 | 0.4 | ||||
| Peninsula | 0.4 | 1.4 | 0.3 | 9.5 | 8.5 | 1.1 | 10.5 | 36.1 | 0.3 | 6.8 | 18.8 | 0.4 | ||||
| Islands | 1.3 | 5.1 | 0.2 | 11.2 | 18.7 | 0.6 | 12.6 | 64.5 | 0.2 | 5.4 | 30.6 | 0.2 | ||||
| Mean | 0.4 | 1.2 | 0.4 | 0.4 | ||||||||||||
| SD | 0.2 | 0.5 | 0.1 | 0.1 | ||||||||||||
| Median | 0.5 | 1.1 | 0.4 | 0.4 | ||||||||||||
| 1961-1990 | Hilly | 2.5 | 10.8 | 0.2 | 16.3 | 19.0 | 0.9 | 22.8 | 41.5 | 0.5 | 3.4 | 7.5 | 0.5 | |||
| Northwest | 0.8 | 1.2 | 0.6 | 3.3 | 2.0 | 1.7 | 9.7 | 25.0 | 0.4 | 1.0 | 1.7 | 0.6 | ||||
| Central-northeast | 1.1 | 2.6 | 0.4 | 5.7 | 5.6 | 1.0 | 15.3 | 43.5 | 0.4 | 1.5 | 4.8 | 0.3 | ||||
| Northeast | 1.5 | 3.1 | 0.5 | 16.0 | 20.9 | 0.8 | 24.0 | 63.2 | 0.4 | 2.7 | 8.2 | 0.3 | ||||
| Central-west | 0.8 | 1.5 | 0.5 | 4.4 | 3.4 | 1.3 | 10.1 | 47.0 | 0.2 | 1.6 | 4.9 | 0.3 | ||||
| Peninsula | 0.4 | 1.5 | 0.3 | 8.5 | 7.9 | 1.1 | 10.9 | 35.3 | 0.3 | 6.6 | 17.9 | 0.4 | ||||
| Islands | 1.0 | 4.4 | 0.2 | 8.9 | 17.5 | 0.5 | 10.7 | 61.8 | 0.2 | 4.7 | 29.2 | 0.2 | ||||
| Mean | 0.4 | 1.0 | 0.3 | 0.4 | ||||||||||||
| SD | 0.2 | 0.4 | 0.1 | 0.1 | ||||||||||||
| Median | 0.4 | 1.0 | 0.4 | 0.3 | ||||||||||||
| 1971-2000 | Hilly | 2.5 | 11.3 | 0.2 | 15.9 | 19.8 | 0.8 | 22.8 | 42.2 | 0.5 | 3.0 | 7.4 | 0.4 | |||
| Northwest | 0.6 | 1.3 | 0.5 | 2.7 | 2.1 | 1.3 | 7.8 | 24.7 | 0.3 | 0.8 | 1.8 | 0.5 | ||||
| Central-northeast | 1.0 | 2.7 | 0.4 | 4.3 | 6.0 | 0.7 | 12.7 | 44.0 | 0.3 | 1.3 | 4.9 | 0.3 | ||||
| Northeast | 1.5 | 3.5 | 0.4 | 14.4 | 21.9 | 0.7 | 21.7 | 63.5 | 0.3 | 2.6 | 8.3 | 0.3 | ||||
| Central-west | 0.5 | 1.5 | 0.3 | 3.1 | 3.3 | 0.9 | 7.5 | 46.6 | 0.2 | 1.4 | 5.4 | 0.3 | ||||
| Peninsula | 0.4 | 1.5 | 0.3 | 7.8 | 7.7 | 1.0 | 11.1 | 35.2 | 0.3 | 7.0 | 18.3 | 0.4 | ||||
| Islands | 0.2 | 3.7 | 0.0 | 3.2 | 17.3 | 0.2 | 3.4 | 62.1 | 0.1 | 2.2 | 28.0 | 0.1 | ||||
| Mean | 0.3 | 0.8 | 0.3 | 0.3 | ||||||||||||
| SD | 0.1 | 0.3 | 0.2 | 0.1 | ||||||||||||
| Median | 0.3 | 0.8 | 0.3 | 0.3 | ||||||||||||
| 1981-2010 | Hilly | 2.6 | 10.8 | 0.2 | 15.5 | 19.6 | 0.8 | 23.2 | 40.9 | 0.6 | 3.0 | 6.9 | 0.4 | |||
| Northwest | 0.6 | 1.2 | 0.5 | 2.7 | 2.1 | 1.3 | 7.8 | 23.7 | 0.3 | 0.7 | 1.5 | 0.5 | ||||
| Central-northeast | 0.7 | 2.5 | 0.3 | 3.4 | 6.1 | 0.5 | 9.9 | 42.4 | 0.2 | 0.9 | 4.6 | 0.2 | ||||
| Northeast | 1.3 | 3.5 | 0.4 | 13.1 | 21.6 | 0.6 | 20.3 | 62.8 | 0.3 | 2.4 | 8.0 | 0.3 | ||||
| Central-west | 0.4 | 1.4 | 0.2 | 2.4 | 3.4 | 0.7 | 5.8 | 44.6 | 0.1 | 1.2 | 4.8 | 0.2 | ||||
| Peninsula | 0.4 | 1.6 | 0.2 | 6.9 | 7.8 | 0.9 | 10.5 | 34.3 | 0.3 | 6.9 | 18.3 | 0.4 | ||||
| Islands | 0.6 | 3.4 | 0.2 | 5.1 | 17.2 | 0.3 | 7.3 | 59.6 | 0.1 | 3.4 | 27.1 | 0.1 | ||||
| Mean | 0.3 | 0.7 | 0.3 | 0.3 | ||||||||||||
| SD | 0.1 | 0.3 | 0.2 | 0.1 | ||||||||||||
| Median | 0.2 | 0.7 | 0.3 | 0.3 | ||||||||||||
R: mean thunderstorm days/mean rainy days.
Table IV Region-wise seasonal mean number of thunderstorm days (Thn), rainfall days (Trr) and RTR over different geographic regions of India.
| Region | Winter | Pre-Monsoon | Monsoon | Post-Monsoon | ||||||||||||
| Thn | Trr | RTR | Thn | Trr | RTR | Thn | Trr | RTR | Thn | Trr | RTR | |||||
| 1951-1980 | Hilly | 2.7 | 191.6 | 71.5 | 15.9 | 285.9 | 17.9 | 23.3 | 1060.8 | 45.6 | 3.2 | 126.5 | 39.4 | |||
| Northwest | 0.8 | 13.9 | 18.3 | 3.3 | 19.7 | 6.0 | 11.1 | 612.1 | 55.2 | 1.3 | 31.8 | 24.6 | ||||
| Central-northeast | 1.3 | 31.8 | 25.2 | 6.8 | 66.6 | 9.8 | 19.7 | 984.1 | 49.8 | 2.0 | 109.0 | 54.2 | ||||
| Northeast | 1.5 | 38.5 | 25.5 | 17.0 | 438.6 | 25.8 | 26.6 | 1753.2 | 66.0 | 3.3 | 191.2 | 57.4 | ||||
| Central-west | 0.9 | 14.9 | 15.9 | 6.0 | 46.5 | 7.8 | 13.4 | 1148.9 | 85.9 | 2.2 | 92.0 | 41.7 | ||||
| Peninsula | 0.4 | 20.9 | 59.7 | 9.5 | 159.6 | 16.8 | 10.5 | 830.7 | 79.0 | 6.8 | 426.9 | 62.7 | ||||
| Islands | 1.3 | 94.1 | 74.1 | 11.2 | 421.5 | 37.5 | 12.6 | 1371.5 | 108.6 | 5.4 | 633.1 | 117.0 | ||||
| Mean | 41.5 | 17.4 | 70.0 | 56.7 | ||||||||||||
| SD | 25.9 | 11.2 | 22.6 | 29.5 | ||||||||||||
| Median | 25.5 | 16.8 | 66.0 | 54.2 | ||||||||||||
| 1961-1990 | Hilly | 2.5 | 179.4 | 71.2 | 16.3 | 310.5 | 19.1 | 22.8 | 1018.7 | 44.6 | 3.4 | 133.5 | 39.0 | |||
| Northwest | 0.8 | 13.9 | 18.3 | 3.3 | 24.6 | 7.6 | 9.7 | 577.5 | 59.4 | 1.0 | 28.8 | 28.4 | ||||
| Central-northeast | 1.1 | 31.9 | 29.0 | 5.7 | 78.9 | 13.9 | 15.3 | 979.6 | 64.0 | 1.5 | 98.2 | 64.5 | ||||
| Northeast | 1.5 | 37.6 | 25.1 | 16.0 | 443.3 | 27.7 | 24.0 | 1754.1 | 73.1 | 2.7 | 185.2 | 67.9 | ||||
| Central-west | 0.8 | 18.7 | 24.1 | 4.4 | 46.2 | 10.4 | 10.1 | 1125.8 | 111.4 | 1.6 | 99.8 | 60.6 | ||||
| Peninsula | 0.4 | 26.7 | 62.0 | 8.5 | 144.6 | 17.0 | 10.9 | 823.4 | 75.9 | 6.6 | 405.5 | 61.0 | ||||
| Islands | 1.0 | 80.7 | 79.1 | 8.9 | 385.5 | 43.1 | 10.7 | 1315.2 | 123.3 | 4.7 | 623.9 | 131.9 | ||||
| Mean | 44.1 | 19.8 | 78.8 | 64.8 | ||||||||||||
| SD | 25.6 | 12.2 | 28.4 | 33.0 | ||||||||||||
| Median | 29.0 | 17.0 | 73.1 | 61.0 | ||||||||||||
| 1971-2000 | Hilly | 2.5 | 189.3 | 75.1 | 15.9 | 318.4 | 20.0 | 22.8 | 1027.9 | 45.1 | 3.0 | 128.4 | 43.1 | |||
| Northwest | 0.6 | 14.6 | 22.5 | 2.7 | 23.4 | 8.8 | 7.8 | 571.3 | 73.2 | 0.8 | 28.9 | 34.7 | ||||
| Central-northeast | 1.0 | 32.6 | 33.1 | 4.3 | 84.7 | 19.5 | 12.7 | 994.4 | 78.0 | 1.3 | 98.2 | 77.1 | ||||
| Northeast | 1.5 | 42.3 | 28.4 | 14.4 | 480.4 | 33.3 | 21.7 | 1781.2 | 82.0 | 2.6 | 186.3 | 72.8 | ||||
| Central-west | 0.5 | 18.9 | 35.8 | 3.1 | 42.7 | 13.9 | 7.5 | 1134.8 | 150.9 | 1.4 | 99.2 | 69.7 | ||||
| Peninsula | 0.4 | 25.2 | 58.8 | 7.8 | 139.2 | 17.8 | 11.1 | 830.4 | 74.5 | 7.0 | 419.3 | 59.6 | ||||
| Islands | 0.2 | 62.7 | 392.0 | 3.2 | 370.8 | 114.8 | 3.4 | 1340.1 | 400.0 | 2.2 | 588.0 | 273.5 | ||||
| Mean | 92.2 | 32.6 | 129.1 | 90.1 | ||||||||||||
| SD | 133.5 | 37.0 | 123.7 | 82.4 | ||||||||||||
| Median | 35.8 | 19.5 | 78.0 | 69.7 | ||||||||||||
| 1981-2010 | Hilly | 2.6 | 190.5 | 73.9 | 15.5 | 319.3 | 20.6 | 23.2 | 1013.2 | 43.8 | 3.0 | 119.4 | 40.3 | |||
| Northwest | 0.6 | 14.4 | 22.7 | 2.7 | 24.0 | 8.8 | 7.8 | 555.7 | 71.7 | 0.7 | 22.4 | 30.5 | ||||
| Central-northeast | 0.7 | 30.8 | 42.0 | 3.4 | 88.7 | 26.3 | 9.9 | 974.4 | 98.6 | 0.9 | 93.4 | 100.8 | ||||
| Northeast | 1.3 | 42.6 | 31.9 | 13.1 | 480.9 | 36.6 | 20.3 | 1775.9 | 87.6 | 2.4 | 185.9 | 76.2 | ||||
| Central-west | 0.4 | 18.1 | 51.6 | 2.4 | 43.8 | 18.5 | 5.8 | 1096.0 | 189.3 | 1.2 | 91.5 | 79.5 | ||||
| Peninsula | 0.4 | 26.9 | 75.6 | 6.9 | 146.4 | 21.1 | 10.5 | 810.9 | 76.9 | 6.9 | 425.2 | 61.3 | ||||
| Islands | 0.6 | 60.8 | 103.1 | 5.1 | 370.1 | 72.3 | 7.3 | 1283.9 | 175.2 | 3.4 | 566.7 | 167.7 | ||||
| Mean | 57.2 | 29.2 | 106.1 | 79.5 | ||||||||||||
| SD | 28.3 | 20.8 | 54.8 | 45.7 | ||||||||||||
| Median | 51.6 | 21.1 | 87.6 | 76.2 | ||||||||||||
RTR: mean rainfall days /mean thunderstorm days.
3.4 Relation between Trr and Thn
Annual values of RTR illustrate the increasing trend for different periods (Fig. 18a) and can be attributed to the anomalous reduction of Thn activity over India (Fig. 2). During the monsoon season RTR is significantly higher, whereas it is lowest during the premonsoon season through all periods (Fig. 18b). The amount of Trr during the monsoon season increases by 711, 692, 686 and 653% over the premonsoon season, while Thn increases just by 92, 87, 92 and 93% during the four periods, respectively.
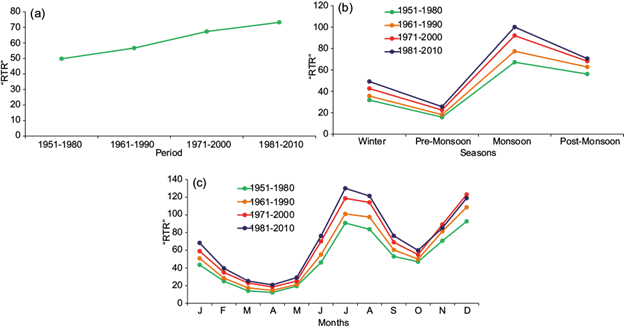
Fig. 18 (a) Annual, (b) seasonal, and (c) monthly variation of RTR (mean rainfall/mean thunderstorm days) over India.
The monthly values of RTR represent a contrasting pattern to those of R (Fig. 18c and 16). RTR values decrease continuously from December to April. Afterwards, they increase sharply and attain their highest peak in July, which is attributed to a peak in Trr activity. After July, a decline in RTR values is observed until October, due to reduction in Trr (Fig. 5). After October, a rise in RTR can be accredited to the low occurrence of Thn.
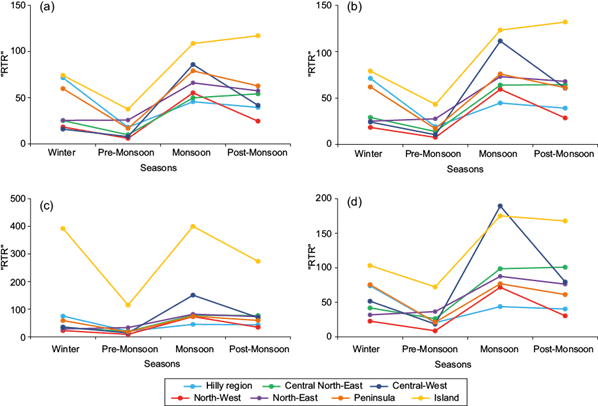
Figure 19a, d and Table IV illustrate the seasonal indices of RTR over different geographic regions for each period and replicate similar observations for India. Interestingly, very high and exceptional RTR values over the islands during the period 1971-2000 may be attributed to the lower occurrence of Thn. Finally, it is concluded that RTR values are larger during the monsoon than those of other seasons. The larger values of RTR can suggest that the contribution of Thn rain to total Trr is significant during the monsoon. These results are consistent and in agreement with earlier studies by Zipser (1994) and Manohar et al. (1999).
4. Conclusions
In the present study an attempt has been made to identify the relation between Thn and Thr, and Thn and Trr by employing the monthly mean data of 294 well distributed meteorological stations over India. It is interesting to note that the Thn activity shows a sharp decline, whereas rainfall activity exhibits a slight decline over India. Apart from this, Thn and Thr and Thn and Trr are strongly correlated and the value of CC is significant at a 0.01 level. However, the monthly mean percentage of occurrence of Thn, Thr and Trr has revealed that there is a one-month lag in the peak occurrence of Thn and rainfall activity (Thr and Trr), which may be due to the prime onset period of the south-west monsoon over the Indian region. The seasonal distribution shows that the activity of Thn, Thr and Trr is highest during the monsoon season. However, the observed negative CC during this season may be due to the increase in rainfall activity due to warm monsoon clouds. Rainfall activity associated with Thn during the postmonsoon is higher than that of the premonsoon season, and it can also be attributed to the occurrence of tropical cyclones in the Bay of Bengal. During winter, the percentage of occurrence of Thn is lower due to low moisture content and colder conditions prevailing over most parts of the country. Apart from this, the regional analysis of data also shows the existence of a wide range of monthly variation in Thn, Thr and Trr occurrence in the respective regions. It has also been observed that regions with more Thn and rainfall activity during the peak months of the monsoon have high CC values. The higher values of R during the premonsoon season are attributed to frequent and widespread Thn activity with occasional Thr over major parts of the country, while the lowest values observed during the monsoon season are due to a large increase in Thr against Thn. In addition, RTR values are highest during the monsoon season due to higher values of Trr as compared to Thn, while lowest values are observed during the premonsoon on account of frequent Thn activity with less Trr. The decreasing and increasing trend in values of R and RTR is a result of decreasing Thn activity over India.

