


Servicios Personalizados
Revista
Articulo
 Inglés (pdf)
 Artículo en XML
 Referencias del artículo
 Enviar artículo por email
Indicadores
-
 Citado por SciELO
 -
 Accesos
Links relacionados
-
 Similares en
SciELO
Similares en
SciELO
Compartir

 Permalink
Atmósfera
versión impresa ISSN 0187-6236
Atmósfera vol.24 no.1 Ciudad de México ene. 2011
Average conditions of thermal stress in Mexican cities with more than one million inhabitants in the face of climatic change
A. TEJEDA–MARTÍNEZ
Licenciatura en Ciencias Atmosféricas, Universidad Veracruzana,
Xalapa, Veracruz, México. atejeda@uv.mx
E. LUYANDO and E. JÁUREGUI
Centro de Ciencias de la Atmósfera, Universidad Nacional Autónoma de México
Circuito Exterior, Ciudad Universitaria, México D. F. 04510, México.
Corresponding author: E. Luyando; e–mail: ellu@atmosfera.unam.mx.
Received August 15, 2009; accepted March 16, 2010
RESUMEN
Se presentan escenarios de bioclima humano para ciudades mexicanas de más de un millón de habitantes, considerando el calentamiento urbano y el calentamiento global. El primero se infirió a partir de datos demográficos, y el segundo, de las salidas de los modelos de circulación general. Así, fue posible estimar incrementos en temperatura y modificaciones de las condiciones de humedad que se tradujeron en estimaciones del bioclima humano para el periodo 1981–2000 y las décadas de 2030 y 2050, y sus consecuentes consumos eléctricos domésticos por climatización de viviendas.
ABSTRACT
Human bioclimatic scenarios are presented for Mexican cities with more than a million inhabitants. For this, both urban and global warming were considered, the former having been inferred from demographic data, and the latter from the output of general circulation models. Thus, it was possible to estimate increases in temperature and modifications in hygrometric conditions, which were then used to estimate the human bioclimate for the period of 1981–2000 and the decades of 2030 and 2050, as well as the domestic electrical consumption for air–conditioning in housing resulting there from.
Keywords: bioclimatic scenarios, global warming, urban, hygrometric conditions, temperature.
1. Introduction
It is in urban centers where the global climatic change can exercise its greatest effect on the human population; this has been well documented by Bicknell et al. (2009) in their analysis of adaptation strategies for coastal and very populous cities in developing countries, particularly in the face of increased risk from eventual rainstorms, epidemics and deteriorated quality of the water supply.
From a more physical point of view, the natural soil covering previously existing in urban environments is drastically replaced by other forms of land use to satisfy the ever–increasing demands of society for resources and space. On the other hand, the high density of population also increases the levels of vulnerability in the event of severe storms.
The urban climate differs from that of the surrounding rural areas because of the way in which the net energy trapped in the surface/atmosphere interface is dissipated, and this produces phenomena like the heat island. During the day, the materials in the cities warm up progressively and even more slowly than the ground in rural areas, either bare or covered with vegetation; during the night, however, the urban materials conserve the daytime heat for a longer time, while the countryside cools off rapidly. In other words, the denser and impervious materials covering the surface in the cities have a greater thermal capacity and conductivity than those of the natural surface.
In addition, the net energy retained by the surface/atmosphere interface is dissipated more as sensitive turbulent heat than as latent heat through evaporation. In the urban canyons resulting from the presence of buildings and streets, the accumulated surface heat dissipates with greater difficulty, since the air currents there are modified and their speed is reduced (Arnfield, 2003). Therefore, the heat island –understood as the ambient temperature difference between a city and its surroundings– appears in situations of calm air and clear skies, conditions which in Mexican cities generally occur around daybreak during the winter season, its intensity being proportional to the size of the urban area and the population it contains (Jáuregui and Tejeda, 2004).
Since the nation's principal cities continue growing in extent and in population, the heat islands can be expected to become more intense in the coming decades, as long as demographic stability is not attained. If this situation is added to the effects of global warming, it becomes evident that future thermal conditions will differ noticeably from the present ones, and this constitutes the chief motivation of our work. The studied urban areas studied have more than a million inhabitants, excepting two heavily populated coastal sites, Veracruz and Acapulco, which do not quite reach one million (Table I). The results that follow are part of a more extensive project reported by Luyando et al. (2009).
2. Data and methods
2.2 Tendencies combining climatic change and heat island
The urban heat island may signify a substantial increase in risk from heat waves for the population, especially in summer when the maximum temperature –for cities in middle and subtropical latitudes– can be about 2 °C higher in the city center than in its surroundings (Zhou and Stepherd, 2009; Tan et al., 2009). Therefore it is necessary not only to characterize the behavior of this phenomenon, but also to generate plausible scenarios for estimating the future intensity of the heat island. Since there are very few experimental studies of this phenomenon for México, we decided on a simple parameterization.
For each city or urbanized area, we estimated the maximum intensity of the heat island in °C (HI), using the following equation (Jáuregui and Tejeda, 2004):

where P is the number of inhabitants.
Through this method we obtained the maximum IC for each of the 11 cities in Table I, with demographic information for the year 2030. Considering the value derived from Eq. (1) as the expected maximum, we first approached this work by dividing said value by four in order to estimate an average in space and time. In an extreme case, it should be considered that the phenomenon could affect half of the city during half of the time.
The average thermal increases per heat island thus estimated were kept invariable after the 2030 decade, under the assumption that demographic stability will prevail from then on (Rodríguez et al., 2004). This result was added to the average increases in temperature due to global warming, which were obtained by applying the general circulation models to the decade of 2030. (Conde et al., 2008).
As expected, Table II shows that the different models of general circulation produce similar results for all the cities, whereas the increases associated with the heat island present differences that are more noticeable.
In order to obtain the human bioclimatic scenarios presented here, temperature increases taken from the climatic change scenarios for the nation by Conde et al. (2008) starting from the ECHAM, GFDL and Hadley models, for the decades of 2030 and 2050, were used.
2.2 Bioclimatic climatograms
Bioclimatic climatograms were designed for the eleven cities or urbanized areas in Table I, although in the results only those corresponding to four climatically representative cities will be shown. The normal climatological scenarios for 1981–2000 were taken as a basis. Each climatogram shows the hourly value of a classical bioclimatic index, the Effective Temperature (Missenard,1937), defined as equivalent to the temperature in calm air that a healthy sedentary subject, seated in the shade and dressed in working clothes, would perceive if the relative humidity were 100%. Its mathematical expression is:

Where Tα s the air temperature in °C and RH the percentage of relative humidity.
The choice of this method is based on the availability of the climatic information necessary for calculating future scenarios; for this, the temperature and humidity are accessible data which, combined in an index, come close to representing sufficiently clear bioclimatic sensations (Tejeda and Rivas, 2001). The purpose of the analysis is to compare the base scenario with future scenarios; therefore we decided to use a simple index from among the many procedures employed for estimating conditions of hygrothermic comfort (for a review, see Epstein and Morán, 2006), since the results from this simple index –the effective temperature – present a variability similar to other more complex ones, such as the Environmental Stress Index (Morán and Epstein, 2006).
In order to elaborate the ET climatograms, it is necessary to have the hourly mean monthly temperature data (T hor), estimated from monthly means of extreme temperatures according to the procedure proposed by Tejeda (1991) and Tejeda and Rivas (2001):
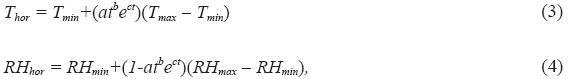
where RHhor is the hourly mean monthly relative humidity, a = 0.096, b = 2.422, c = 0.339, t is the hour of day starting from dawn, Tmax, Tmin, RHmax and RHmin are the 1981–2000 monthly means of maximum and minimum temperatures, and of maximum and minimum relative humidity.
The hourly mean monthly values from the base scenario 1981–2000 were added to the increases in the output of the scenarios for the 2030s and 2050s from the GFDL, Hadley and ECHAM models (Conde et al., 2008), plus the maximum result from the heat island divided by four, based on the arguments previously mentioned. Those were the entry data used for estimating the effective temperature under climatic change conditions (global plus urban).
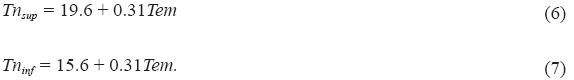
A neutral or comfortable temperature is preferred by the acclimated inhabitants of a specific site. A diversity of models exists in the relevant literature, but for this work we applied that of Auliciems and de Dear (1986):

where Tn is the neutral temperature and Tem is the mean monthly temperature.
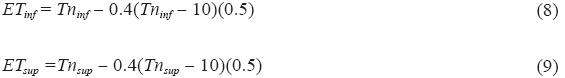
Nicol (2004) states that the interval of comfort around the neutral temperature depends on the amount of time available to the people for adaptation to their environment. Thus, he proposes ± 2 °C as an acceptable magnitude for an adaptation period of 24 h, but this could be expanded to as much as ± 5K, for example, if the period of analysis is longer than a week. Auliciems and Szokolay (1997) agree on the focus, but differ as to the magnitude, for they propose ±1.75 °C for a monthly period and ±2 °C for annual periods. It was decided to accept the latter value, so the upper and lower limits for the comfort interval of temperature are:
By substituting the value of the mean monthly temperature for the lower and upper neutral temperature in Eq. (2) and a value of 50% for the relative humidity, the effective temperature values for the comfort interval of each month are obtained for each city. This procedure is similar to the one that was applied for the standard effective temperature according to Norm ANSI/ASHRAE 55 (2004) or to Norm ISO 7243 (Parsons, 2006).
For the base scenario and for the projections to 2030 and 2050 (for the latter the increases attributed to the climatic change and the heat island were taken into account), we calculated the heat degree hours (HDH), that is, the "degrees of heat" needed to approach the comfort level when the values dropped below the lower limit of the ET index, and the cold degree hours (CDH) for those values above the upper limit of ET:
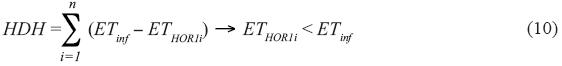
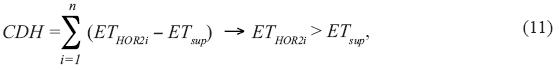
where HDH are the heat degree hours, CDH are the cold degree hours, ETinf is the lower limit of the comfort interval for each ET, ETsup is the upper limit of the comfort interval for each ET, ETHOR1i are all the hourly mean values of the indices lower than ETinf, ETHOR2i are all the hourly mean intervals of the índices higher than ETsup.
The same as in the case of the climatograms, results were obtained for the base scenario and the decades of 2030 and 2050.
2.3 Electrical consumption
The data and scenarios generated in the previous section were used to estimate the electrical consumption expected for the base scenario and the decades of 2030 and 2050. This information was completed with the data base from the INEGI (2005) population census for the eleven metropolitan areas listed in Table I.
The heating and cooling needs described in the previous section were converted into electrical consumption by following the procedure of García (2008), which in turn is based on that of Rodríguez et al. (2004). In general terms, it involves estimating the degree hours that require cooling during the warm semester of the year, and subtracting the degree hours of the cool semester. This difference is proportionately associated with the differences in domestic electrical consumption reported by the Comisión Federal de Electricidad.
For the cities of Hermosillo and Veracruz, comfort polls were carried out with simultaneous measurements of the hygrothermic conditions in the environment of those polled. By comparing the results of effective temperature at the time of the poll and the receipts of electrical consumption, it was possible to adjust the previously estimated datum. Thus, the cities studied in this work were catalogued in three types: those with warm dry climates, approaching the behavior of Hermosillo (H); the hot and humid ones, similar to that of Veracruz (V), and the intermediate ones (M), as shown in Table III.
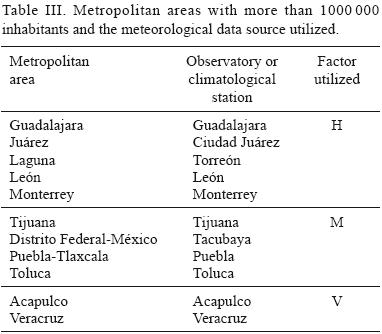
Table IV shows the factors for converting the coold–degree–hours into electrical consumption for the three types indicated in Table III (García, 2008).
In this way the increases in electrical consumption per domestic user were obtained.
A knowledge of demographic conditions is indispensable in order to speculate on future electrical consumption. Since each inhabitant requires a certain amount of vital space, it becomes evident that the nation's population cannot continue growing indefinitely in the future. Results obtained from various sources seem to indicate that, in the long term (after the year 2050), the national population will approach a state of zero growth, stabilizing between 175 and 250 million in habitants (Alonso et al., 1994).
By applying the procedure of Rodríguez et al. (2004) to the increase per user, it was considered that each current tap (user) would provide service for four persons. In this way the future increases in electrical consumption can be estimated through Eqs. (11) and (12). The results are shown in Figure 2.
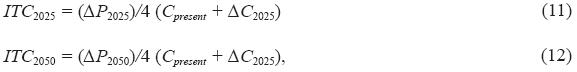
where ITC is the increase in total consumption, ΔP/4 is the increase in users, Cpresent is the average consumption at present and ΔC is the increase in electrical consumption due to climatic change.
3. Results
3.1 Climatograms
The comparative analysis of the climatograms shows differences regarding thermal sensations in the majority of cities for all of the models and scenarios utilized in respect to the base scenario. In some cases, the warming appears to be beneficial for those cities with a very cool climate (Toluca) or with very cold winters, in which the demand for heating energy might decrease. Figs. 1, 2, 3, 4 show the climatograms of four cities representing a hot humid climate (Acapulco), a hot dry one (Monterrey), a temperate one (México City) and a cool one (Toluca).
Upon comparing the conditions of the base scenario with future projections, the four representative cities show the tendencies of thermal sensations under the effects of global climatic change, as well as local change due to the effect of urbanization. In the case of Acapulco (Fig. 1), the thermal sensation corresponding to "hot," which extended over a large part of the nocturnal period during the summer months in the base scenario, disappears before an important expansion of "very hot." The sensation of comfort represented by "neutral" disappears entirely under the conditions of scenario 2050. The effects on the population resulting there from are evident, as will be seen later on from the increase in electrical consumption in an attempt to maintain a situation of comfort.
The conditions in the city of Monterrey (Fig. 2) will vary from "oppressively hot" to "extremely hot " for only a couple of hours in one month of summer in the scenario for 2050; the importance of this change resides in a longer period of heat that may make the nighttime oppressive and highly uncomfortable. The winter months will be reduced and will probably become the most comfortable season of the year.
México City (Fig. 3) will lose its cool and comfortable status to become comfortable and warmer in the summers of future scenarios. Fewer hours of cold due to a thermal neutrality in winter are likely to make the city more comfortable; during summer and at earlier hours, however, the warmth of the present scenario will increase noticeably, but apparently without becoming oppressive or exhausting. This increase in the city's temperature may then lead to an ever greater use of cooling methods that will result in a higher consumption of energy.
Toluca will be the only city in México having a population greater than a million inhabitants in which the effect of global warming will be beneficial regarding the amount of comfort that the climate can offer (Fig. 4). The extremely cold mornings of winter will tend to disappear and the environment will become more comfortable; even the midday warmth of summer will probably be extended into October. It may be, then, that the consumption of energy for heating will be reduced.
These results give an idea of the possibilities of discomfort in a not–too–distant future. They also indicate the requirements and demands of a population that will experience a growing need of comfortable environments, which will lead to an increase in the consumption of electrical energy for cooling. After an analysis of the climatograms elaborated for the circulation models that were considered (not shown for the eleven cities), ECHAM perhaps shows the extreme values, but without any important differences from the rest.
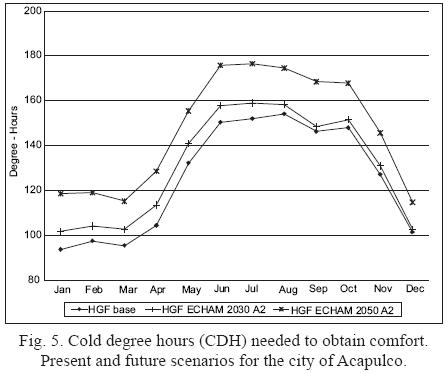
The effects of the temperature increases associated with climatic change and the heat island on the level of comfort make it necessary to calculate the HDH and CDH. The following results are presented for the present conditions and the scenarios for 2030 and 2050, considering the model MPI ECHAM 5 for the cities of Acapulco, Monterrey and México City as representing the hot–humid, hot–dry and temperate climates, respectively.
Figures 5, 6, 7 show the HDH and CDH required to attain levels of comfort in average monthly conditions. In Figure 5 we see that for the city of Acapulco the cooling needs are between 100 and 180 CDH, with no heating required at any time of the year.
In the city of Monterrey (Fig. 6) we observe that, during the winter season, the two situations can occur, but at different hours of the day. It is then that the HDH reach their maximum value, only to disappear completely in the middle of spring and all of summer (HDH = 0). The CDH, on the other hand, increase drastically during summer.
In México City (Fig. 7) the heating requirements are, and will continue to be, greater than those of cooling in future scenarios, mainly during the cool months of the year (October to February), considered as winter.
These cities, along with many others, will be affected by the warming tendency illustrated by the ECHAM model, in this case, in the projections for 2030 and 2050. Acapulco is expected to increase its average conditions; Monterrey will reduce its needs of HDH and will increase those of CDH; finally, México City will be able to reduce its heating needs, which will make it more comfortable as the cold of winter diminishes.
3.2 Scenarios of electrical consumption
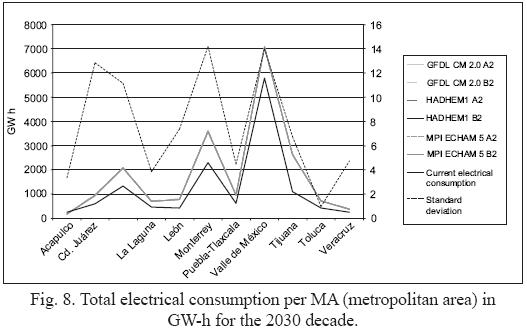
Figure 8 shows the scenarios of expected electrical consumption per metropolitan area obtained for 2030; from these it can be seen that Monterrey, Guadalajara and the Valley of México are the greatest consumers, due mainly to the growing demand of their populations. In contrast, a decrease in population is expected for the metropolitan area (MA) of Acapulco, which would diminish the total demand. The lower line shows the present consumption for each MA and the electrical scenarios of the models; their emission scenarios can be observed superposed on the middle line, while the dotted line shows the standard deviation among the different scenarios of each model.
Similarly, Figure 9 shows the electrical scenarios for the decade of 2050, but in these, the population is considered as being stabilized, so the only increase will be due to the expected global warming. Notwithstanding its similarity to Figure 8, here we observe a slight increase and a greater variability among the results obtained from each model with their respective scenarios.
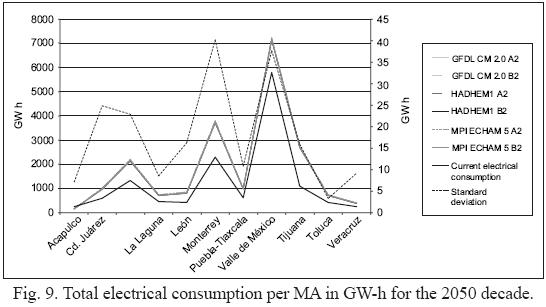
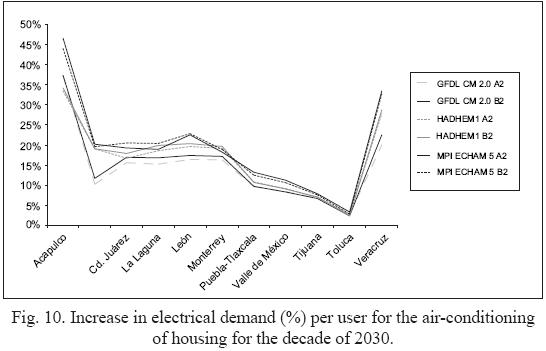
Figure 10 shows the percentile increase per user for the 2030s in different MA; here, a higher electrical consumption is expected for coastal cities like Acapulco and Veracruz in comparison with other cities. On account of the methodology employed, no significant increase is expected for the MA of Toluca. It should be noted that the highest results were obtained from the ECHAM model and the lowest ones from the GFDL model.
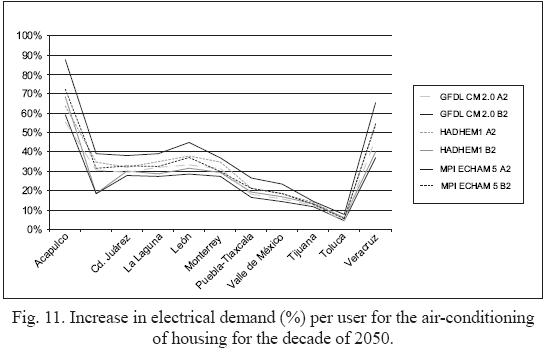
The percentile increase per user for the 2050 in the different MA shows that a greater tendency is expected for Acapulco and Veracruz, very similar to the previous one but with a slight increase in the results, as shown in Figure 11.
4. Final comments
A practical methodology for generating bioclimatic urban scenarios in the face of changing climatic conditions has been demonstrated. The thermal increases expected from global warming and those induced by urbanization were considered. Calculating the conditions of neutrality for the base scenario and for future ones, made it possible to take human acclimatization into account. The urban warming estimated from the base scenario into the first quarter of the century runs from 1.0 to 1.6 °C, depending on the size of the urban area, that is, it is comparable to global warming.
The final result can be seen from the expected electrical consumption. Figures 10 and 11 show the increases per user in electrical demand in the studied metropolitan areas for the decades of 2030 and 2050. The total increase in consumption for these urban areas will be 20 000 GW–h for 2030 and 20 540 GW–h for 2050. It should be remembered that in estimating these increases, both global and urban warming as well as population growth were taken into account, but the effect of acclimatization was discounted. The most important increases will occur at the hottest sites, Acapulco and Veracruz.
Finally, it should be recognized that in this analysis an improvement in the technology for acclimating buildings, which could lower the estimates presented here for future scenarios, has not been considered.
Acknowledgments
This paper was supported by the project Generation of climatic change settings at a regional scale, for 2030 and 2050; Evaluation of the vulnerability and the options of adaptation of human settlements, biodiversity, and the livestock, forestry and fishing sectors in the face of impacts from climatic variability and change; and training and technical assistance for state specialists who will elaborate state programs for climatic change. This final report is part of the research carried out by the Fourth National Communication of México before the United Nations Framework Convention on Climate Change. Guillermo García Grijalba and Mario Casasola helped in realizing the calculations. The translation from Spanish is of Mr. Warren Roger Haid Holzinger, from the Universidad Veracruzana (México).
References
Alonso A., R. Cruz and E. Fugarolas, 1994. Futuros de los recursos energéticos, In: El sector eléctrico de México (D. Reséndiz Núñez coordinator), Comisión Federal de Electricidad and Fondo de Cultura Económica, México, 427–475. [ Links ]
ANSI/ASHRAE 55, 2004. Thermal Environmental Conditions for Human Occupancy. American Society of Heating, Refrigerating, and Air–Conditioning Engineers / 16–Apr–2004 / 30 pages. [ Links ]
Arnfield A. J., 2003. Two decades of urban climate research: a review of turbulence, exchanges of energy and water, and the urban heat island. Int. J. Climatol. 23, 1–26. [ Links ]
Auliciems A. and R. de Dear, 1986. Air– conditioning in Australia: Human thermal factors. Architectural Science Review 29, 67–75. [ Links ]
Auliciems A. and S. Szokolay, 1997. Thermal Comfort. Notes of Passive and Low Energy Architecture International. No. 3. Brisbane: PLEA – University of Queensland. [ Links ]
Bicknell J., D. Dodman and D. Satterhwaite, 2009. Adapting cities to climate change. Understanding and addressing the development challenges. Earthscan, London, 397 pp. [ Links ]
CONAPO, 2009. Proyecciones de la población de México 2005–2050. http://www.conapo.gob.mx/index.php?option=com_content & view=article & id=36 & Itemid=234. July 2009. [ Links ]
Conde C., B. Martínez, O. Sánchez, F. Estrada, A. Fernández, J. Zavala and C. Gay, 2008. Escenarios de cambio climático (2030 y 2050) para México y Centro América. Temperatura y Precipitación. [On line document]. http://www.atmosfera.unam.mx/gcclimatico/index.php?option=com_content & view=article & id=61 & Itemid=74. [ Links ]
Epstein Y. and D. S. Moran, 2006. Thermal comfort and the heat stress indices. Ind. Health, 44, 388–398. [ Links ]
García– Grijalva G., 2008. Equivalencias de consumos eléctricos domésticos a índices de bioclima humano para siete ciudades cálidas de México. Bachetor thesis on Atmosferic Sciences. Universidad Veracruzana. 105 pp. [ Links ]
INEGI, 2005. II Conteo de población y vivienda 2005. Instituto Nacional de Estadística y Geografía. México. [ Links ]
Jáuregui E. and A. Tejeda–Martínez, 2004. Cuatro décadas de climatología urbana en México. Estudios de Arquitectura Bioclimática, VI, 163–178. UAM Iztapalapa and Editorial Limusa, México. [ Links ]
Luyando E., A. Tejeda, M. Casasola, G. García and E. Jaúregui, 2009. Asentamientos Humanos. Reporte Final del proyecto: Generación de Escenarios de Cambio Climático a Escala Regional, al 2030 y 2050; Evaluación de la Vulnerabilidad y Opciones de Adaptación de los Asentamientos Humanos, la Biodiversidad y los Sectores Ganadero, Forestal y Pesquero, ante los Impactos de la Variabilidad y el Cambio Climáticos; y Fomento de Capacidades y Asistencia Técnica a Especialistas Estatales que Elaborarán Programas Estatales de Cambio Climático. INE/UNAM. México, DF. 25 pp. [ Links ]
Morán D. S. and Y. Epstein, 2006. Evaluation of the Environmental Stress Index (ESI) for hot/dry and hot/web climates. Ind. Health 44, 399–403. [ Links ]
Missenard A. 1937. L'Homme et le climat, Eyrolles, París. [ Links ]
Nicol J. F., 2004. Adaptive thermal comfort standards in the hot–humid tropics. Ener. Buildings 36, 628–637. [ Links ]
Parsons K., 2006. Heat stress Standard ISO 7243 and its global application. Ind. Health, 44, 368–379. [ Links ]
Rodríguez L., A. Tejeda–Martínez and G. Utrera–Zárate, 2004. Demanda eléctrica para enfriamiento residencial en el estado de Veracruz ante la duplicación de CO2 atmosférico. Estudios de Arquitectura Bioclimática, VI, 325–338. [ Links ]
Tan J., Y. Zheng, X. Tang, Ch. Guo, L. Li, G. Song, X. Zhen, D. Yuan, A. J. Kalkstein, F. Li and H. Chen, 2009. The urban heat island and its impact to heat wave and human health in Shanghai. Int. J. Biometeorol. DOI 10.1007/s00484–009–0256–x. [ Links ]
Tejeda M. A., 1991. An exponential model of the curve of mean monthly hourly air temperature. Atmósfera 4, 139–144. [ Links ]
Tejeda A. and D. Rivas, 2001. Un escenario de bioclima humano en ciudades del sur de México, bajo condiciones de 2CO2 atmosférico. In: El tiempo del clima (A. J. Pérez–Cueva, E. López–Baeza and J. Tamayo–Carmona, Eds.). Asociación Española de Climatología Serie A, No. 2, 574, 551–562. [ Links ]
Zhou Y. and J. M. Shepherd, 2009. Atlanta's urban heat island under extreme heat conditions and potential mitigation strategies. Nat. Hazards, DOI 10.1007/s11069–009–9406–z. [ Links ]

