


Servicios Personalizados
Revista
Articulo
 Inglés (pdf)
 Artículo en XML
 Referencias del artículo
 Enviar artículo por email
Indicadores
-
 Citado por SciELO
 -
 Accesos
Links relacionados
-
 Similares en
SciELO
Similares en
SciELO
Compartir

 Permalink
Atmósfera
versión impresa ISSN 0187-6236
Atmósfera vol.23 no.4 Ciudad de México oct. 2010
Air pollution from fireworks during festival of lights (Deepawali) in Howrah, India – a case study
B. THAKUR
Department of Civil Engineering, Meghnad Saha Institute of Technology,
East Kolkata Township, Kolkata–700107, West Bengal, India. Corresponding author: b2981975@yahoo.co.in
S. CHAKRABORTY
Department of Sanitary Engineering, All India Institute of Hygiene and Public Health, Kolkata–700073, West Bengal, India.
Public Health Engineering Directorate, Government of West Bengal, 1 Kiran Shankar Roy Road, New Secretariat Building, Kolkata–700001
A. DEBSARKAR, S. CHAKRABARTY
Department of Civil Engineering, Jadavpur University, Kolkata–700107, West Bengal, India
R. C. SRIVASTAVA
Department of Sanitary Engineering, All India Institute of Hygiene and Public Health,
Kolkata–700073, West Bengal, India
Received September 22, 2009; Accepted July 30, 2010
RESUMEN
La actividad de "pirotecnia" durante las celebraciones festivas locales pueden causar una contaminación del aire intensa y a corto plazo. Deepawali (fiesta de la luz) es una fiesta anual que se celebra en la India durante los meses de octubre o noviembre, con gran actividad en la atmósfera de fuegos artificiales. La concentración de contaminantes atmosféricos tales como SPM (partículas en suspensión), PM10, PM2.5, SO2 y NO2 fue monitoreada durante seis días consecutivos en Salkia, una zona densamente poblada y residencial, cerca de Calcuta en la India, con el fin de evaluar el impacto que los fuegos artificiales presentan sobre la calidad del aire. Las concentraciones de contaminantes registradas fueron varias veces superiores a lo habitual con referencia a un típico día de invierno (6.44 veces superior para SPM, 7.16 veces para PM10, 5.35 veces para PM2.5, 1.73 veces para SO2 y 1.27 veces para NO2). Los resultados han mostrado la gran aportación que los fuegos artificiales generan en los niveles de concentración de los diferentes contaminantes atmosféricos. Las concentraciones de partículas superaron ampliamente sus respectivos valores normales, en promedio de 24 horas, (11.6 veces para SPM, 22.3 veces para PM10, y 34.3 veces para PM2.5). Además se midieron concentraciones de metales tales como Ba, Cu, Cd, Pb, Hg, encontrándose un intenso incremento en sus valores promedios diarios con respecto al día anterior (56.72, 79.00, 16.67, 14.86, 12.00, 6.26 veces respectivamente). El probable impacto sobre la salud de los habitantes de la zona de análisis debido al incremento de los contaminantes atmosféricos, a pesar de ser un episodio de corta duración, se estima mediante una simulación de Monte Carlo con la determinación del índice de riesgo relativo respecto de la mortalidad y morbilidad en los individuos expuestos y resultó ser sumamente alto. Finalmente se sugiere realizar algún tipo de control o disminución de los fuegos artificiales durante estas celebraciones, con el fin de disminuir los riesgos en la población.
ABSTRACT
Fireworks display during festive celebrations can cause acute short term air pollution. Deepawali –the festival of light– is celebrated in India, every year during October or November with great fireworks display. Concentration of air pollutants such as SPM (suspended particulate matter), PM10, PM2.5, SO2 and NO2 were monitored for six consecutive days during Deepawali in Salkia, a densely populated residential area near Kolkata, India, for assessing the impacts of fireworks on ambient air quality. The pollutant concentrations as recorded on Deepawali were found to be several times higher (6.44 times for SPM, 7.16 times for PM10, 5.35 times for PM2.5, 1.73 times for SO2 and 1.27 times for NO2) compared to a typical winter day value. The results indicated the huge contribution of fireworks on the pollutant levels. The particulate concentrations on Deepawali exceeded its respective 24 hour residential standards by several times (11.6 times for SPM, 22.3 times for PM10, and 34.3 times for PM2.5). Concentrations of metals like Ba, Cu, Cd, Pb, Hg, Al in collected PM2.5 were found to be increased by many times on Deepawali (56.72, 79.00, 16.67, 14.86, 12.00 and 6.26 times, respectively) compared to the previous day. The probable health impact of this huge though short–lived deterioration of the ambient air quality is estimated through Monte Carlo's simulation in terms of increase in relative risk of mortality and morbidity in exposed individuals and found to be extremely high. It suggests some controls on fireworks during festive celebrations.
Keywords: Air pollution; firework; festival; health impact, relative risk.
1. Introduction
In India, Festival of Light (Deepawali) is an important occasion celebrated every year during October or November. Large quantities of fireworks are displayed during the festival.
Fireworks contain chemicals such as potassium nitrates, potassium chlorate, potassium perchlorate, charcoal, sulfur, manganese, sodium oxalate, aluminum and iron dust powder, strontium nitrate, and barium nitrate, etc. (Ravindra et al., 2003; Wang et al., 2007). These firecrackers when burnt can release various gaseous and particulate air pollutants and toxic metals to significant quantity and degrades the air quality as a whole. In California, USA a study following the Fourth of July holiday reveals significant increase in the levels of ambient air magnesium, aluminum, potassium lead, barium, strontium, and copper. The study also reports the original chemical composition and particle size of typical firework mixtures (Liu et al., 1997). A laboratory study revealed that highly toxic contaminants like polychlorinated dioxins and furans are produced during the display of fireworks like "blue lightning rockets" and "fountains" (Fleischer et al., 1999). The chemical composition and chemically resolved size distributions of fine aerosol particles were measured during the New Year's 2005 fireworks in Mainz, Central Germany (Drewnick et al., 2006). A detailed study of air pollution caused by firework display during lantern day festival in Beijing reported 57, 25, and 183%, respectively, increase in SO2, NO2, and PM10 levels over previous day. The PM2.5 concentration was found to be 6 times higher over normal day. Analysis of different elements and ions in fine particulates revealed that over 90% of the total mineral aerosol and 98% of Pb, 43% of total carbon, 28% of Zn, 8% of NO3–, and 3% of SO42– in PM2.5 were from the emissions of fireworks on the lantern night (Wang et al., 2007). In Milan, Italy a study on chemical–physical properties of airborne particles during a fireworks episode reported one hour concentration of elements like Sr, Mg, Ba, K and Cu increased by 120, 22, 12, 11 and 6 times (Vecchi et al., 2008). On 2nd January, 2005 the Victoria Advocate reported firework display on New Year celebration in México City "left a dense gray pall over much of city" and described the air as more polluted over a normal Saturday. Ozone level was reported to climb 190 on a scale with normal cut–off level of 100 (Victoria Advocate, 2005).
Studies about the air quality during such fireworks display have also been carried out in India. Attri and coworkers reported display of fireworks could produce ozone (O3), a strong and harmful oxidizing agent, at the ground level without the participation of NOX (Attri et al., 2001). In Thiruvananthapuram, India a study about the effect of firework display during Deepawali on the mass concentration of atmospheric black carbon reveals over 3 times increase compared to normal days (Babu and Moorthy, 2001). In Hisar, India a study about the short term variation in air quality during Deepawali reported 2 – 10 times increase in concentrations of PM10, TSP (total suspended particulates), NO2 and SO2 over a typical winter day (Ravindra et al., 2003). In Hyderabad, India a study of various metals in firework borne particles during Deepawali reported about 1091, 25, 18 and 15 times, respectively, increase in the concentrations of Ba, K, Al and Sr over a normal day (Kulshrestha et al., 2004). In Lucknow, India a study on different air pollutants during Deepawali revealed an average increase in PM10, SO2, NOX concentrations over pre–Deepawali period and a normal day by 2.49 and 5.67 times, 1.95 and 6.59 times, and 1.79 and 2.69 times, respectively. The PM10 samples were further studied for trace metals like Ca, Fe, Zn, Cu, Pb, Mn, Co, Cr, Ni, Cd and their values were found to be higher than normal days and pre–Deepawali period except Fe (Barman et al., 2008). Similar short–term degradation in air quality of episodic nature has been observed in several studies at different urban locations of India carried out during Deepawali by Central and State Pollution Control Boards in recent years (CPCB, 2007).
The objective of the present study was set to monitor air quality parameters such as SPM, NRPM (non respirable particulate matter), PM10 or RPM (respirable particulate matter), PM2.5 or FPM (Fine Particulate Matter), Sulfur Dioxide (SO2) and Nitrogen Dioxide (NO2) on and around the day of Deepawali in the year 2007. The results are compared with typical winter day concentration levels for the chosen parameters and with the ambient air quality standards. The probable health impact for observed short–term degradation in air quality is also estimated in terms of percentage increase in relative risk of mortality and morbidity.
2. Methodology
2.1 Site description
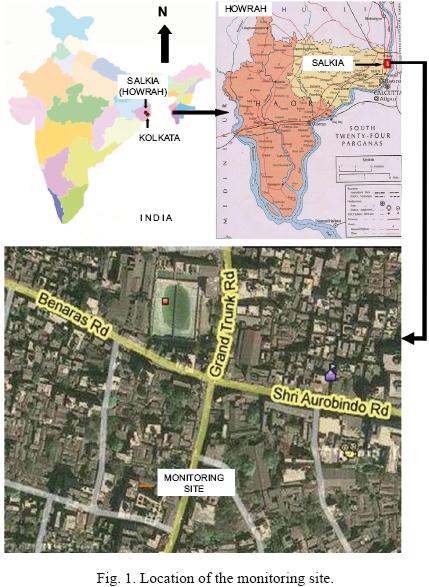
Salkia (22°35'N, 88°21'E, 21 m above mean sea level), a densely populated residential area located at Howrah within the limits of Greater Calcutta (Kolkata) Metropolitan Area, was chosen as the monitoring site for the present study. Howrah is surrounded by a number of (about 30 000) small and medium scale industries such as coal and iron processing industries, iron foundries, re–rolling mills, chemical industries, etc. Different air pollutants in significant quantity are released in the atmosphere by these industries and automobiles. The city has been identified as one of the twenty–four critically polluted areas in the country by CPCB, India. Figure 1 shows the location of the sampling site.
The monitoring station was chosen on the terrace of a two–storied private building in a densely populated residential area, surrounded by small and medium scale industrial units.
The terrace was chosen for sampling because the nearby houses have roof spaces which are generally used by the residents for firework display. In addition, this height can be considered as the respirable zone for people in 2–3 storey buildings.
2.2 Details of the monitoring work
The monitoring work was done for a total number of eight days spanned between November 7 to 25, 2008 and divided into two segments. The first segment consisted of six consecutive days (two days before and three days after Deepawali, to assess the variation in air quality due to firecrackers during the Deepawali period. The second segment consisted of two days (eleventh and fifteenth day after Deepawali). It was included to obtain the base line concentrations of the air pollutants.
The pollutant parameters measured during the study include different particulate species viz. SPM, NRPM, PM10, and PM2.5, and gaseous pollutants such as SO2 and NO2. Different meteorological parameters such as temperature, dew point, relative humidity, wind speed and wind direction are also recorded during the monitoring period on the monitoring days with one hourly resolution.
During Deepawali, fireworks are started at the evening. Therefore, a monitoring duration of 8 hours were maintained on each monitoring day encompassing the peak period of firecracker display spanned from 5:00 pm evening to 1:00 am midnight (local time, LT). Thus the results show 8–hourly averaged values for pollutant concentrations.
2.3 Instrumentation
2.3.1 Sampling and analysis of particulates
Standard gravimetric method of high–volume sampling was used to measure the mass concentrations of SPM, NRPM, and PM10. The instrument employed was respirable dust sampler (RDS) (Envirotech, New Delhi, Model: APM–460) with provision for gaseous sampling (Envirotech, New Delhi, Model: APM–411). The operating flow rate of the machine is 0.8–1.2 m3 min–1 with minimum detectable concentration of 1µg m–3.
Gravimetric method is also used for measuring the mass concentration of PM2.5. The instrument employed is fine particulate sampler (FPS) (Envirotech, New Delhi, Model: APM–550). The operating flow rate for the machine is 1m3 h–1 (± 5%), which separates particulates with larger diameter. The NRPM fraction (>10µm) is separated in the inlet surface of the machine. The particle fraction of 10 – 2.5 µm diameter is separated at an impactor surface of glass fibre filter (Whatman GF/A 37 mm dia) wetted with silicon oil. The PM2.5 fraction escaping the impactor is collected on a teflon membrane filter (Whatman of 47 mm dia). Dividing the difference between initial and final weights of the teflon membrane filter by the total volume of air sampled gives the mass concentration for PM2.5.
All gravimetric measurements are taken precisely in a digital balance (Mettler–Toledo, Model: AB 135–S, Precision: 0.01mg).
2.3.2 Analysis of metals
The metal analysis for 13 metals and metalloids viz. Al, As, Ba, Ca, Cd, Cr, Cu, Hg, K, Mg, Na, Pb and Sn were done in the PM2.5 samples collected on the previous day of Deepawali (November 8, 2007) and the day of Deepawali (November 9, 2007). Nitric acid is used to digest the selected 47 mm dia. filters collecting PM2.5 on a hot plate. For each sample the digestion is continued to reduce the final volume of the sample to 2–3 mL. It is then filtered using filter paper (Whatman 42) and the filtrate is diluted using doubled distilled water to 25 mL. Similar samples are prepared for blank filter papers also. Each of the filtrates was then examined for the concentration of the mentioned metals by AAS (atomic absorption spectrophotometer: Varian, model: Spectra AA50). To get the final concentration results of the blank samples are subtracted from the exposed samples for each of the metals.
The concentration of metals in the samples is then multiplied by the sample volume (i.e. 25 mL) to get the mass of each metal in the samples. These values are subsequently divided by corresponding total volume of sampled air to get the concentration of metals in the sampled air.
2.3.3 Sampling and analysis of SO2 and NO2
Colourimetric method is used for gaseous (SO2 and NO2) sampling. The instrument employed for gaseous sampling is APM–411 fitted and run simultaneously with APM–460 RDS. The impingers of 35 mL capacity were filled with appropriate absorbing reagents, i.e. potassium tetrachloromercurate (TCM) for SO2 and sodium hydroxide with sodium arsenite for NO2. Air is sucked through the absorbing reagents in the impingers at a flow rate of 1 L m–1. The reagents after reacting with the corresponding gases are analysed colorimetrically in the laboratory. SO2 was analyzed employing the modified West–Gaeke method on a spectrophotometer at a wavelength of 560 nm. NO2 was also analyzed employing the modified Jacob Hochheiser method on the spectrophotometer at a wavelength of 540 nm. Colorimetric measurements were carried out in an UV–visible recording spectrophotometer (Make: Shimadzu, model: UV–2100). Chemicals (Merck, GR–Grade) along with demineralized (DM) water were used for preparation of all the reagents and the blanks.
2.3.4 Monitoring of meteorological parameters
All the meteorological parameters are measured and recorded employing a portable, automatic meteorological monitoring system named wind monitor (Envirotech, New Delhi, model: WM–251) with one hour resolution.
2.3.5 Placement of monitoring instruments at the monitoring location
All the monitoring instruments, i.e. one APM–460 (for SPM, NRPM and PM10) with APM–411 attachment (for SO2 and NO2), one APM–550 (for PM2.5) and the meteorological monitoring system were placed on the rooftop of the said building. To avoid mutual interference APM–460 and APM–550 were placed 3m apart from each other in such a way to provide 120° conical open air space for both of them. The machines were also placed on 1m high wooden tables to avoid any obstruction caused by the 1m high parapet walls round the roof. The anemometer and the wind vane assembly connected to the meteorological monitoring system were kept on a 1.5 m high portable mast.
2.4 Estimation of the probable health impact
In epidemiological studies, the health impact is generally measured in terms of 'relative risk (RR)'. The term relative risk (RR) means the ratio of the risk estimates for the exposed (Pexposed) and control populations (Pnon–exposed) and represents the number of times that disease is more (or less) likely to occur in the exposed as compared with the unexposed group (WHO, 2006). It can be expressed by Eq. (1) as follows:

In order to estimate the health impact of the short–term degradation of air quality during Deepawali, results of existing epidemiological studies are utilized. Percentage increase in relative risk of mortality and morbidity due to short–term exposure to increased level of air pollutant concentrations is used as the evaluating parameter for health impact. The values for such increases in RR of mortality and morbidity are collected and averaged for specified increase in pollutant concentrations. The average increase in pollutant concentration (PolConcChange) in Salkia, for each monitoring day over the baseline concentration, is multiplied by the average values of increase in RR of mortality and morbidity (RRIncrease_Avg) in estimating the percentage increase in RR of mortality and morbidity (Percent_RRIncrease) for Salkia as shown in Eq. (2). The said increments in RR and the related statistical distributions are obtained by conducting Monte Carlo's simulation using 'Goldsim' Software.

3. Results and discussion
The meteorological parameters recorded at an hourly resolution during the monitoring period on the monitoring days and the average values with mean and standard deviation are presented in Table I. The data shows that meteorology remained more or less the same during two segments of the monitoring (i.e. six consecutive days during Deepawali and two days sufficiently after Deepawali) and was not likely to produce any significant influence on the variation in air quality. During the monitoring period (i.e. evening) the weather was a little hazy or misty. The sky remained more or less clear with a few scattered clouds sometime. As per Pasquill stability class, local atmosphere remained moderately stable (F) to strongly stable (G) (Turner, 1994). The prevalent wind directions were recorded to be N and NNE.

Results of the monitoring work for all the eight days spanned between 07.11.2007 to 25.11.2007 are presented in Table II. 8–hourly average concentrations of different particulate species (i.e. SPM, NRPM, PM10, and PM2.5) and gaseous pollutants (i.e. SO2 and NO2) are presented. Intercorrelations of the monitored pollutants are calculated and the correlation matrix (for Pearson correlation co–efficient) is presented in Table III.


The percentage increase in RR of mortality and morbidity due to short–term exposure to increased concentration of PM10 and PM2.5 is studied by many researchers and the values are well documented (Levy et al., 2000; Steib et al., 2002, 2003; Dominici et al., 2003; Katsouyanni et al., 2003; Anderson et al., 2005; COMEAP, 2006; Analitis et al., 2006). Pope and Dockery (2006) made a review on all such studies. The averages of the said studies are calculated and presented in Table III. The distributions are assumed to be normal and used into the simulation model described in Equation (2) to calculate the percentage increase in RR of mortality and morbidity, due to increase in short–term exposure levels of PM10 and PM2.5 concentration on Deepawali for Salkia.
Results obtained for each of the pollutants will be discussed separately in the subsequent sections along with their probable health effects.
3.1 Particulate matters
The percent increases of particulates in Deepawali are presented in Fig. 2. Particulates, namely SPM, NRPM, PM10 and PM2.5 have increased considerably in Deepawali. The PM10 and PM2.5, which have greater impacts on health, have been found to increase by more than 6 and 4 times, respectively, over the baseline levels. For PM10, the NAAQS of India has been exceeded by about 21 times. There is no Indian standard for PM2.5. However, the US EPA standard for PM2.5 has been exceeded by more than 33 times.
High concentrations of SPM, PM10 and PM2.5 in Deepawali, as well as higher correlations among, these as observed in Table IV seem to indicate the fireworks as the main emission source. No such correlations and concentration variation is observed for the coarser NRPM fraction. It indicates sources other than the fireworks as the main contributor for NRPM. In other words, fireworks are the major sources for the harmful finer particulates in Deepawali.

3.1.1 Health impact for particulate matters
The exposure to particulate matter is reported to have caused chronic respiratory and cardio–vascular diseases, alter host defense, damage lung tissue, lead to premature death and contribute to cancer (Seaton et al., 1995; Bates, 1996; Pope et al., 2002). Particles with aerodynamic diameter less than 10µm (PM10) only can be respired to reach to the lungs. Even finer fractions popularly known as fine particulate matter (FPM), with aerodynamic diameter less than 2.5µm (PM2.5), can penetrate the lungs further to alveolar level and can aggravate the problem even more (Dominici et al., 2006; Pope et al., 2006). Recent epidemiological studies clearly establish the relation between the harmful effects on human health and mortality with increased concentration of atmospheric particulates (Dockery et al., 1993; Schwartz, 1993; Levy et al., 2000; Steib et al., 2002, 2003; Dominici et al., 2003; Katsouyanni et al., 2003; Pope et al., 2004; Anderson et al., 2005; Chen et al., 2005; Analitis et al., 2006; COMEAP, 2006; Pope and Dockery, 2006; Torén et al., 2007).
The probable health impact for this short–term acute increase in particulate concentrations in Deepawali is estimated through Monte–Carlo's simulation. The simulation was run for ten thousand times in each case. The histograms of the estimated percentage increase in RR of cardiovascular mortality, respiratory mortality and cardiovascular morbidity for the increase in PM10 concentration in Deepawali over the baseline value, that is the concentrations on 25.11.2007, is presented in Figure 3(a–c). In Figure 3d, the trend of percentage increments of RR is presented.
The histograms of the estimated percentage increase in RR of cardiovascular mortality, respiratory mortality and cardiovascular morbidity for the increase in PM2.5 concentration on the day of Deepawali over the baseline value, that is the concentrations on 25.11.2007, is presented in Figure 4(a–c). In Figure 4d, the trend of percentage increments of RR during the monitoring period is presented.
3.2 Sulfur dioxide and nitrogen dioxide
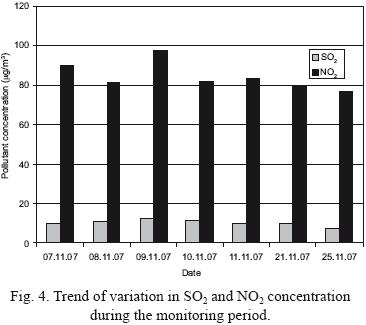
The gaseous pollutants SO2 and NO2 gradually increased to peak values in Deepawali and thereafter decreased to baseline level that is the concentrations on 25.11.2007. The percentage increase in concentrations over baseline and 24 hour NAAQS, India standards are reported in Figure 5(a–b). The percentage increments over baseline concentrations are observed to be more pronounced in SO2 than that of NO2. However, the SO2 level remained much lower than that prescribed in 24 hour standard for residential areas. The NO2 concentrations, on the other hand, are found to be slightly higher than the 24 hour standard for residential areas during the first segment of the study and just complying it during the second segment as observed in Figure 5. Since the SO2 and NO2 levels are within the prescribed NAAQS, India standards the probable health effects have not been estimated.
The temporal variations of SO2 and NO2 are found to be correlated with SPM, PM10 and PM2.5 indicating that these sources are probably from the fireworks. The high baseline concentration of NO2 on the baseline date that is the 25.11.2007 does suggest alternate source of NO2 in the locality, possibly the emission from automobiles in the nearby roadways.
3.3 Metals
Concentrations of 13 metals and metalloids viz. Al, As, Ba, Ca, Cd, Cr, Cu, Hg, K, Mg, Na, Pb and Sn were measured in the PM2.5 samples collected on the previous day of Deepawali (08.11.07) and on the day of Deepawali (09.11.07). Some of the metals viz. Hg, Na, K, Mg, Ca, As, Cr, Sn, Al were below detectable limits. The remaining results are shown in Table V.

Similar studies were carried out in Hyderabad (Kulushrestha et al., 2004) and Lucknow (Barman et al., 2008) during Deepawali. However, both the studies reported metal concentrations in coarser fraction of particulates (PM25 in Hyderabad and PM10 in Lucknow) unlike the present study where concentrations have been reported in the finer fraction of PM2.5. The PM2.5 has been selected in the study because of its serious impact on public health. Since the particulate sizes are different the results are not truly comparable. The percentage increase of the Deepawali concentration of metals like Ba, Pb, Cu, Cd and Hg over the previous day concentrations as obtained from these studies along with the present study are shown in Figure 6 for comparison. The percentage increase is presented in logarithmic scale to fit the findings appropriately.

The order of concentration of metals on the Deepawali is reported in Table VI for these studies for comparison. Metals like Na, K, Mg, Ca, As, Cr and Al, which were found in high concentration in the coarser fraction of particulates in Hyderabad and Lucknow, are found to be below detectable limit in the finer fraction during the present study. It seems to suggest that metallic species from fireworks should be classified under different size categories.

3.4 Comparison of the results with similar studies
Similar air quality studies have been carried out during Deepawali in Hisar (Ravindra et al., 2003) and Lucknow (Barman et al., 2008). These studies have reported similar patterns of deterioration of short–term air quality. Results of the present study are compared with these studies for SPM, PM10, SO2 and NO2. In order to normalize the results of different studies concentrations of pollutants in Deepawali for each study are considered as 100% and other concentrations are calculated as its fraction. The results are presented in Figure 7(a–d).
It may be observed in Figure 7 (a and b) that the percentage rise of particulates in Deepawali over a normal day is pronounced for Salkia than that of Hisar or Lucknow. The graphs in Figure 7(c and d) indicate that concentration rise of SO2 and NO2 in Deepawali over a normal day are least pronounced in Salkia than that of Hisar or Lucknow.
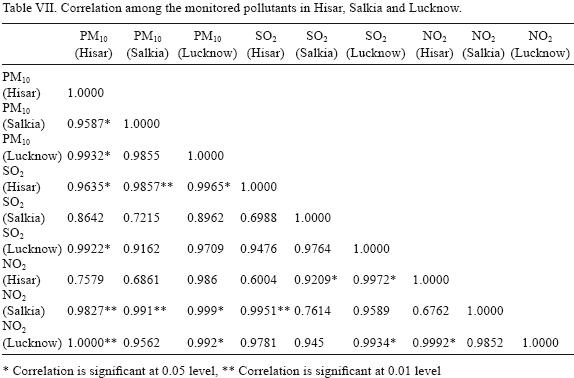
The present and similar studies, namely Hisar (Ravindra et al., 2003) and Lucknow (Barman et al., 2008) consistently indicate acute short term increase of particulate matter in Deepawali. Inter–correlations of the monitored pollutants for these studies are calculated and the correlation matrix (for Pearson correlation coefficient) is presented in Table VII. The findings seem to suggest that the temporal variations of particulate levels are correlated in all Deepawali studies. The similarities among the studies tend to establish the fact that acute increase of particulates in Deepawali is not just an isolated event in the test site but a phenomenon of urban India.
The meteorological factors have substantial impacts on ambient concentrations. In Deepawali season, calm condition generally prevails in India that causes to aggravate the air quality status. For example, the meteorological factors of the present study along with the three referred studies are presented in Table VIII which indicates more or less calm conditions in all sites.

The particulate concentrations observed in Deepawali are of episodic scale. The US EPA originally suggested 1000µg/m3 as the threshold of episodic condition (USEPA, 1971) that is further reduced lately (RIDEM, 2003). The present as well as the referred studies indicate that episodic limit set by US EPA is routinely breached during Deepawali festival.
4. Conclusion
Concentrations of pollutants such as SPM, RPM or PM10, FPM or PM2.5, SO2, NO2 are monitored during the celebration of Deepawali festival in a densely populated residential area in Salkia, Howrah, India, for assessing the air quality impacts of fireworks. The samplings were conducted for six consecutive days during Deepawali and two days after Deepawali. All the pollutants showed similar variation pattern during the monitoring period. The concentrations increased steadily to the peak on Deepawali and declined thereafter. The comparisons of metals with other studies indicate the need for further investigations in the finer PM2.5 range.
The temporal variation is similar to other studies conducted in Deepawali suggesting that the problem is rampant in urban India. The peak concentrations of particulates exceeded the NAAQS, India 24 hour standard. The concentrations actually exceeded the threshold limits of episodic condition as specified in US EPA. The SO2 concentration remained below the 24 hour residential standard and NO2 concentration was found to be slightly higher than the same.
Short term exposure to such episodic levels of pollutants is likely to cause acute health effects to exposed individuals. The RR of cardiovascular mortality was found to increase by as high as 125.11% and the same for cardiovascular morbidity was found to be 175.16% over a normal winter day. In the present study, the RR of mortality and morbidity is obtained from epidemiological studies conducted in USA, where average ambient temperature is lower. The utilities of these values might be of limited use in the present circumstances. Further research is required for validation of dose response relationship in a tropical country like India. Appropriate epidemiological studies like hospital admission rate during celebration may be carried out for studying the impact. Further studies on control measures for firework display during such celebrations are necessary to reduce the probable health hazards.
The base line concentrations of SPM, PM10 and PM2.5 at the monitoring location as observed on a typical winter day were also quite high compared to respective NAAQ, India 24 hours residential standards. It indicates violations of general air quality standard in Salkia which is a different issue that needs to be also addressed.
References
Analitis A., K. Katsouyanni, E. Dimakopoulou, A. K. Samoli, Y. Nikoloulopoulos, G. Petasakis, J. Touloumi, H. Schwartz, H. R. Anderson, K. Cambra, F. Forastiere, D. Zmirou, J. M. Vonk, L. Clancy, B. Kriz, J. Bobvos and J. Pekkanen, 2006. Short–term effects of ambient particles on cardiovascular and respiratory mortality. Epidemiol. 17, 230–233. [ Links ]
Anderson H. R., R. W. Atkinson, J. L. Peacock, M. J. Sweeting and L. Marston, 2005. Ambient particulate matter and health effects: publication bias in studies of short–term associations. Epidemiol. 16, 155–163. [ Links ]
Attri A. K., U. Kumar and V. K. Jain, 2001. Formation of ozone by fireworks. Nature 411, 1015. [ Links ]
Babu S. S. and K. K. Moorthy, 2001. Anthropogenic impact on aerosol black carbon mass concentration at a tropical coastal station: A case study. Curr. Sci. 81, 1208–1214. [ Links ]
Barman S. C., R. Singh, M. P. S. Negi and S. K. Bhargava, 2008. Ambient air quality of Lucknow City (India) during use of fireworks on Diwali festival. Environ. Monit. Assess. 137, 495–504. [ Links ]
Bates, D.V., 1996. Particulate air pollution. Thorax 51, S3–S8. [ Links ]
CPCB, 2007. Annual Report: 2006–2007. Central Pollution Control Board: New Delhi, India. Available online: http://www.cpcb.nic.in/National_Ambient_Air_Quality_Standards.php. [ Links ]
Chen L.H., S.F. Knutsen, L. Beeson, M. Ghamsary, D. Shavlik, F. Petersen and D. Abbey, 2005. The association between ambient particulate air pollution and fatal coronary heart disease among persons with respiratory symptoms/disease. Ann. Epidemiol. 15, 642. [ Links ]
COMEAP, 2006. A Report by the Committee on the Medical Effects of Air Pollutant's Cardiovascular Sub–Group. Cardiovascular Disease and Air Pollution. United Kingdom Department of Health, London, United Kingdom, 208 pp. [ Links ]
Dockery D., C. Pope, X. Xu, J. Spengler, J. Ware, M. Fay, B. Ferris and F. Speizer, 1993. An association between air pollution and mortality in six U. S. cities. N. Engl. J. Med. 329, 1753–1759. [ Links ]
Dominici F., A. McDermott, S. L. Zeger and J. M. Samet, 2003. National maps of the effects of particulate matter on mortality: exploring geographical variation. Environ. Health Perspect. 111, 39–43. [ Links ]
Dominici F., R. D. Peng, M. L. Bell, L. Pham, A. McDermott, S. L. Zeger and J. M. Samet, 2006. Fine particulate air pollution and hospital admission for cardiovascular and respiratory diseases. J. Am. Med. Assoc. 295, 1127–1134. [ Links ]
Drewnick, F., S. S. Hings, J. Curtius, G. Eerdekens and J. Williams, 2006. Measurement of fine particulate and gas–phase species during the New Year's fireworks 2005 in Mainz, Germany. Atmos. Environ. 40, 4316–4327. [ Links ]
Fleischer O., H. Wichmann and W. Lorenz, 1999. Release of polychlorinated dibenzo–p–dioxins and dibenzofurans by setting off fireworks. Chemosphere 39, 925–932. [ Links ]
Katsouyanni K., G. Touloumi, E. Samolu, Y. Petasakis, A. Analitis, A. Le Tertre, G. Rossi, D. Zmirou, F. Ballester, A. Boumghar, H.R. Anderson, B. Wojtyniak, A. Paldy, R. Braustein, J. Pekkanen, C. Schindler and J. Schwartz, 2003. Sensitivity analysis of various models of short–term effects of ambient particles on total mortality in 29 cities in APHEA2. In: Revised Analyses of Time–Series of Air Pollution and Health. Special Report. Health Effects Institute, Boston, MA, 157–164. [ Links ]
Kulshrestha U. C., T. N. Rao, S. Azhaguvel and M. J. Kulshrestha, 2004. Emissions and accumulation of metals in the atmosphere due to crackers and sparkles during Diwali festival in India. Atmos. Environ. 38, 4421–4425. [ Links ]
Levy J. I., J. K. Hammitt and J. D. Spengler, 2000. Estimating the mortality impacts of particulate matter: what can be learned from between–study variability?. Environ. Health Perspect. 108, 109–117. [ Links ]
Liu D. Y., D. Rutherford, M. Kinsey and K. A. Prather, 1997. Real–time monitoring of pyrotechnically derived aerosol particles in the troposphere. Anal. Chem. 69, 1808–1814. [ Links ]
Pope C. A. III and D. W. Dockery, 2006. Health effects of fine particulate air pollution: lines that connect. J. Air Waste Manage. Assoc. 56, 709–742. [ Links ]
Pope C. A. III, R. T. Burnett, G. D. Thurston, M. J. Thun, E. E. Calle, D. Krewski and J. J. Godleski, 2004. Cardiovascular mortality and long–term exposure to particulate air pollution. Circulation 109, 71–77. [ Links ]
Pope C. A. III, R. T. Burnett, M. J. Thun, E. E. Calle, D. Krewski, I. Kazuhiko and G. D. Thurston, 2002. Lung cancer, cardiopulmonary mortality, and long term exposure to fine particulate air pollution. J. Am. Med. Assoc. 287, 1132–1141. [ Links ]
Pope C. A. III, J. B. Muhlestein, H. T. May, D. G. Renlund, J. L. Anderson and B. D. Horne, 2006. Ischemic heart disease events triggered by short–term exposure to fine particulate air pollution. Circulation 114, 2443–2448. [ Links ]
Ravindra K., S. Mor and C. P. Kaushik, 2003. Short–term variation in air quality associated with firework events: A case study. J. Environ. Monit. 2003, 260–264. [ Links ]
RIDEM, 2003. Rhode Island Department of Environmental Management–Division of Air Resources. Air Pollution Control Regulation No. 10. Available online: http://www.epa.gov/region1/topics/air/sips/ri/2003_RI_reg_10.pdf (accessed on July 1, 2010). [ Links ]
Schwartz J., 1993. Air pollution and daily mortality in Birmingham, Alabama. Am. J. Epidemiol. 137, 1136–1147. [ Links ]
Seaton A., W. MacNee, K. Donaldson and D. Godden, 1995. Particulate air pollution and acute health effects. Lancet 345, 176–178. [ Links ]
Steib D. M., S. Judek and R. T. Burnett, 2002. Meta–analysis of time–series studies of air pollution and mortality: effects of gases and particles and the influence of cause of death, age, and season. J. Air Waste Manage. Assoc. 52, 470–484. [ Links ]
Steib D. M., S. Judek, S. and R. T. Burnett, 2003. Meta–analysis of time–series studies of air pollution and mortality: update in relation to the use of generalized additive models. J. Air Waste Manage. Assoc. 53, 258–261. [ Links ]
Torén K., I. A. Bergdahl, T. Nilsson and B. Järvholm, 2007. Occupational exposure to particulate air pollution and mortality due to ischemic heart disease and cardiovascular disease. Occup. Environ. Med. 64, 515–519. [ Links ]
Turner D. B., 1994. Workbook of atmospheric dispersion estimates. 2nd ed. Lewis Publishers, Florida, USA, 2–8. [ Links ]
USEPA, 1971. United States Environmental Protection Agency. EPA Defines Air Pollution Danger Levels–EPA press release, October 19. Available online: http://www.epa.gov/history/topics/caa70/09.htm (accessed on July 1, 2010). [ Links ]
USEPA, 1997. United States Environmental Protection Agency. Technology Transfer Network, National Ambient Air Quality Standards. PM2.5 NAAQS implementation. Available online: http://epa.gov/ttn/naaqs/pm/pm25_index.html (accessed on February 22, 2008). [ Links ]
Vecchi R., V. Bernardoni, D. Cricchio, A. D. Alessandro, P. Fermo, F. Lucarelli, S. Nava, A. Piazzalunga and G. Vallia, 2008. The impact of fireworks on airborne particles. Atmos. Environ. 42, 1121–1132. [ Links ]
Victoria Advocate, 2005. Mexico City begins 2005 with air pollution ratings unsatisfactory. In Victoria Advocate, 2nd January, 2005. Available online: http://news.google.com/newspapers?nid=861 & dat=20050102 & id=DroMAAAAIBAJ & sjid=k2ADAAAAIBAJ & pg=2097,317901 (accessed on September 10, 2009). [ Links ]
Wang Y., G. Zhuang, C. Xua and Z. An, 2007. The air pollution caused by the burning of fireworks during the lantern festival in Beijing. Atmos. Environ. 41, 417–431. [ Links ]
WBPCB, 2005. Report on A Study on: Impact of Kalipuja–Diwali–2005 Fireworks on Ambient Air Quality. West Bengal Pollution Control Board. Available online: http://www.wbpcb.gov.in/html/downloads/air–rep–diwali–05.pdf (accessed on July 28, 2009). [ Links ]
WBPCB. Report on Daily Ambient Air Quality. West Bengal Pollution Control Board. Available online: http://www.wbpcb.gov.in/html/aaq_info.shtml (accessed on July 30, 2009). [ Links ]
WBPCB, 2006. Annual Report: 2005–2006. West Bengal Pollution Control Board: Kolkata, India, 2006; pp. 37–47. [ Links ]
WHO, 2006. Appendix–2. In: Environmental Epidemiology (P. Wilkinson, Ed.) Open University Press, Berkshire, England, 199–202. [ Links ]

