1. Introduction
The HH 46 and 47 Herbig-Haro objects were discovered by Schwartz (1977), and were recognized as forming part of the same, jet-like outflow by Dopita (1978) and Dopita et al. (1982). This was actually the first time that Herbig-Haro objects were described as jet-like flows. In the more recent literature, this outflow is many times referred to as the “HH 47 outflow”, and we adopt this name in the present paper.
Dopita et al. (1982) showed that this outflow has a NE, blueshifted lobe with a length of ≈ 80” with a bright “head” (HH 47A), and a fainter arclike structure (HH 47D) at ≈ 20” beyond HH 47A. The base of the NE lobe is embedded in a bright reflection nebula.
The redshifted SW lobe is obscured by the Gum nebula, and only the tip of this lobe (HH 47C) is seen optically, emerging on the other side of the dark cloud. The two lobes of the HH 47 outflow are seen very clearly in the IR (Noriega-Crespo et al. 2004) and both the jet flows and a broader molecular outflow are seen in radio interferometric observations (see, e.g., Arce et al. 2013 and Zhang et al. 2016). The IR observations of Noriega-Crespo et al. (2004) clearly show an embedded source out of which the two outflow lobes emerge. A very nice optical image of the whole HH 47 outflow is shown in Figure 1 of Heathcote et al. (1996).
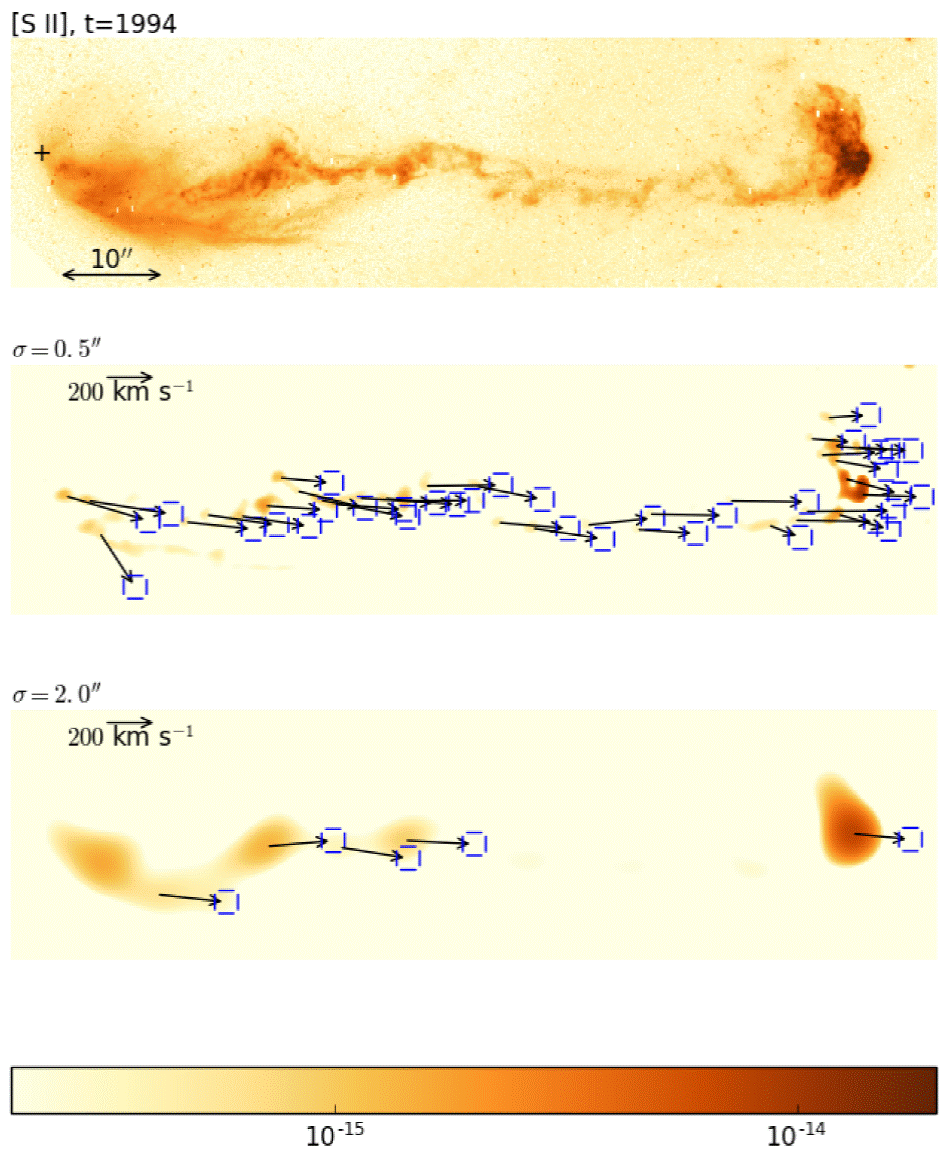
Fig. 1 Red [S II] image of HH 47 obtained in 1994 (top: original image, center: convolution with σ = 0.5” wavelet, bottom: convolution with σ = 2” wavelet). The image has been rotated so that the abscissa is parallel to a P A = 54.18º direction. The original and convolved images are shown with the logarithmic color scale given (in erg s-1cm-2arcsec-3) by the bottom bar. In the top frame, the scale of the images and the position of the outflow source are shown. In the central frame, the black arrows and blue squares show the proper motion velocities and their errors (respectively) obtained with the 1994 and 1999 epochs at the two chosen resolutions. The color figure can be viewed online.
The HH 47 jet has been observed with Fabry-Perot interferometry (Hartigan et al. 1993; Raymond et al. 1994) and long-slit, spectroscopy (Meaburn & Dyson 1987; Hartigan et al. 1990; Reipurth & Heathcote 1991). Meaburn & Dyson (1987) noted that the Hα emission of the HH 47 jet had a “high” and a “low velocity” component, and attributed the latter to the possible presence of an outer “entraining layer” surrounding the jet. This idea was confirmed by the Fabry-Perot observations of Hartigan et al. (1993), which clearly showed the existence of a lower velocity envelope around the HH 47 jet. The HST images of Heathcote et al. (1996) showed that this outer envelope had a strong Hα and a weak red [S II] emission.
Eislöffel & Mundt (1994) measured proper motion velocities of the knots along the HH 47 outflow using ground-based images with a 3 year time baseline, showing motions roughly aligned with the outflow axis. Hartigan et al. (2005) determined proper motions from two sets of Hα and red [S II] HST images with a 5 year baseline, and Hartigan et al. (2011) discussed the time-evolution of the HH 47 jet using a third HST image (extending the timebaseline to 14 years), but did not recompute the proper motions.
Hartigan et al. (2005) estimated a distance of 450 pc to HH47, with an error of ≈ 25 pc. Weadopt this distance throughout our paper. With this distance and their proper motion determinations, they obtained velocities in the 180 → 280 km s-1 range, and (using previously measured radial velocities) estimated an angle of ≈ 37° between the outflow axis and the plane of the sky.
In the present paper, we take the three available epochs of [S II] and Hα HST images, and recompute the proper motions of the region between the outflow source and the HH 47A “head”. We compute two sets of proper motions: one with the first and another one with the second of the successive pairs of the three available epochs, and we then compare the results obtained from these two proper motion determinations.
The paper is organized as follows. The archival HST images of HH 47 are described in § 2. § 3 describes the method used to determine the proper motions. § 4 gives the results obtained for the [S II] and Hα proper motions. § 5 presents a discussion of the proper motion velocity vs. distance dependence obtained with the two different time-baselines. § 6 discusses the time evolution of the red [S II] and Hα intensities of the knots along the HH 47 outflow over the 14 yr period covered by the three epochs of HST images. Finally, the results are discussed in § 6.
2. The observations
The HH 46/47 outflow has been imaged with the HST in Hα and in the red [S II] lines in three epochs. The characteristics of these images are summarized in Table 1. The 1994 images were obtained and described by Heathcote et al. (1996). The 1999 images were described by Hartigan et al. (2005), and used together with the 1994 images to measure proper motions. The 2007 images were described by Hartigan et al. (2011).
Table 1 HST images of the HH 46/47 system
| Epoch | Filters | Emission Lines | Exposures [s] |
|---|---|---|---|
| 1994.24 | F656N | Hα | 2600 |
| 1994.23 | F673N | [S II] 6716/6731 | 2600 |
| 1999.16 | F656N | Hα | 1300 |
| F673N | [S II] 6716/6731 | 1300 | |
| 2008.00 | F656N | Hα | 1300 |
| F673N | [S II] 6716/6731 | 1300 |
We combined the drizzled images with a median filter, and carried out an additional cosmic ray removal by iteratively removing pixels with very high contrasts with their neighbours. The images of the different epochs were rotated, scaled and shifted onto a common reference frame using six stars (present in all frames). Then, the images were rotated so that the abscissa was parallel to a P A = 54.18º direction (following Hartigan et al. 2005), which is approximately parallel to the HH 47 axis. Finally, we flux calibrated the images multiplying by the values of the PHOTFLAM and BANDWID keywords of the fits headers. All of the final images have a scale of 0.1”per pixel.
3. The proper motion measurements
We determine the proper motions with the “wavelet convolution” method described in detail by Raga et al. (2017). Versions of this method were previously used by Raga et al. (2016a, b).
The method consists of first choosing a characteristic size for the emitting structures (on which the proper motions are measured) by convolving the images with a “Mexican hat” wavelet of half-width σ (see, e.g., equation 1 of Raga et al. 2017). Then, the positions of the peaks above a chosen cutoff fmin are determined through a paraboloidal fit. Finally, the positions of corresponding knots in successive epochs are used to compute proper motions.
For our study of HH 47, we choose two halfwidths for the wavelets: σ = 5 pix (corresponding to 0.5”) and σ = 20 pix (corresponding to 2”). In the convolved images, we have chosen all the intensity peaks above a fmin = 3×10-16erg s-1cm-2 arcsec-2 minimum flux.
We identified pairs of knots in successive images by searching for the nearest neighbour at larger distances from the outflow source (in the second image) for all of the knots of the first image. The search for nearest neighbours was only carried out for a maximum distance of 10 (for the 1994-1999 pair of epochs) or 20 pixels (for the 1999-2007 epoch pair), corresponding to a maximum proper motion of ≈ 450 km s-1. Also, we only kept proper motions of knot pairs which have an offset (between the two successive epochs) of at least one pixel.
In this way, we obtained proper motions for the 1994-1999 and for the 1999-2007 pairs of epochs, and in each of these pairs of frames for structures with σ = 0.5” and σ = 2”. This exercise was done for both the [S II] and the Hα images, and the results are discussed in the following sections.
It is difficult to estimate the errors in the measured proper motions. These errors are due to the precision in measuring emission peaks (affecting both the alignment of the two epochs of frames and the knot positions) and also due to intrinsic changes in the knot morphologies within the observed time intervals. We have chosen to assign a conservative error of 1 pixel (0.1”) to the measured knot offsets (between the pairs of successive frames).
4. The [S II] and Hα proper motions
In Figure 1, we show the 1994 [S II] image of the HH 47 jet (top frame), and the convolution of this frame with σ = 0.5” (central frame) and σ = 2.0” wavelets (bottom frame). The position of the outflow source (see Noriega-Crespo et al. 2004) is shown with a cross on the top frame.
In the two bottom frames, we show the proper motions obtained with the 1994-1999 pair of epochs at the two chosen resolutions. In the σ = 0.5” convolutions, we separate the chain of knots of the jet (in the central region along the ordinate) from the reflection nebula, which appears as a parallel chain of knots below the jet. In the σ = 2” convolution, these two structures are combined into a single chain of knots, extending out to ≈ 30” from the outflow source (at larger distances from the source, only the jet contributes to the observed structures).
In Figure 2, we show the 1999 [S II] frame (top), and the convolutions of this image with σ = 0.5” and σ = 2.0” wavelets (central and bottom frame, respectively). On the two bottom frames, we show the proper motions calculated with the 1999-2008 pair of epochs at the two angular resolutions.
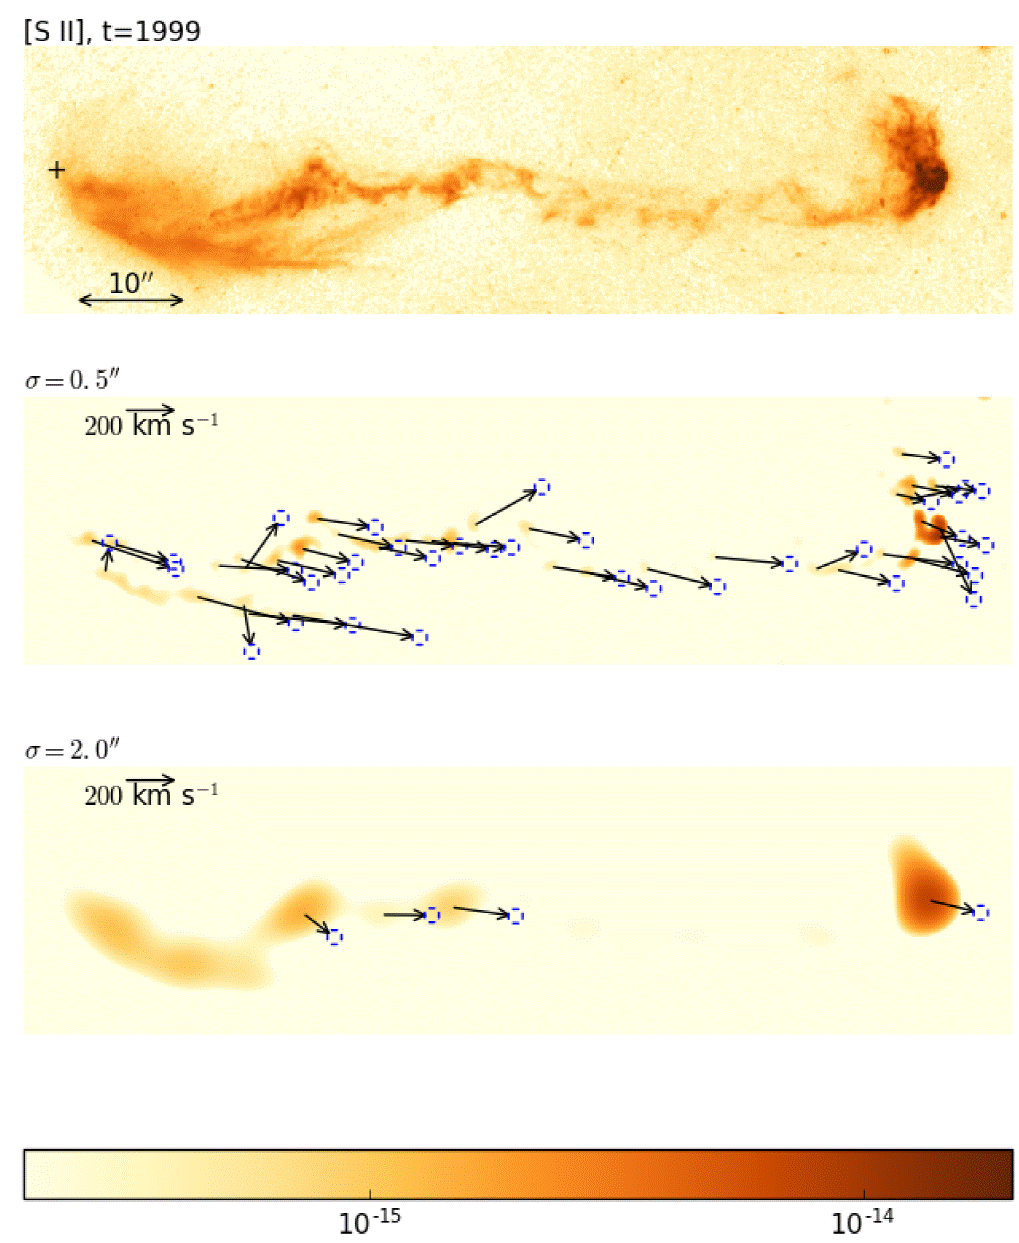
Fig. 2 Red [S II] image of HH 47 obtained in 1999 (top: original image, center: convolution with σ= 0.5′′ wavelet, bottom: convolution with σ= 2′′ wavelet). The proper motion vectors shown were calculated with the 1999 and 2008 epochs at the two chosen resolutions. This figure is otherwise organized in the same way as Figure 1. The color figure can be viewed online.
Figures 3 and 4 are equivalent to Figures 1 and 2, but for the Hα frames. Figure 3 shows the 1994 Hα image (top) and the σ = 0.5” and σ = 2” convolutions (center and bottom), as well as the computed Hα 1994-1999 proper motions for the two spatial resolutions. Figure 4 shows the 1999 Hα image (top) and the σ = 0.5” and σ = 2” convolutions (center and bottom), as well as the computed Hα 1999-2008 proper motions for the two spatial resolutions.
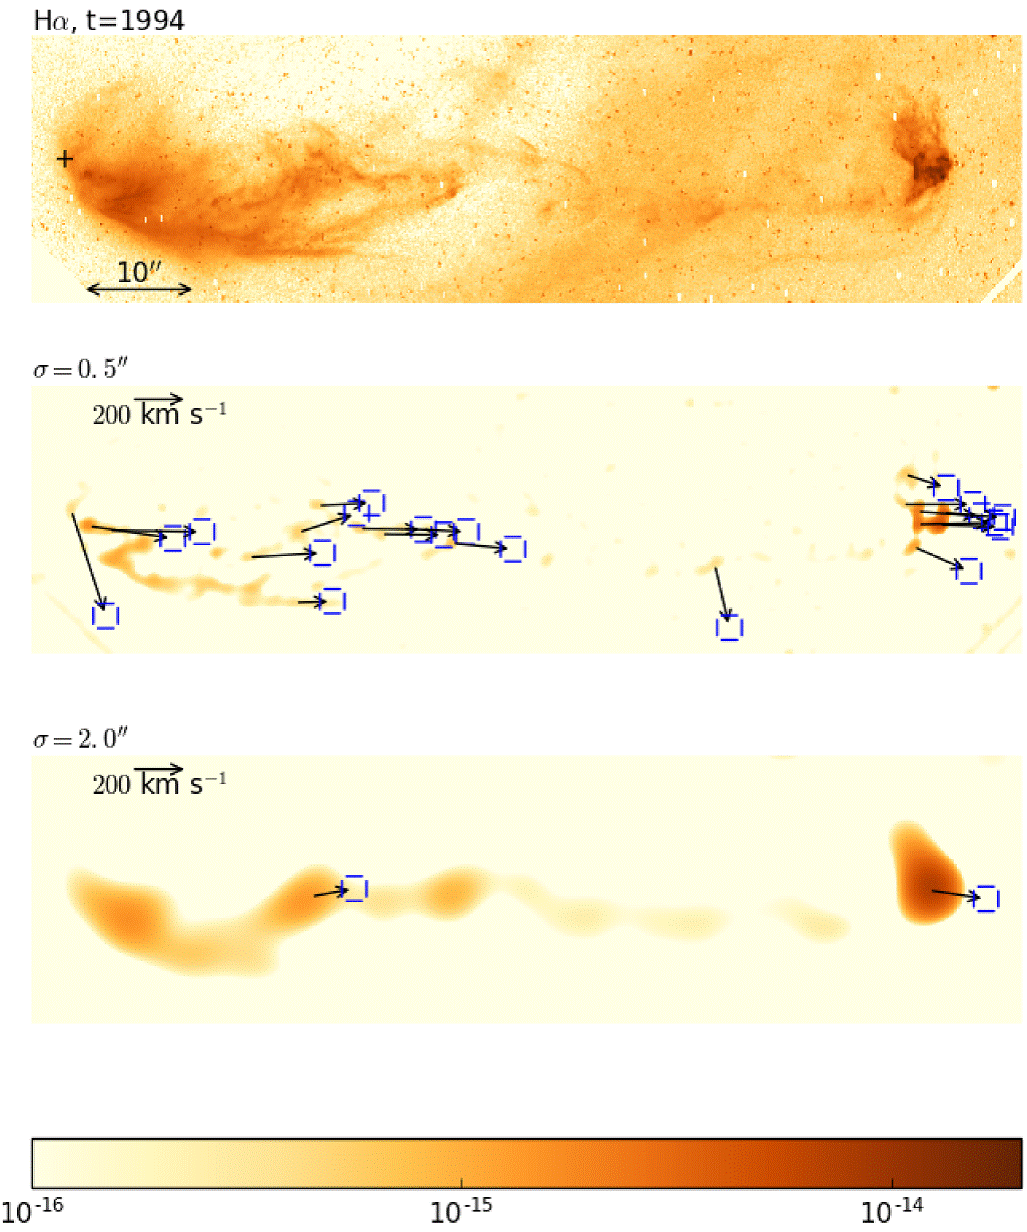
Fig. 3 Hα image of HH 47 obtained in 1994 (top: original image, center: convolution with σ = 0.5” wavelet, bottom: convolution with σ = 2” wavelet). A uniform background of 5 × 10⁻¹⁶erg s−1cm−2arcsec−2 has been subtracted from the top frame. The proper motion vectors shown were calculated with the 1994 and 1999 epochs at the two chosen resolutions. This figure is otherwise organized in the same way as Figure 1. The color figure can be viewed online.
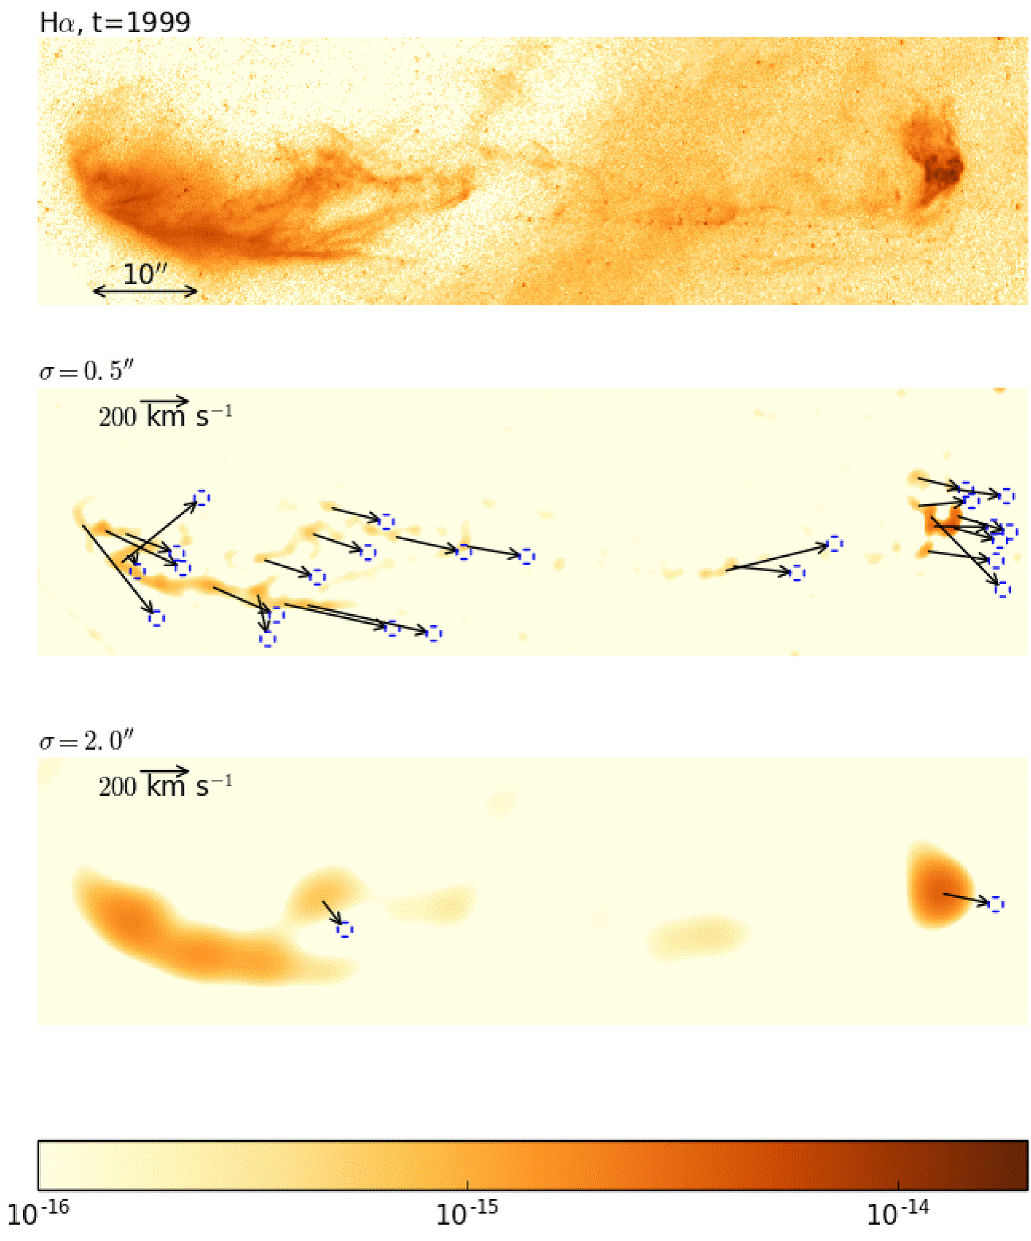
Fig. 4 H_ image of HH 47 obtained in 1999 (top: original image, center: convolution with σ= 0.5′′ wavelet, bottom: convolution with σ= 2′′ wavelet). A uniform background of 5 × 10⁻¹⁶erg s−1cm−2arcsec−2 has been subtracted from the top frame. The proper motion vectors shown were calculated with the 1999 and 2008 epochs at the two chosen resolutions. This figure is otherwise organized in the same way as Figure 1. The color figure can be viewed online.
In Figures 1, 2, 3 and 4, we see two notable features:
the reflection nebula (below the jet axis in all of the frames, and extending out to ≈ 30” from the outflow source) breaks into knots of the size of the chosen wavelet (as expected), and the search of neighbours in successive epochs (along the direction of the outflow) produces large proper motions which are most likely not associated with any possible physical motions,
it is evident that the proper motion vectors of the jet knots do not always point directly away from the outflow source. This could be due to real deviations from ballistic motions (away from the source), or to small changes in the morphology of the knots, which could result in apparent shifts across the outflow axis.
The bright condensation on the right is HH 47A.
5. Velocities as a function of distance from the source
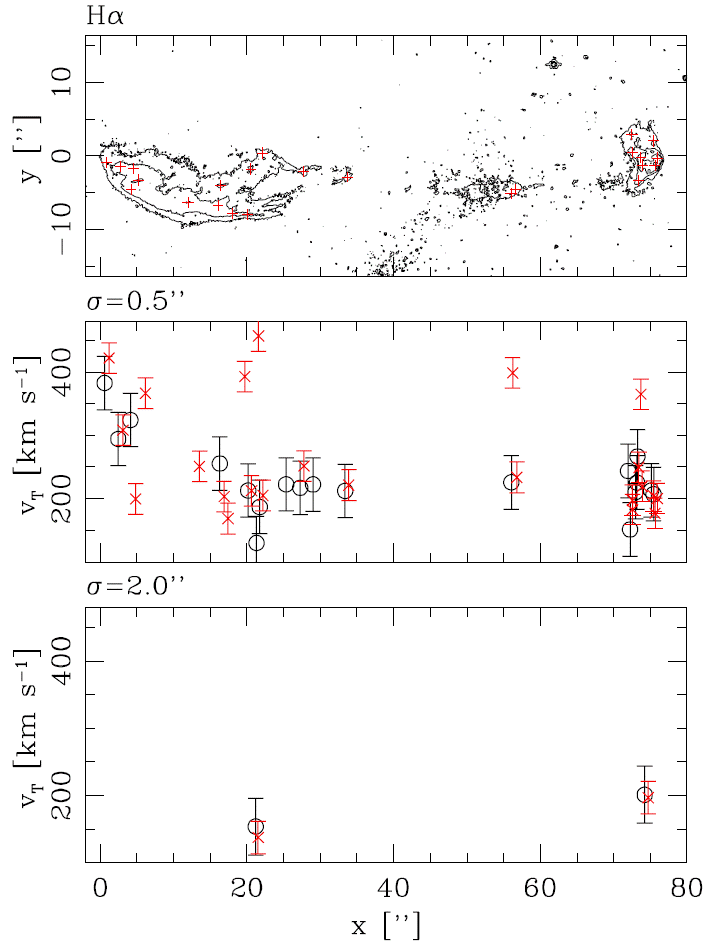
In order to compare the results obtained between the two pairs of epochs (1994-1999 and 1999-2008, see above), in Figure 5 we show the proper motion velocities as a function of distance from the outflow source (for which we take the position given by Noriega-Crespo et al. 2004). In the σ = 0.5” resolution velocities (central frame of Figure 5), we see that the highest velocities are obtained for three knots at distances x = 13 → 22” in the 1999-2008 period (shown with red crosses in Figure 5). These velocities correspond to peaks along the reflection nebula (see Figure 1 and the top frame of Figure 5), and, as argued in § 2.2, they are unlikely to correspond to real motions in the outflow.
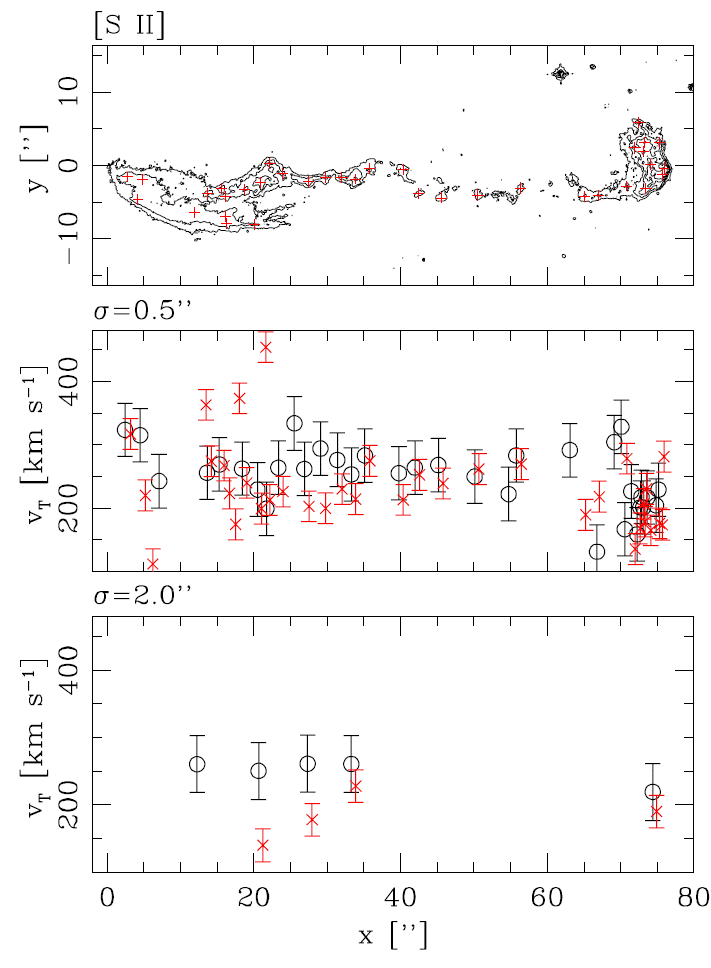
Fig. 5 Moduli of the [S II] proper motion velocities as a function of projected distance x from the outflow source obtained from the 1994-1999 epochs (black circles) and from the 1999-2008 epoch (red crosses). The central frame shows the results obtained for the σ = 0.5” structures, and the bottom frame for the σ = 2.0” structures. The top frame shows a contour plot of the (nonconvolved) 1999 [S II] map (with logarithmic, factor of 2 contours) on which the knots detected in the σ = 0.5” convolution are shown (with red crosses). The color figure can be viewed online.
In the remaining knots, the velocities measured in the 1994-1999 period (shown with black circles in Figure 5) are generally higher than the 19992008 velocities (except for a few condensations in the HH 47A “head”, at x = 70 → 75” from the outflow source). The differences between the velocities are substantial close to the source, and become smaller in the x = 35 → 60” region.
In the bottom frame of Figure 5, we show the 1994-1999 (black circles) and 1999-2008 (red crosses) velocities obtained on the σ = 2” convolutions. These velocities are consistent with the ones of the higher resolution images, with substantial differences between the two pairs of epochs for x ≈ 20”, which become smaller at x ≈ 35” . Again, in HH 47A we see a higher 1994-1999 velocity.
In Figure 6, we show the σ = 0.5” (centre) and 2.0” (bottom) proper motion velocities as a function of distance x from the source, obtained from the 1994-1999 frames (red crosses) and 1999-2008 Hα frames (black circles). The Hα velocities have values that are somewhat smaller than the [S II] velocities, and there are fewer detected Hα knots.
In order to quantify the apparent time-evolution of the [S II] and Hα proper motions we proceed as follows:
we consider the σ = 0.5” [S II] and Hα proper motion velocities of the knots along the HH 47 outflow (shown in the central frames of Figures 5 and 6), discarding all of the knots with velocities > 350 km s-1. The discarded proper motions mostly correspond to knots along the reflection nebula seen in the bottom left region of the top frames of Figures 5 and 6 (at distances ≤ 30´´ from the outflow source),
we then consider spatial bins of 10” size, starting from the position of the source, and calculate the mean velocity of the knots within each bin.
The results of this exercise are shown in Table 2. We see that for most of the chosen spatial ranges, the 1994 − 1999 proper motion velocities are higher than the 1999 − 2008 velocities. Significant [S II] velocity decreases (i.e., larger than the error estimates) are found for the x =0→10” ,20→30” and 60 → 70” distance ranges, and significant Hα velocity decreases are found only for the x = 0 → 10” distance range.
Table 2 Mean velocities of knots in different distance ranges
| xmin, xmax a | [S II] | Hα | ||
|---|---|---|---|---|
| [´´] | 94 − 99b | 99 − 08b | 94 − 99b | 99 − 08b |
| 0 → 10 | 294 (24) | 216 (14) | 309 (30) | 194 (14) |
| 10 → 20 | 262 (24) | 236 (11) | 256 (42) | 208 (14) |
| 20 → 30 | 264 (17) | 208 (11) | 199 (17) | 223 (14) |
| 30 → 40 | 267 (21) | 240 (14) | 212 (42) | 221 (24) |
| 40 → 50 | 266 (30) | 235 (14) | . . . | . . . |
| 50 → 60 | 251 (24) | 266 (17) | 226 (42) | 234 (24) |
| 60 → 70 | 242 (24) | 204 (17) | . . . | . . . |
| 70 → 80 | 215 (13) | 199 (8) | 217 (16) | 204 (9) |
a Distance ranges for mean knot velocities.
b Mean velocities (in km s−1) calculated with the 1994-1999 and 1999-2008 pairs of frames. The errors are in parentheses.
The reverse (1994−1999 velocities lower than the 1999 − 2008 velocities) is seen in both [S II] and Hα in the x = 50 → 60” distance range, and only in Hα in the x=20→30” and 30→40” ranges.These differences are all within the errors, and therefore are consistent with no change in velocity.
We therefore find that:
the only [S II] and Hα spatial ranges with velocity changes clearly above the estimated errors correspond to “decelerations” (i.e., higher 1995 − 1999 than 1999 − 2008 velocities)
out of 14 pairs of velocities (counting both the [S II] and Hα velocities shown in Table 2), 10 correspond to “accelerations”, and 4 to “decelerations”.
The second item implies that a hypothetical scenario in which the “accelerations” and “decelerations” are simply a result of random errors can be rejected with an ≈ 85% confidence level. This is a result of the fact that obtaining a number p ≤ 4 of positive results out of 14 events (with equally probable positive and negative results) has a probability of ≈ 0.148.
6. The time-dependent line fluxes
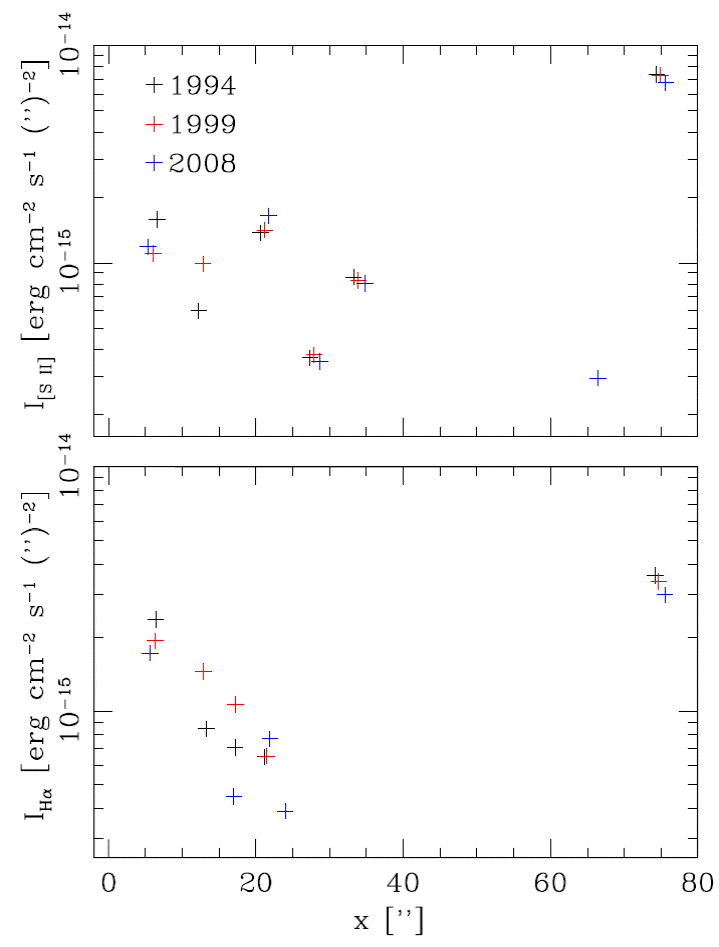
We now explore whether or not the observed deceleration of the proper motions of knots along the HH 47 jet is accompanied by a variability of their emission. We do this by measuring the intensity peaks of the three epochs of [S II] and Hα images convolved with a σ = 2” wavelet (the first two of the three epochs shown in the bottom frames of Figures 1,2, 3 and 4).
The results of this exercise are displayed in Figure 7, which shows the peak intensities as a function of distance from the outflow source. It is clear that HH 47A (at x ≈ 75”) shows a decrease of both the [S II] and the Hα intensity over the observed time period. The same effect is seen in the [S II] intensity peaks at x ≈ 28” and 35” (top frame of Figure 7). The peaks closer to the source show either increasing or decreasing line fluxes as a function of time (however, these peaks are associated mostly with the reflection nebula and not with the jet, see above).
7. Discussion
We re-analyzed three epochs (1994, 1999 and 2008, see Table 1) of red [S II] and Hα images of the HH 47 jet. On these images, we applied a “wavelet convolution” method to determine proper motions and intensities for emitting structures of two chosen size scales (corresponding to σ = 0.5” and 2” half-widths).
The results are quite surprising: we found that the [S II] and Hα structures have proper motion velocities that mostly decrease from the 1994-1999 to the 1999-2008 time period (see Figures 5 and 6). We calculated mean velocities for the knots within 10” boxes (corresponding to successive distance ranges from the outflow source), and found that out of 14 boxes with measured knots (8 in [S II] and 6 in Hα, see Table 2), in 10 (of these boxes) the proper motion velocities decreased from the 1994 − 1999 to the 1999 − 20084 epoch pairs. Four of the boxes showed velocity decreases which are clearly above the estimated errors of the proper motions. The largest velocity decreases (of ≈ 50%) are seen in the knots within 10” from the outflow source (see the first line of Table 2).
Also, the Hα velocities are systematically lower than the [S II] proper motion velocities by ≈ 10 → 50 km s-1 (except at distances < 10” from the outflow source and in the HH47A head, see Table 2). These lower Hα velocities are consistent with the fact
that the lower (radial) velocity, “entrained” outer envelope of the HH 47 jet (seen in the Fabry-Perot observations of Hartigan et al. 1993) is brighter in Hα than in [S II] (as seen in the HST images of Heathcote et al. 1996).
We also found that the [S II] intensity of the HH 47A head and the intensities of some of the knots along the jet decreased with time in the three available epochs. The Hα intensity of HH 47A also decreased monotonically with time. These decreases in intensity are in principle consistent with slowing down knots, with lower associated shock velocities as a function of time.
The decelerations seen in the HH 47A head and in the knots along the HH 47 jet are qualitatively different from what is observed in HH 1 and 2. In these objects, much smaller changes in proper motion velocities are observed:
a ≈ 15% acceleration over 20 years for HH 1 (Raga et al. 2016a),
surprisingly constant (within ≈ 5%) velocities for the knots of HH 2 over ≈ 50 yrs (Raga et al. 2016b),
undetectable accelerations/decelerations for the knots of the HH 1 jet over 20 years (Raga et al. 2017).
This difference between the HH 47 and HH 1/2 outflows might be a result of the strong direction deviations of the HH 47 jet (which could be due to a precession of the ejection direction). Such directional deviations result in an exposure of the individual knots to a direct interaction with the surrounding environment, leading to a possibly strong breaking of the knots (see, e.g., Raga & Biro 1992 and Masciadri et al. 2002). In the case of HH 47, the jet knots might be interacting with a slower, surrounding molecular outflow (see, e.g., Arce et al. 2013) rather than with an undisturbed environment.
AR and PV acknowledge support from the CONACYT grants 167611 and 167625 and the DGAPA-UNAM grants IA103315, IA103115, IG100516 and IN109715. We thank an anonymous referee for comments which led to the results given in Table 2.


 nueva página del texto (beta)

