


 nueva página del texto (beta)
 Inglés (pdf)
 Artículo en XML
 Referencias del artículo
 Enviar artículo por email
 Citado por SciELO
  Similares en
SciELO
Similares en
SciELO 
 Permalink
1. Introduction
The fast progress in electrical systems technology has led to fast development in electrical insulating materials. A big part of effort is devoted to the polymeric materials development because of their effectiveness in numerous applications like wire and cable insulation [1]. Cross-linked polyethylene (XLPE) insulation dominates the manufacturing market of high voltage cables because of its reliability, its greater dielectric and mechanical strengths and its low costs. The cross-linking process is achieved by bringing transversal links through physical or chemical process and creating a 3D network [2]. This 3D network transforms the polyethylene from a thermoplastic polymer to an elastomeric one. Hence the main introduced improvement concerns the mechanical and thermal properties [3,4]. In industry, one of the most used cross-linking methods is silane-crosslinking. In this method an alkoxy-silane is grafted on polyethylene to form silane-grafted LDPE, which is later immersed in a hot water to hydrolysis the alkoxy groups to form silanol (SiOH) functions. Finally, silanol groups are condensated, and two adjacent chains can be crosslinked via siloxane (Si-O-Si) bridges [5-7].
In a variety of applications, Si-XLPE insulation cables are submitted to weathering environment conditions. In such situation, weathering aging might be happened under the effect of environmental conditions (UV radiation, rains, humidity, temperature variations, etc). The main consequences of weathering aging are the photo-oxidation degradation leading to chain scissions and/or cross-linking associated to internal stress development and surface cracks. The latter facilitates the penetration of the water and oxygen in the bulk of the material which accelerates the aging process [8].
The above mentioned situation is highly prevailing with the growth development of photovoltaic power generation stations. Hence, to find the suitable material which presents good resistance to weathering conditions is a big challenge that must be handled. Based on previous findings, the presence of Si-O-C link in polymer chains leads to a reduction of the yellowing index of the material under weathering conditions [9]. Hence, Si-XLPE can be considered as one of the nominated materials for such application.
Over the past few decades, a lot of work has been carried out by many researchers to study the degradation mechanisms of Si-XLPE under different applied constraints to predict the lifetime of this insulation. Gazel et al. [10] have studied the photo-oxidation of silane crosslinked polyethylene. Celina and George [11] have studied the degradation behavior of peroxide and silane cross-linked polyethylene under thermal and ultraviolet aging. Recently, Hettal and coworkers have investigated the effect of radio-thermal aging of Si-XLPE on the crystalline morphology [12], changes in the electrical properties [13] and mechanical properties [14,15]. Previous studies have highlighted that Si-XLPE degradation can occur at three distinguished scales: at molecular scale (creation of oxidized groups associated to either chains scission or cross-linking reactions), at microstructural scale (increase or decrease of crystallinity and lamellar thickness) and at macroscopic scale (brittleness behavior and decrease of mechanical properties like elongation at rupture and tensile strength). In this philosophy, our study is an attempt to analyze the effect of accelerated cyclic weathering aging on the Si-g-LDPE (based material of Si-XLPE) at both microscopic and macroscopic scales. The choice of Si-g-LDPE instead Si-XLPE is more suitable to follow up the effect of weathering conditions on the cross-linking tendency of this material conjointly to the assessment of photo-oxidation degradation caused by weathering aging. Multiple points of interest of this study may give it a high-spot novelty. The first point of interest concerns the application of cyclic aging intending to mimic, as possible, the real weather like UV irradiation (day), temperature variation, humidity, dark (night) and spray (rain). Many authors have limited their studies on the application of only continuous irradiation or only irradiation and humidity which present some limitations [16,17]. The second point of interest of our study is, as we have said, to follow up the effect of weathering conditions on the cross-linking tendency of Si-g-LDPE conjointly to the assessment of photooxidation degradation. This way to handle the phenomena presents some originality in the point of view of industrial application, and tries to show the possibility of exploiting the climatic circumstances, that seem to be nearby to those needed in silane-crosslinking process of polyethylene, to accomplish the cross-linking process. The adopted methodology is to follow up the effect of weathering conditions on the cross-linking tendency and to track the photo-oxidative degradation at both microscopic and macroscopic scales. At macroscopic scale, we have used the commonly approved technique in the industry called Hot-Set-Test (HST) to follow cross-linking process and mechanical properties (elongation at break and tensile strength) evolution to track the photo-oxidative degradation. At microscopic scale we have used FTIR measurement to assess both phenomena. Additional results on the effect of cyclic accelerated weathering aging on microstructural and optical properties are collected and analyzed by using X-ray diffractometry (XRD) and UVvisible.
2. Materials and methods
2.1. Material and sampling
Commercial silane-grafted polyethylene compound (KI-XL03MT) supplied by Kalpena Industries Ltd (India) and used by ENICAB firm of Biskra (Algeria) as insulation in 18/30 kV high voltage cables is used in this study. The melt flow index MFI (190◦C, 2.61 kg) of this polymer is 1.3 g/10 min and its density is 0.924 g.cm−3. In its granulating form (as received), this material is a mixture of linear low density polyethylene (LDPE) grafted with a silane component (vinyltrimethoxysilane VTMS) and DCP peroxide as the radical initiator. To have adequate samples, Si-g-LDPE granules are extruded in mono screw Brabender extruder (Brabender DSE 20 plasticorder, Duisburg, Germany). The temperature’s profile of extrusion is 155 (feeding zone), 160 (melting zone) and 165◦C (die head). The screw rotates at a speed of 20 rpm. As output, we have obtained long film having 4 cm width and 0.5 mm thickness. It achieves only the first step of the SIOPLASr cross-linking process. To proceed the weathering aging process in the QUV chamber, we have cut samples (10 cm length) to be suitable for sample holder.
2.2. Cyclic QUV aging
To simulate the effect of real weathering aging, cyclic accelerated weathering aging was carried out using a QUV/spray model weathering tester (Q-Lab Corporation, Florida, USA). The main environmental conditions like UV irradiation (sunlight), temperature changes (day/night cycle), humidity, dark (night) and spray (rains) have been considered in each aging cycle. In our work, we have performed long-term aging experiments of 48 aging cycles (total time up to 1152 hours) using a modified ASTM G154 test cycle. The samples are irradiated with UVB (wavelength of 313 nm) fluorescent lamps. Each cycle represents 24 hours and subdivided into successive steps as listed in Table I.
TABLE I Aging steps and conditions
| Step | Irradiance | Spray and condensation | Temperature | Duration |
| Step 1 | UVB light (0.67 W/m2) | Non | 50◦C | 8 hours |
| Step 2 | Non | Spray and condensation | 50◦C | 10 minutes of spray followed by 4 hours of condensation |
| Step 3 | Non | Non | 30◦C in dark | 12 hours |
The listed conditions try to simulate the semi-arid climate of the interior regions in Algeria (region of Djelfa, 300 km south of Algiers, as example) where setup many solar power plants. As the aging process goes on, we take few samples for a specify aging period and submit them to different measurements.
2.3. Characterization
2.3.1. Hot-Set-Test measurement
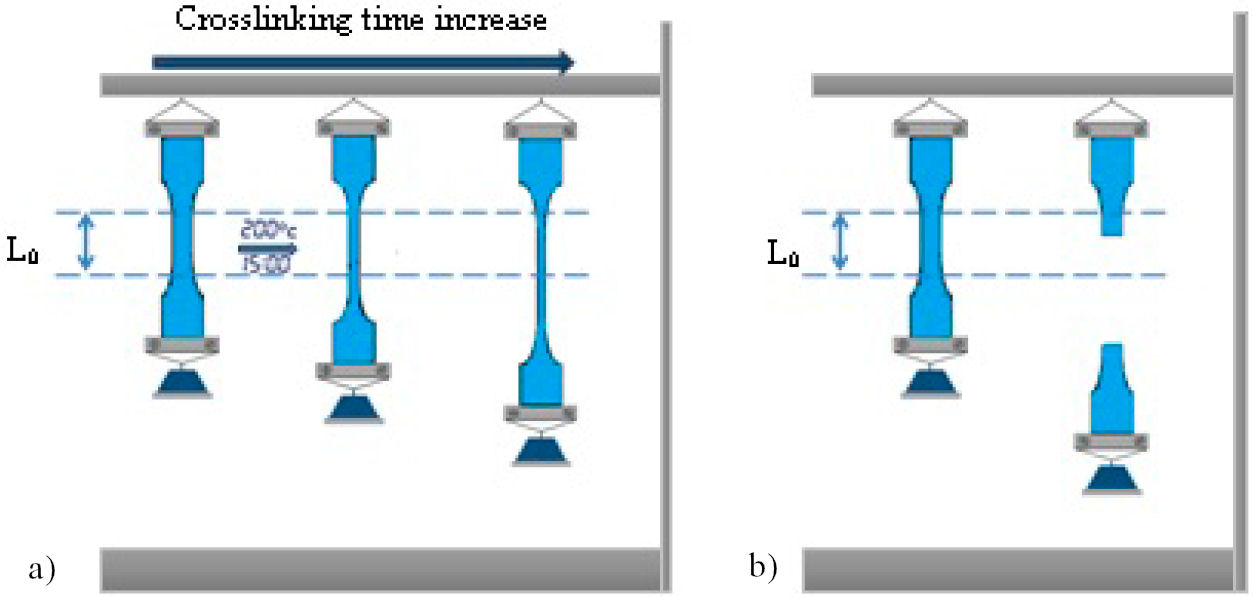
Hot-Set-Test (or hot elongation) is the commonly applied procedure to measure the cross-linking degree of polymers at macroscopic scale. It is related to the kinetic theory of plastic elasticity. The higher degree of cross-linking the lower the elongation is. IEC 60811 standards stated that the test is executed on dumbbells shape specimens (7.5 cm length and 0.5 mm thickness) and suspended in a oven heated to 200◦C. 20 N/cm2 load was attached to the bottom end of the sample during 900 s (15 minutes). An elongation L, under load, was measured between two marked lines on the middle of each sample. The initial distance between the two lines was L 0 = 20 mm and the percent of hot elongation is calculated by (L − L 0)/(L 0∗ 100). A permanent elongation was measured again after 5 minutes in the oven without load. The crosslinking progress is displayed in Fig. 1.
2.3.2. Mechanical testing
Mechanical tensile measurements were carried out according to IEC 60540 on dumbbells shape specimens (7.5 cm length and 0.5 mm thickness) using Zwick-Roell 501appartus (Germany) at room temperature. The used stretching speed is constant and equal to 100 mm/min. Tensile strength and elongation at rupture were measured simultaneously and each represented value is the arithmetic average of five measurements.
2.3.3. Fourier Transform Infrared (FTIR) spectroscopy
At microscopic scale and from a chemical point of view, FTIR helped us to highlight the evolution of siloxane bonds and carbonyl components absorptions during weathering aging. IRAffinity-1 spectrometer (Shimadzu Corporation, Kyoto, Japan) was used to record spectra from 400-4000 cm−1 with a resolution of 4 cm−1. The presented spectra are the average of 32 scans.
2.3.4. X-ray diffraction analysis
Morphological changes of Si-g-LDPE under accelerated cyclic weathering aging are assessed with wide angle X-ray scattering. Xpert-Pro MPD spectrometer (Malvern Panalytical GmbH, Kassel, Germany) with Cu-Kα radiation having wavelength of 1.54060 A was used. The scan is performed at˚ 50 kV and 1 mA. The Bragg’s angle 2θ scanning covers an interval ranging from 5◦ to 90◦ stepped by 0.02◦ and 0.4 s/step scan rate.
2.3.5. UV-Visible analysis
UV-Visible (UV-Vis) is a powerful tool to study many optical properties of polymers such as optical absorption coefficient, refractive index and transmittance. UV-Vis transmittance spectra in the wavelength range 200-800 nm of unaged and aged Si-g-LDPE were obtained using a UV- 2100 Shimadzu spectrophotometer (Shimadzu Corporation, Kyoto, Japan).
3. Results and discussions
3.1. Flow-up the cross-linking process under accelerated weathering aging
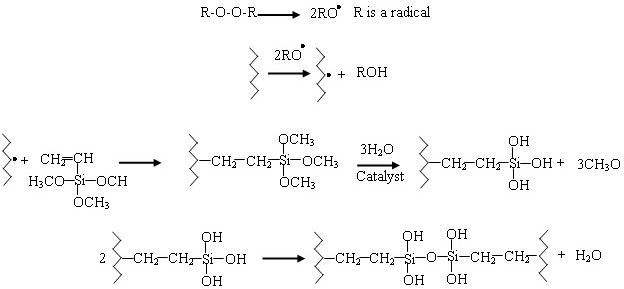
SIOPLASr cross-linking process was achieved with two successive steps: in the first one, silane side groups (mainly vinyltrimethoxysilane VTMS) are grafted on polyethylene chains; and in the second one the hydrolysis followed by condensation of silane functions transforms them to silanol side groups (Si-OH) then creation of intermolecular siloxane junctions (Si-O-Si). The chemical reactions involving in this cross-linking process are presented in Fig. 2. When Si-gLDPE is subject to weathering conditions during its operation, the effect of these conditions on the cross-linking process is restricted at the second step. The evolution of crosslinking process is followed up in our study by using Hot-SetTest as a macroscopic test and FTIR as microscopic measurement. For the Hot-Set-Test, we have measured the elongation at rupture and the time to failure (break) of the sample (if it occurred) simultaneously as the aging time goes on. This test is highly considered as a straightforward way by the cables manufacturers to evaluate the cross-linking degree. The theoretical concept of this method is derived from the kinetic theory of rubber elasticity [18]. According to this theory, for each sample the number-average molecular weight between cross-links (Mc) can be calculated using the stress elongation results measured under high temperatures using Eq. (1):
where ρ is the density of the material at high temperature, R the gas constant, T the absolute temperature, F is the tensile stress, L represents the sample length measured just before breaking of sample or after the whole specific time, and L 0 corresponds to the measured initial length.
Furthermore, materials with high cross-linking degree present low hot elongation [19,20], consequently low Mc values.
Figure 3 shows the evolution of sample’s elongation under high temperature (200◦C) and time to failure (break) according to aging time. As can be seen, the evolution of crosslinking density presents two phases: In the first phase (from 0 to 288 h), the sample did not resist to the tensile stress under applied high temperature and the breakdown of the sample occurred after a critical time tc. In this phase the cross-linking process is evaluated by the evolution of this critical time.
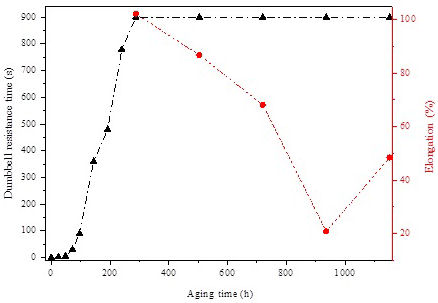
Moreover, it is clearly observed that during the first 48 h of aging, all the times to failure are relatively close (all less than 30 s), and only little increase was noticed in the first sub-phase. This sub-phase can be considered as an incubation period of the cross-linking process. After 48 h of aging (two aging cycles), another sub-phase begins where the critical time increases sharply to reach 900 s (15 min), suggested by IEC 60502 standard, after 288 h of aging.
This sharp increase indicates that only two aging cycles are enough to get a bulk penetration of the humidity caused by the spray and condensation steps leading to progressive formation of cross-links that bond chains with the help of trapped entanglements [21]. Hence, the elastic character of the samples was progressively enhanced. We may suggest that the material has a loosely crosslink network during this first phase. Beyond this aging duration, the second phase begins, and the samples resist to the load under high temperature (no breaking is occurred) during the specified test time (15 min). Variation of hot elongation is used in this phase to follow-up cross-linking progress in Si-g-LDPE. Between 288 h and 936 h, a decreasing trend is clearly observed (Fig. 3) in the evolution of elongation. It falls sharply from 102.3% to 20.8%. Earlier findings have made certain that a decrease in hot elongation is a straight consequence of the cross-linking degree growth [19,20]. The reached value is well below the general acceptable and recommended value by IEC 60811 standard (between 60% and 90%) for this material. The low value of elongation corresponds to high degree of cross-linking indicating that the material pass from the loosely crosslink network to a tight crosslink one. Hence, this compact network restricts chain movement and flexibility and as a consequence the material becomes brittle. Eventually, visible surface transversal cracking has occurred and observed during this period of aging. These parallel transversal cracks explain the extreme brittleness of the samples due to the high cross-linking degree. It is suggested that the observed damage was generated mainly by the UV irradiation and can be related to a chemical damage [17].
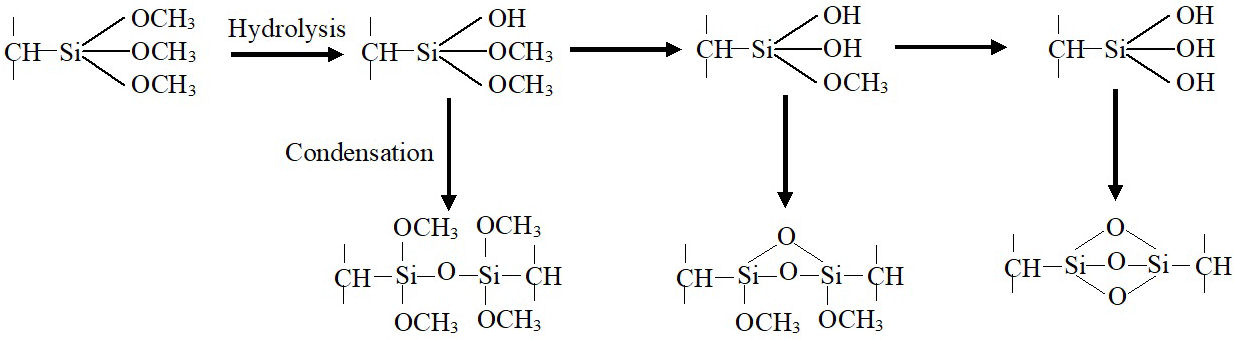
Furthermore, no level-off is observed in the elongation variations as observed in literature [21]. The monotone decrease of Hot-Set-Test elongation is highly linked to the increase of the created crosslink points within the polymer network. The increase of crosslink points may be attributed to the fact that each silane fragment presents three alkoxy groups capable to create poly-functional connecting points despite the maximum gel content was reached [22] as presented in the scheme of Fig. 4. This point will be checked in the FTIR analysis. Prolonging the aging time under the applied weathering conditions more than 960 h, chain scission becomes the predominant process leading to the HST elongation’s increases reaching 48.5 % after 1152 h of aging.
When it comes to the FTIR results, the cross-linking reactions lead to the modification of the digital fingerprint of the polymer, hence, the modification (appearance or disappearance) of many absorption bands in the FTIR spectra. The alterations in digital fingerprint are shown in the FTIR spectra by all modifications in the bands ranging from 400 cm−1 to 1500 cm−1.
FTIR spectra of virgin and aged samples of Si-g-LDPE are presented in Figs. 5a) to 5e). The digital fingerprint of virgin sample [(Fig. 5a)] is caracterized by the presence of two important peaks at 1192 cm−1 and 1092 cm−1 which are associated to Si-OCH3 stretching [23]. The intensities of these peaks decrease with increasing weathering aging time until its disappears approximately after 288 hours of aging [Figs. 5b) to 5d)]. It is worthy to note that the peak at 1192 cm−1 disappears rapidly than the other peak. The decrease in the intensities of these peaks clearly reveals the progression hydrolysis of Si-OCH3 groups to form Si-OH silanol groups [11,10]. The wide-ranging band from 3800 cm−1 to cm−1 centred at ≈ 3450 cm−1 [Fig. 5e)] is essentially attributed to stretching of OH in Si-OH groups [13]. This broad band supports the hydrolyzation of Si-OCH3 assumption. The intensity of this band increases with increasing weathering aging time until 504 h, then decreases with aging time. On the other hand, we note the formation of a different siloxane linkages presenting absorption bands at 1122 cm−1 and 1048 cm−1, which are produced from the silanol groups condensation [11,24]. These new peaks characterize the new digital fingerprint of the Si-g-LDPE which is transformed into Si-XLPE. This new fingerprint strats earlier at 48 h by the appearance of small new peak at 1048 cm−1 which appears as a shoulder on the large band at 1042 cm−1. This peak corresponds to a single siloxane (Si-O-Si) [11,25]. After 144 h, we noticed the formation of two small peaks at 1117 cm−1 and 1121 cm−1 corresponding to multi-siloxane linkages (Si=(O)2=Si) or (Si≡(O)3 ≡Si) which appear as shoulders on the large band of Si-OCH3 at 1192 cm−1 and 1092 cm−1, respectively [25,26] (see scheme of Fig. 4). It is very clear from Figs. 5b) to 5d) that as the aging time increases the intensity of the peaks at 1117 cm−1 and 1121 cm−1 also increase, which may explain the continious increase of the crosslinking network density. This result supports the previous observed evolution in the Hot-Set-Test elongation. It is noteworthy that in the end, the peak at 1192 cm−1 and 1092 cm−1 are disappearing completely.
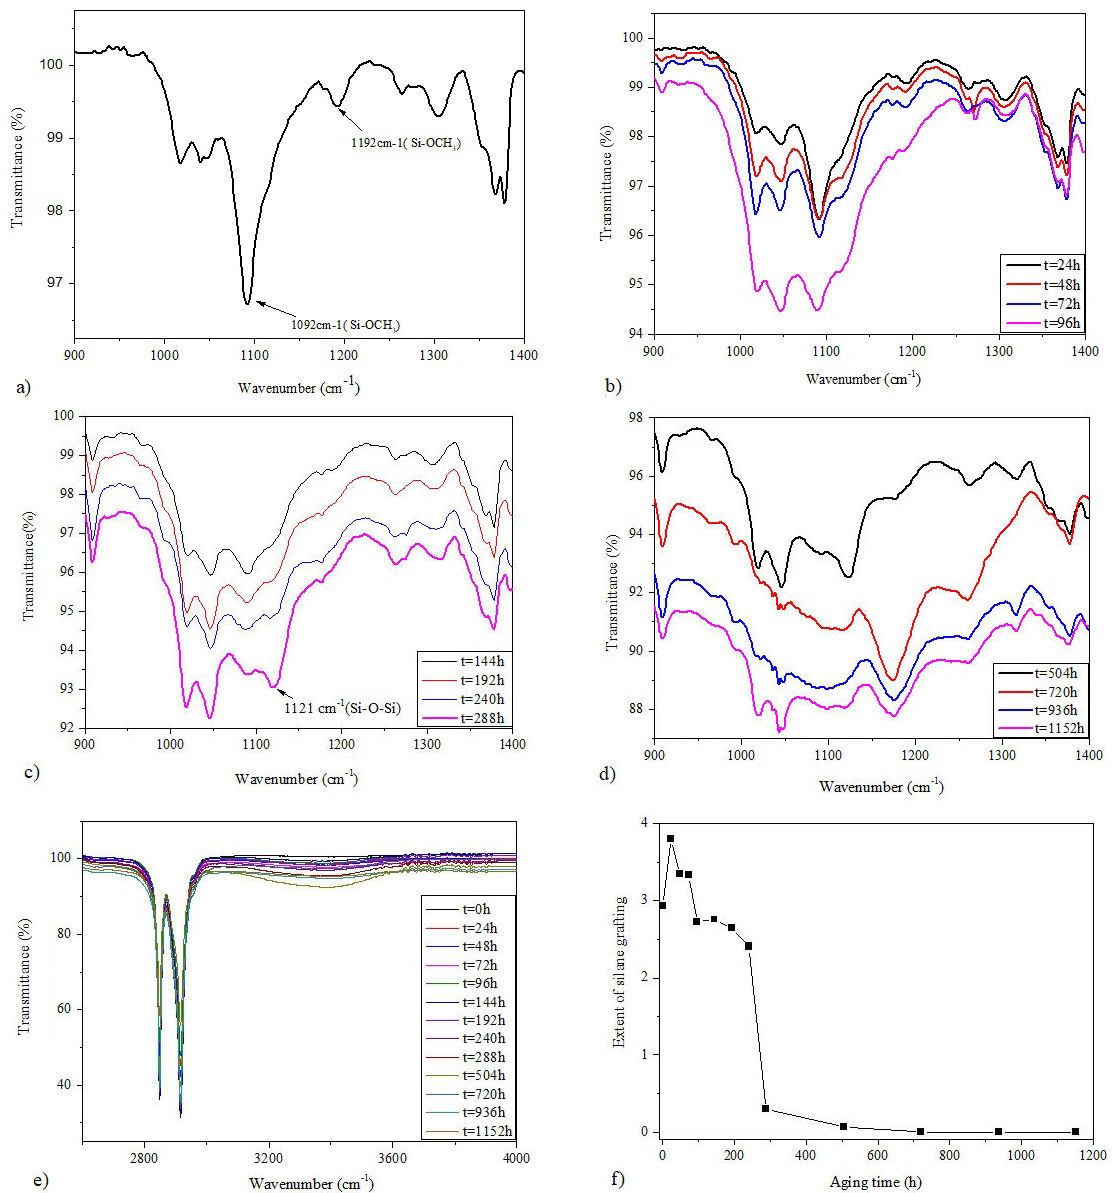
FIGURE 5 FTIR spectra of Si-g-LDPE. a) Spectra from 1400 cm−1 to 900 cm−1 for fresh sample. b), c), and d) Spectra from 1400 cm−1 to 900 cm−1 for aged samples at different aging periods. e) Spectra from 4000 cm−1 to 2700 cm−1 for all samples. f) Variation of silane grafting extent as a function of weathering aging.
To quantitatively evaluate the evolution of crosslinking process by using the FTIR results, the extent of silane grafting is calculted. The extent of silane grafting is the quotient between the surface under the absorbance peak at 1092 cm−1 and the area under the absorption peak of (-CH3) groups at 1378 cm−1 (wich is a characteristic peak for polyethylene and is used as an internal standard) [27,28]. It can be given by the following equation:
where R is the extent of silane grafting, and A 1092 and A 1378 represent the area under the absoption peaks at 1090 cm−1 and 1378 cm−1, respectively. R is also called the absorption index of Si-OCH3. The variation of R according to aging time is depicted in Fig. 5f). It is clearly seen that the Si-OCH3 absorption index declines with the growth of weathering aging time. This result confirms and supports the outcome occurrence of silane cross-linking reaction [29].
3.2. Flow-up the effect of accelerated weathering aging on photo-oxidation degradation
It is believed that weathering aging affects almost all the macroscopic and microscopic characteristics of semicrystalline polymers. To follow-up the photo-oxidation degradation of Si-g-LDPE under accelerated weathering aging we have followed the same methodology as in section 3.1. At macroscopic scale mechanical properties are useful indicators to evaluate the extent of degradation level. They provide information about the evolution of bulk material, but little information is gained about the chemical and microscopic modification. Therefore FTIR analysis is used here to evaluate the degradation process at microscopic scale.
The evolutions of elongation at break and tensile strength according weathering aging time are presented in Figs. 6a) and 6b). Based on earlier findings [8], we expect a decrease in mechanical properties due to the polymer degradation.
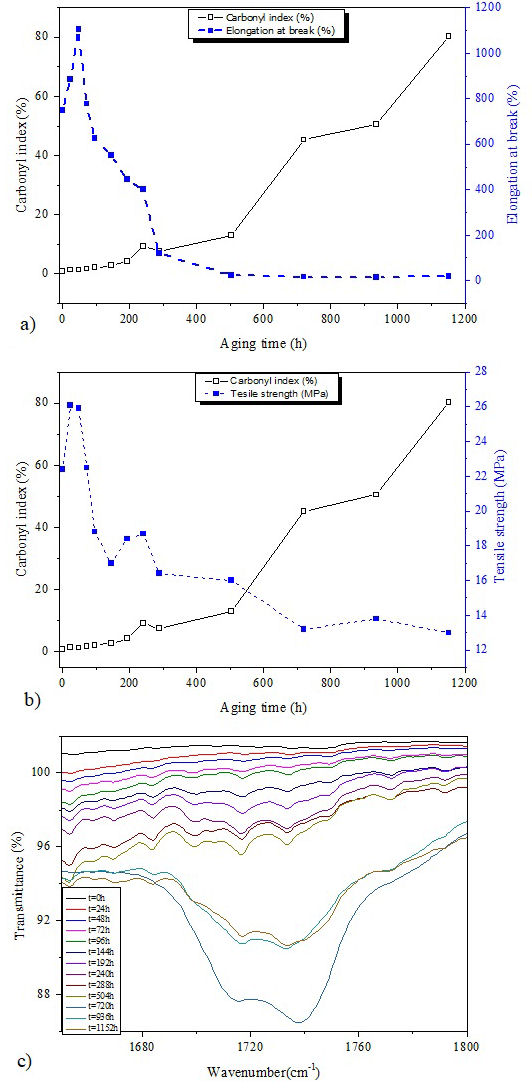
FIGURE 6 a) Elongation at break and carbonyl index versus aging time. b) Tensile strength and carbonyl index versus aging time. c) FTIR spectra of all Si-g-LDPE samples from 1600 cm−1 to 1800 cm−1.
However, it was not the case for our studied material. It is clear from Fig. 6 that the evolution of elongation at break of Si-g-LDPE presents three different stages with respect to aging time: In the first stage (between 0 h and 48 h) the elongation at break presents an increasing tendency from 750 % to 1125 %. The second stage between 48 h to 288 h is characterized by the decrease of elongation at break from 1125 % to reach around 380 %. No level-off is observed in this phase. In the third stage, the elongation at break decreases in a very fast way at the beginning and leveled-off after that to reach a steady state at the end of the aging time. The final value of the elongation at break after 1152 h of aging is around 24.5%. Besides, the tensile strength follows the same behavior as the elongation at break. Similar three degradation stages are evidenced by many researchers in the case of low density polyethylene subjected to the accelerated weathering aging [30,31]. Furthermore, our results may be interpreted regarding their finding. During the first stage (0-48 h), the photo-oxidation degradation starts mainly in the amorphous regions because of the higher permeability to oxygen, and characterized by the surface abrasion escorted by the permanent cross-linking and chain-scission reactions [32]. Due to the high mobility of chains segments in the amorphous parts, the cross-linking probability is strangely excessive. In the case of Si-g-LDPE this probability is greatly boosted by a very favorite situation (presence of favorite conditions of silane cross-linking process) which reduces the duration of the polymer’s ductile behavior to only 48 hours.
This ductile stage presents a very low cross-linking degree leading to the elongation at break and tensile strength increase. For a longer exposure time (beyond 48 hours), a remarkable fall of mechanical properties was observed. This quick decay is a sign of the ductile-to-brittle transition and the onset of stage 2. In addition, during this first stage a fast development of relatively high degree of crystallinity, as we can see in Fig. 7b), is observed.
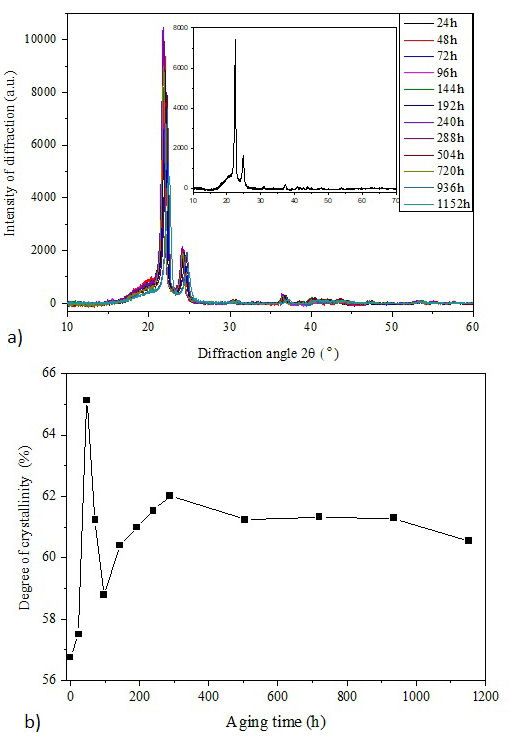
FIGURE 7 a) X-ray spectra of aged Si-g-LDPE. b) Variation of crystallinity according to weathering aging.
By the onset of the stage 2, the more crystalline behavior leads to stress-induced crack formation on the surfaces cracks as we have ascertained in Sec. 3.2.1. The formed micro-cracks act as initial breaking points leading to the development of surface cracks in width and depth promoting the enhancement of oxygen uptake and possibly speed-up the chains scission process. Chains scission process leads to the formation of functional end-groups. As accelerated weathering proceeds during this second stage, the cross-linking and chains scission processes continuous their appearance in parallel. Both mechanisms contribute in the brittleness of the material and mechanical properties drop until 288 h of aging. After this time (onset of stage 3) the degradation starts to affect the crystalline parts and the probability for cross-linking reactions starts to become less likely in the end of this stage 3 [30]. In parallel, material chains are more strongly affected by chains scission which explains the increase of Hot-SetTest elongation in Fig. 3.
To assess the photo-oxidation degradation at microscopic scale, the FTIR analysis is also very helpful. Upon weathering, bands for carboxylic acids, vinylidenes, peroxides and alcohols may change. This phenomenon could lead to the appearance of new groups in the carbonyl range between 1800 cm−1 and 1600 cm−1 [33].
In Fig. 6c), after 48 h of accelerated weathering aging of Si-g-LDPE samples, carbonyl groups were formed like carboxylic acid (at 1717 cm−1), ester (at 1733 cm−1) and aldehid (at 1772 cm−1) [34,35] but with moderate intensities. The absorption bands of these groups increase with increasing aging time until 720 h. At this aging time, the carboxylic aldehid group (at 1772 cm−1) disappears and forms two strong absorption bands between 1771-1682 cm−1 centered at 1717 cm−1 and 1737 cm−1 which correspond to carboxylic acid and carboxylic aster, respectively. At 936 h, we have noticed a strong peak of carboxylic aster is formed which could be the result of the reaction between carboxylic acid and alcohol compounds existing as impurities of Si-gLDPE [35], where the ester is a derivative components of carboxylic acid. At a higher temperature, carboxylic acid is converted to an ester according to the following principal chemical reaction [33,35]:
To highlight some cross-correlation between both macroscopic and microscopic scales, carbonyl index (CI) is plotted according to the aging time in the same figures with mechanical properties [Figs. 6a) and 6b)]. We recall here that carbonyl index is a quantitative way to show the photo-oxidation degree and it is given by:
where A1733 is the area under carbonyl absorption groups which takes place at 1733 cm−1 and A 1465 is the area under the standard peak at 1465 cm−1.
It is clear from Figs. 6a) and 6b) that both mechanical properties and carbonyl index present a similar trend of changes. The rise of carbonyl index is accompanied by a decline of mechanical properties. This behavior indicates the existence of a certain degree of cross-correlation between macroscopic and microscopic scales and evidences the existence of same degradation mechanism.
From these figures, the CI exhibits a monotonic increase change which lies perfectly with the observed three degradation stages. As the CI is a quantitative indicator of the polymer oxidation under UV radiation, the three stages may be related to the well known steps of polymer’s oxidation (initiation, propagation and termination). CI exhibits almost no change from 0 h to 48 h (initiation step of oxidation). Beyond 48 h of aging, CI begins to increase due to propagation and auto-acceleration of oxidation process leading to the enhancement of polar carbonyl products. After 288 h of aging, CI increases sharply (seem to be exponential). This prompt intensification in carbonyl index could be ascribed to the formed oxidized groups by the chains scission process in the Si-g-LDPE backbone. Chains scission has, firstly, a dramatic effect on the brittleness of the material and the fast drop of mechanical properties [36], and secondly, the creation of a massive quantity of polar oxidized products. Furthermore, chains scission might create pairs of alkoxy radicals [30]. The reactions of alkoxy radicals might result in the formation of more polar groups making the further increase of CI.
3.3. Evolution of microstructural and optical properties under accelerated weathering aging
More insights on the effect of cyclic accelerated weathering aging can be gained by the track of microstructural and optical properties according to the aging time. Microstructural changes lead to the variation in crystallinity degree and size of crystallites of semi-crystalline polymers. X-ray diffraction is used in this part to track these features. Moreover, UVvisible spectrophotometer is used to track the evolution of optical properties of the material.
3.3.1. Evolution of crystallinity with accelerated weathering aging
Figure 7a) displays X-ray spectra of aged samples at different periods ranged from 24 h to 1152 h. The inset represents the diffractogram of the fresh sample as a reference. It is observed that all spectra have two main diffraction peaks appearing at 22.5◦ and at 24.8◦ which correspond to (110) and (200) planes, respectively [37], associated to an amorphous boss. It seems from this figure that the angle (2θ) of two peaks was slightly changed with weathering aging.
The change in (2θ) angle affects many structural parameters of the material like crystallite size, inter-planar distance and inter-chain separation. These parameters can be calculated as follows [38]:
where λ = 1.54 nm is the wavelength of the used Cu-Kα Xray radiation, β is the full width at half maximum (FWHM) of the diffraction peak, θ is the Bragg angle (in radians), k is the Scherer constant (equal to 0.9), Cs is the crystallite size (Å), R is the inter-chain separation (Å) and d is the interplanar distance (Å). Table II lists the calculated parameters using the principal peak.
TABLE II Calculated structural parameters with respect to the prominent peak.
| Weathering
aging time (h) |
2θ(◦) | FWHM (◦) | Crystallite
size, Cs (Å) |
Interchain
separation, R (Å) |
Interplanar
distance, d (Å) |
| 0 | 22,5 | 0,4368 | 191,64627 | 4,93608 | 3,94887 |
| 24 | 21,8 | 0,4368 | 191,48139 | 5,09257 | 4,07406 |
| 48 | 22 | 0,5616 | 146,99397 | 5,04684 | 4,03747 |
| 72 | 22,17 | 0,4992 | 166,29886 | 5,00862 | 4,00689 |
| 96 | 21,82 | 0,4368 | 191,48782 | 5,08796 | 4,07037 |
| 144 | 21,86 | 0,4992 | 166,22929 | 5,07876 | 4,06301 |
| 192 | 22,07 | 0,4992 | 166,27672 | 5,03103 | 4,02482 |
| 240 | 21,77 | 0,468 | 177,92611 | 5,09951 | 4,0796 |
| 288 | 21,85 | 0,5304 | 155,98924 | 5,08106 | 4,06485 |
| 504 | 22,23 | 0,4992 | 166,31283 | 4,99527 | 3,99621 |
| 720 | 21,85 | 0,4992 | 166,22649 | 5,08106 | 4,06485 |
| 936 | 22,31 | 0,4368 | 191,60114 | 4,97758 | 3,98206 |
| 1152 | 22,59 | 0,7488 | 109,38697 | 4,91667 | 3,93334 |
The crystallinity degree of semi-crystalline polymers can be deduced from X-ray spectra by using the following formula:
where A c is the portion of crystalline phase and A a is the portion of amorphous phase.
The evolution of crystallinity degree according to weathering aging time is given in Fig. 7b). This figure shows that crystallinity of Si-g-LDPE exhibits an abrupt and sharp increase after 48 h of aging process from 56.8 % to 65.4 %. This sharp increase is caused by the very loose network of the material at this first sub-phase of aging.
The looser network provides to shorter chains more mobility and freedom to crystallize more easily. By the onset of second sub-phase (after 48 h), the exhaustive development of crosslink points (Fig. 3) restricts the mobility of chains and then limits its integration into the preexisting crystallites.
This behavior may explain the decreasing trend of crystallinity variation. If we take again the carbonyl index presented in Fig. 6, it is evidenced that oxidation degradation leads to the chains scission process [8].
Therefore, sharp increase of carbonyl index after 96 h of aging is related to chains scission process. Chains scission process leads to the formation of new shorter chain segments.
Consequently, the new growth of crystallinity degree corresponds to the secondary crystallization of these mobile short segments resulting from the oxidative cleavage of the polymer backbone. The crystallization progression may stop if the developed defects created by oxidation and chain scission are enough to prevent the further migration and alignment of chain segments [39]. This behavior might probably explain the observed level-off in the crystallinity variation after 288 h of aging.
The crystallinity degree is leveled-off at about 61%, in line with the observed level-off in the mechanical properties variation [Figs. 6a) and 6b)] and the extent of silane grafting [Fig. 5f)] which suggests the occurrence of coherent phenomena in the weathering aging process of Si-g-LDPE.
It is worthy to state in the end of this section that the increase of the crystallinity contributes to further stiffening in the polymer upon photo-oxidation. It was highlighted by many works [17,40] that photo-oxidation creates new secondary crystallites. This process is called chemicrystallization and is clarified by the given scheme in Fig. 8.
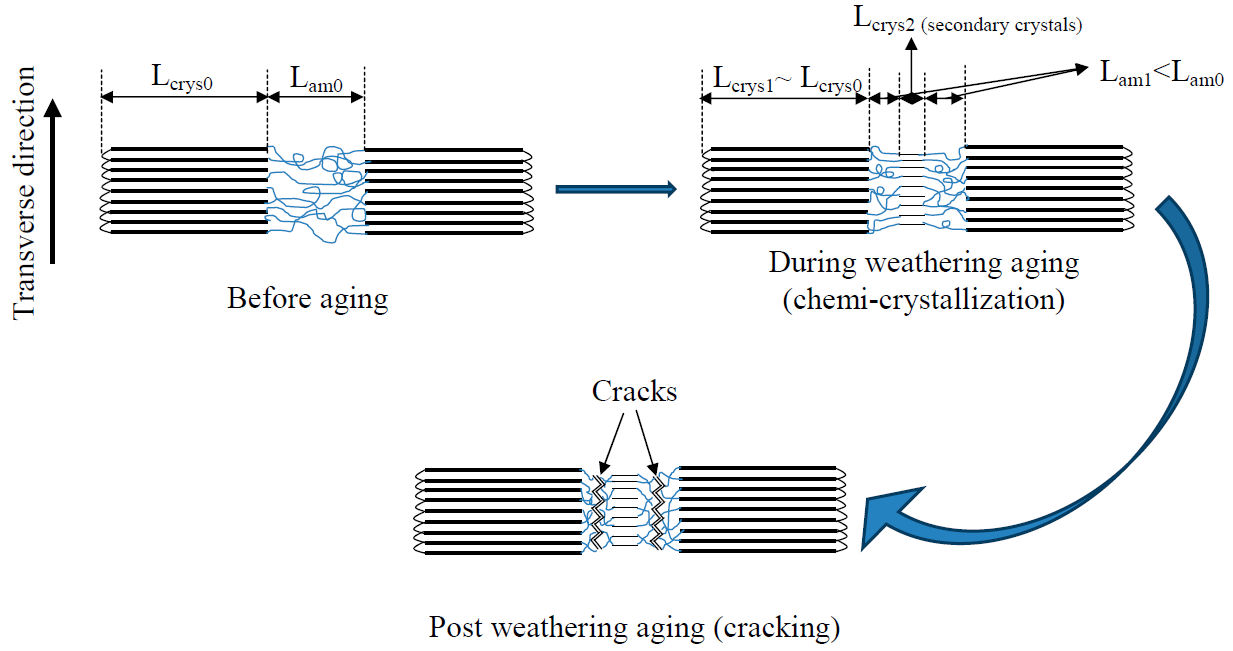
FIGURE 8 Chemi-crystallization scenario leading to cracks formation by introducing secondary crystallization.
This scheme illustrates that during photo-oxidation process, the semi-crystalline polymer preserves the thickness of its primary crystalline region, however, the amorphous domain decreases by the re-crystallization of newly formed crystalline domain creating secondary crystallites and were strictly limited within the amorphous region. Consequently, the amorphous part shrinks by the growth of the crystalline part that gains extra organization. With the development of secondary crystallites the inter-lamellar space is reduced, causing the embrittlement of Si-g-LDPE, therefore promoting the formation of cracks and the occurrence of sharp transition from ductile behavior to brittle one.
3.3.2. Effect of accelerated weathering aging on the optical properties
Thanks to UV-Vis spectroscopy, the optical properties of polymeric materials can be well characterized. The UV-vis absorption spectra of unaged Si-g-LDPE and aged one at different aging periods under accelerated weathering aging are shown in Figs. 9a) and 9b). An inset of enlarged view between 200 nm and 280 nm is inserted within each figure. From the fresh sample spectrum, the UV-Vis curve contains two parts according to the absorbance variation with wavelength. The first part ranged from 200 nm to 235 nm where three peaks can be observed with absorption maximums at 208 nm, 217 nm and 230 nm. The absorption peaks are originated from electronic vibration of conjugated double bands -(CH=CH)2- and -(CH=CH)3- [41]. A shoulder is observed at 285 nm and assigned to the π − π ∗ transition in unsatured ketones [42].
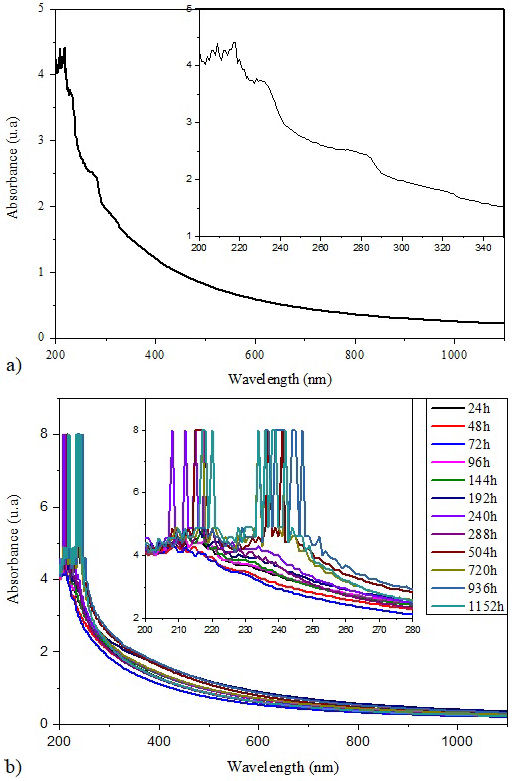
The second part ranging from 235 nm to 800 nm and decreases dramatically (in exponential way) to get close zero. This part is called the edge of absorbtion of the polymeric material. Accelerated weathring aging has a noticiable effect on both parts of the UV-Vis spectra. Weathring aging leads in one hand to the move of the absorption edge in the direction of the longer wavelength especially for samples aged to time longer than 540 h. On the other hand, the appearance of two broad absorption bands (maximum at 217 nm and 240 nm) filled with multiple marked sharp and intense peacks.
The second broad absorption band becomes more pronounced with increase of aging time [inset of Fig. 9b)]. The sharp peaks have been observed only for samples aged to time longer than 240 h. The move of the absorption edge in the direction of the longer wavelength and the appearance of sharply absorption peacks are mostly due to the development of radicals, unsaturated bands, oxidized components and conjugated bands resulting from the chains scission process [42].
3.3.2.1. Effect of accelerated weathering aging on the band gap
The optical band gap (E opt) of Si-g-LDPE was deduced from UV-visible spectra. The band gap of semiconducting materials and polymers generally has two compenents: direct and indirect band gaps [43]. Mott and Davis formula for incident optical transition was used to calculate the optical energy gap for each sample [44]:
where α is the absorption coefficient, ω is light frequency which equals the ratio of wavelength and velocity of light, ℏ is Plank constant, β is a constant, n is an index determined by the nature of the electronic transitions during the absorption process and E opt is the optical energy gap. The Tauc’s graph plots of (αℏω) n versus optical energy (ℏω) for both optical transitions: direct (n = 1/2) and indirect (n = 2) [45], are shown in Figs. 10 and 11, respectively.
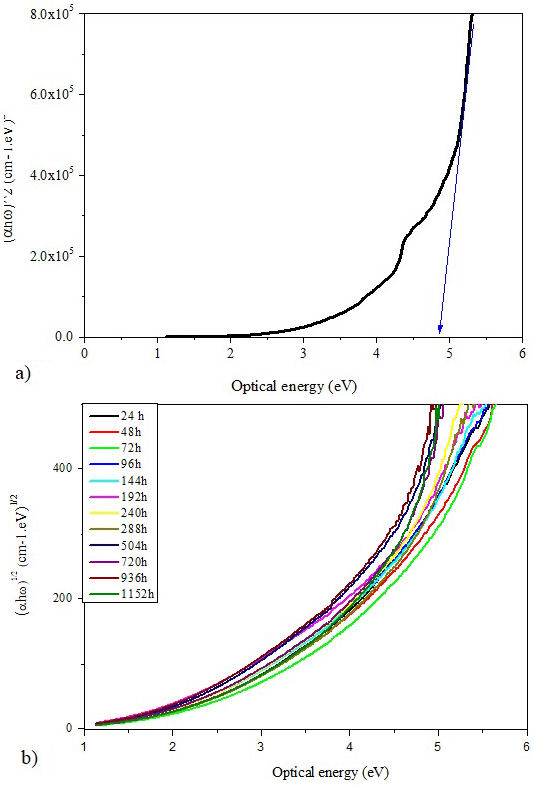
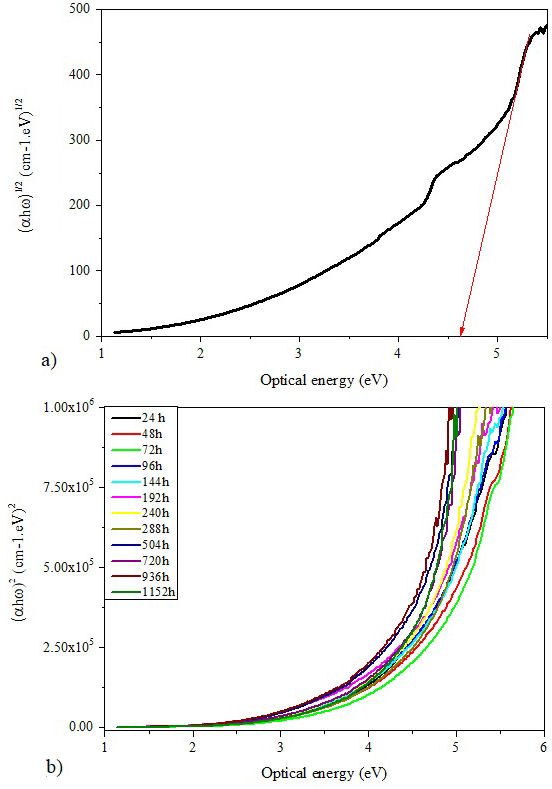
The energy gap can be extrapolated by determining the intercept of the linear portion of the curves to the beginning of the absorption edge on the energy axis. at (αℏω)2 = 0 and (αℏω) 1/2 = 0 [43]. The direct and indirect E opt values of all samples are ploted in Fig. 12 according to the aging time. It is clear that both optical band gaps (direct and indirect) behave in the same way. They increase until the weathering aging time reaches 144 hours and decrease afterwards. The increase of the optical band gaps at the beginning of aging indicates that the insulating character of the material is enhanced which may have a significant effects on the dielectric properties of the insulation.
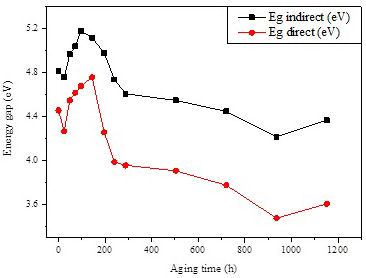
Besides, the decrease of band gaps with extended aging time indicates that the energy required for electronic transition decreased, which suggests the possibility to create new intermediate states that facilitate electronic transitions between molecular orbitals. The decreasing behavior confirms that weathering aging produces faults and imperfections in Si-g-LDPE polymer structure, such as bond rupture, free radicals, oxygenated functions, cross-links, etc., which lead to growth in electronic disorder which is responsible for creating permitted states in the forbidden band or the deformation of valence band [46]. The disorder in the crystalline structure of the material can also have an effect on the observed decreasing tendency of the optic band gaps [43].
3.3.2.2. Effect of accelerated weathering aging on Urbach energy
The Urbach energy can be used to estimate the amorphous character of the polymer, where an increase in the amorphous nature of the polymers materials corresponds to an increase in Urbach energy [45]. The importance of this quantity resides in its help for understanding the electronic transport properties of materials. The absorption coefficient (α) is described by the Urbach formula [46]:
where α 0 is a constant and E u is an energy interpreted as the width of the tail of localized states in the forbidden band gap.
The Urbach energy E u was estimated from the plot of ln(α) according to ℏω. The variations of E u with weathering aging time are presented in Fig. 13. It is clear that Urbach energy changes with the increase in weathering aging time. It is well known that the decrease in Urbach energy indicates the increase in the crystalline part [47]. This is what has been observed with the onset of weathering aging. The Urbach energy decreases from 0.95 eV to 0.85 eV after 48 h of aging. In this period of aging, it may occur a remodeling of the polymer structure leading to a more ordered structure as a result of the very looser character of the polymer network. However, the increase of Urbach energy after 48 h of aging indirectly indicates an increase not only in the amorphous phase, but also in the non-homogeneous disorder of polymer’s amorphousness [45].
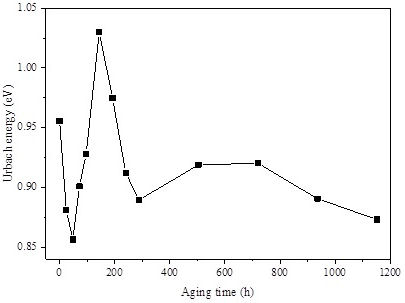
The sharp rise of tail widths (E u ) can be attributed to the growth of crosslink points in the amorphous region of the polymer (one may admit that crosslinks acts as faults and imperfections in the amorphous part). After 144 h of aging, the Urbach energy reaches 1.02 eV. Afterwards, chemicrystallisation onsets and the amorphous region shrinks by the growth of the crystalline phase that gains supplementary organization. Hence, Urbach energy falls down again to reach 0.87 eV after 1152 h of aging. These results inversely roughly correspond with a degree of crystallinity variation measured with X-ray measurements.
3.3.2.3. Effect of accelerated weathering aging on optical dielectric properties
The optical complex dielectric constant is another important intrinsic property that can be used for characterizing the optical properties of materials because it depends sensitively on the band structure of the material. Optical dielectric constant has real and imaginary parts. The real part (∈ r ) of dielectric constant reveals the speed of light that can be slowed down in the material, whereas the imaginary part (∈ i ) shows the absorption of energy from an electric field due to dipoles motion [47].
The real and imaginary parts can be calculated by:
where n is refractive index and k is extinction coefficient. n and k were determined from the below equations [48]:
where ℜ is the reflectance, A is the absorbance, T is the transmittance, λ is the incident light wavelength and λ is the absorption coefficient. Figures 14a) and 14b) display the evolution of the real and imaginary parts of optical dielectric constant with wavelength for the virgin and aged Si-g-LDPE samples.
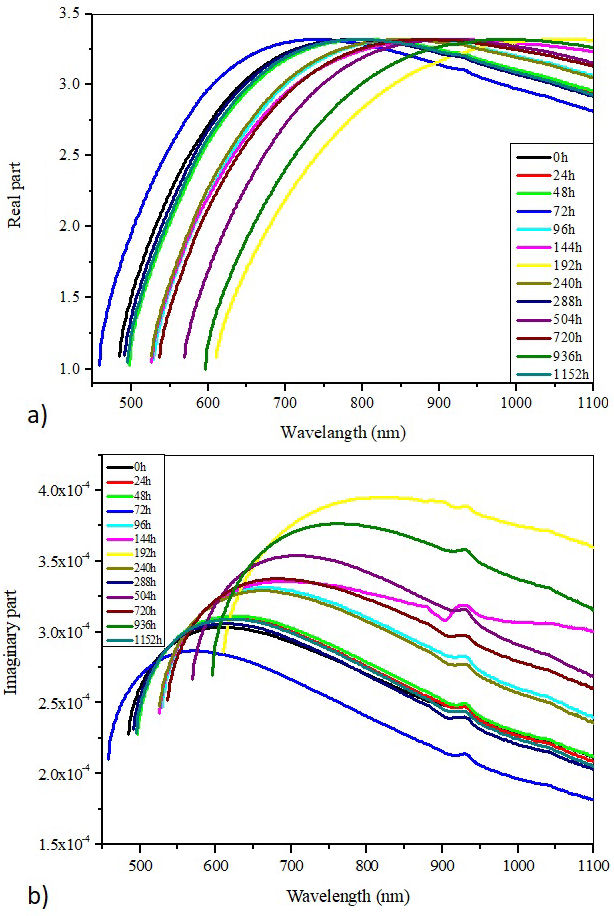
FIGURE 14 Plots optical dielectric constant as a function of wavelength. a) Real part. b) Imaginary part.
It is interesting to observe that the variation of both real and imaginary parts increase and decrease similarly. One relaxation mode (maximum in the variation of each property) is observed situated between 700 nm and 1000 nm for the real part, and between 550 nm and 800 nm for the imaginary part. This behavior is observed for all different aging periods. The changes in the optical dielectric constant with aging time can be ascribed to changes in the density of states because the dielectric constant is straight related to the density of states within the forbidden gap. According to previous statements (based on the X-ray and FTIR results), structural changes occurred in the polymer matrix after weathering aging. These structural changes may lead to the appearance of defect sites in the material’s band gap. These defects could lead to the formation of charge carriers traps that change the polyethylene’s ability to store charges and hence cause changes in the dielectric constant [49]. Another point must be assertained here, that is the dielectric loss spectral peaks changes with wavelength and consequently with frequency upon aging time. These results disclose that optical relaxation time (τ) varies with variation in charge carrier concentration, because of dielectric loss and τ are inversely related each other [50]. It can be noted also that real and imaginary parts of optical dielectric constant display a scattering performance with wavelength. Such scattering is significant for practical purposes, because the dispersion factor plays a predominant role in the practical use of the studied material.
4. Conclusions
The behavior of Si-g-LDPE under accelerated cyclic weathering aging was assessed by macroscopic and microscopic methods. Two main objectives were fixed initially. The first objective is to follow-up the cross-linking process under weathering conditions, which present a favorable environment for the silane cross-linking process of polyethylene. Hot-Set-Test and FTIR are successfully used to achieve this objective. The obtained results confirmed the occurrence of cross-linking reactions by, on one hand, the increase of time to failure or decrease of Hot-Set-Test elongation, and on the other hand, the weakened intensities of Si-OCH3 functionality groups and elevated intensities of Si-O-Si group peaks in the FTIR spectra. The whole cross-linking period was divided into two phases. During the first phase the material presents a loosely crosslink network, nevertheless, it passes to a tight crosslink network during the second phase. Eventually, the material becomes brittle and visible surface transversal cracking has been observed during this period. The second objective was reached by the assessment of photooxidation under weathering aging effects on the mechanical behavior of Si-g-LDPE. After a short ductile behavior, leading to an increase of mechanical properties at the beginning of aging, a brittle behavior was observed where the mechanical properties drop down. The decrease of mechanical properties is directly linked to the undergone photo-oxidation process. The evolution of mechanical properties and carbonyl index was found to be similar. The overall photo-oxidation degradation is done in three successive steps during the all aging period. The weathering aging effects on microstructural features is checked thanks to X-ray measurements. An abrupt increase in the crystallinity of Si-g-LDPE was observed at the beginning of aging. This fast increase of crystallinity is one of the responsible mechanisms in the rapid transition from the ductile to brittle behavior of the material. At advanced stage of aging, the crystallinity is leveled-off at moderate value. This level-off is the consequence of the defects created by oxidation and chain scission preventing the further migration and alignment of chain segments. The concluding remarks concerning the effect of weathering aging on the optical properties are: (i) the direct and indirect band gaps increase at the beginning of aging and decrease afterwards; (ii) the Urbach energy follows a reverse behavior corresponding to the aging time as seen in the crystallinity variations; and (iii) the real and imaginary parts of the optical dielectric constant present one relaxation mode for all different aging periods. The changes in the optical dielectric constant with aging time can be attributed to a change of the density of states within the forbidden gap.

