


 nueva página del texto (beta)
 Inglés (pdf)
 Artículo en XML
 Referencias del artículo
 Enviar artículo por email
 Citado por SciELO
  Similares en
SciELO
Similares en
SciELO 
 Permalink
1. Introduction
Soil magnetic properties depend not only on the type of parent material but also on processes that take place during pedogenesis, which are controlled by environmental conditions and can be modified by anthropic influence. Pedogenetic processes can either maintain the original magnetic mineralogy or transform it. Maher (1988) and Geiss et al. (2004) have documented the in-situ formation of ultrafine (>0.1 μm) particles of ferromagnetic minerals, caused due to the decomposition of plants or the alternation of periods of humidity and aridity. The formation of antiferromagnetic minerals (hematite-goethite) is significant because they are a direct result of pedogenesis (under aerobic conditions) and can be correlated with the degree of soil development (Ji et al., 2004; Liu et al., 2007). Antiferromagnetic minerals are formed as a result of cyclical changes in soil moisture. Hot climates with dry periods can benefit hematite production, and goethite can be related to more humid conditions (Dixon et al., 1989, 2002; Balsam et al., 2004). Anthropic action can also modify the magnetic properties of soils; high-temperature such as the generated by wildfires can account for the presence of iron oxyhydroxides like goethite (αFeOOH), lepidocrocite (γFeOOH), and ferrihydrite (5Fe2O3·9H2O) in soils as heating to moderately high temperatures (~300-400°C) in the presence of organic matter results in the formation of strongly magnetic iron oxides (Oldfield and Crowther, 2007, Clements et al., 2011; Jordanova et al., 2018).
However, different studies on volcanic soils have documented that pedogenetic processes may not offset the effect of primary minerals present in volcanic ash, which is rich in ferrimagnetic minerals (Rivas et al., 2006; 2012).
The Trans-Mexican Volcanic Belt, which crosses Central Mexico in a west-east direction, includes lacustrine basins located at different altitudes (between 737 and 4283 masl) and under different climatic conditions (cold, dry and warm-humid climates) (Sigala et al., 2017). Relatively cold climates are related to more dilute lakes, dry climates are related to subsaline and hyposaline lakes, and warm-humid climates are related to eutrophic and hypertrophic lakes (Sigala et al., 2017). Such basins have been shown to have value either as paleoenvironmental archives (e.g. Bradbury, 1989; Lozano-García et al. 1993; Ortega et al., 2010) or as sensitive records of environmental changes and human activities (e.g. Fisher et al., 2003; Caballero et al., 2006; Ortega et al., 2010). The soils of these lake basins are also archives of the climatic conditions under which they were formed and sensitive to anthropogenic influence. Their properties can easily change due to losses of organic matter, aggregate stability, as well as by the transformation of amorphous minerals by dehydration (Buytaert et al., 2005; Perret and Dorel, 1999; Dörner et al., 2009; Beck-Broichsitter et al., 2016). For example, a loss of vegetation cover and poor soil structure resulting from anthropogenic disturbance such as deforestation can cause destabilization processes on slopes causing the movement of soil material into lake basins. In this way, the secondary minerals produced in soils by weathering or diagenesis can be transported to the lacustrine basins as a part of the detrital fraction (e.g., Chen et al., 2005, Maxbauer et al., 2016a). The occurrence of magnetite and maghemite in lake sediments or the maghemitization of (Ti)-magnetites (partial oxidation at low temperatures) may indicate the former pedogenic and weathering processes within detrital deposits before their transport to the lakes (e.g. Borruel-Abadía et al., 2015). The establishment of magnetic properties in both lake sediments and lake catchment soils have been studied together in several regions globally to analyze whether magnetic minerals in sediments are of pedogenic origin, identify catchment processes, and also make inferences about paleoclimatic conditions such as increased rainfall (e. g. Williamson et al., 1999; Hatfield and Maher, 2009; Zhong et al., 2018; Dearing et al., 2020). However, in central Mexico, the link between sediments and soils of the lake basins has not yet been established as a complete tool for paleoenvironmental reconstruction because the pedogenic processes in the soils of these basins have not been specifically studied, nor the evidence of landscape transformations caused by anthropogenic influence on them.
In this study, we analyzed, in a preliminary and exploratory way, the landscape history of two lake basins located in the central western and eastern sectors of the Trans-Mexican Volcanic Belt based on their soil characteristics: macro- and micromorphology, analytical properties, geochemistry, and rock magnetic properties. This research aims to generate information on landscape transformation in the two lake basins in Central Mexico based on the site-specific pedogenic processes on a centennial-millennial time scale as well as to identify the possible impacts of recent anthropogenic activities on those lake basins.
2. Study area
The study sites of two lacustrine basins are located in the central-western and eastern sectors of the Trans-Mexican Volcanic Belt (TMVB), respectively: Alberca de Tacámbaro (‘Tacambaro Lake’ from now on) in the Michoacán state and Lago Verde in the Veracruz state (Figure 1a). The TMVB is a 1000-km-long continental volcanic arc, active since the early and middle Miocene (23-13 Ma) (Gómez-Tuena et al., 2018), being formed by the subduction of the Cocos plate beneath the North American plate. The TMVB crosses Central Mexico (19º-21º N) from the Gulf of Mexico to the Pacific coast (99º-102º W). The TMVB has been divided into three sectors: western, central, and eastern (Ferrari, 2004; Gómez-Tuena et al., 2007a, b; Ferrari et al., 2012). The Michoacán-Guanajuato volcanic field, which is found within the central sector, is constituted by more than 1000 volcanoes of a basaltic or basaltic-andesitic composition (Hasenaka and Carmichael, 1987; Gómez-Tuena et al., 2007a; Osorio-Ocampo et al., 2018). The Los Tuxtlas volcanic field, which is located at the southern coast of the Gulf of Mexico, has only two main volcanoes - Santa Marta and San Martin, both having an approximate height of 1680 m a.s.l. and being formed by andesitic lavas since the late Cenozoic period (Geissert; 2004).
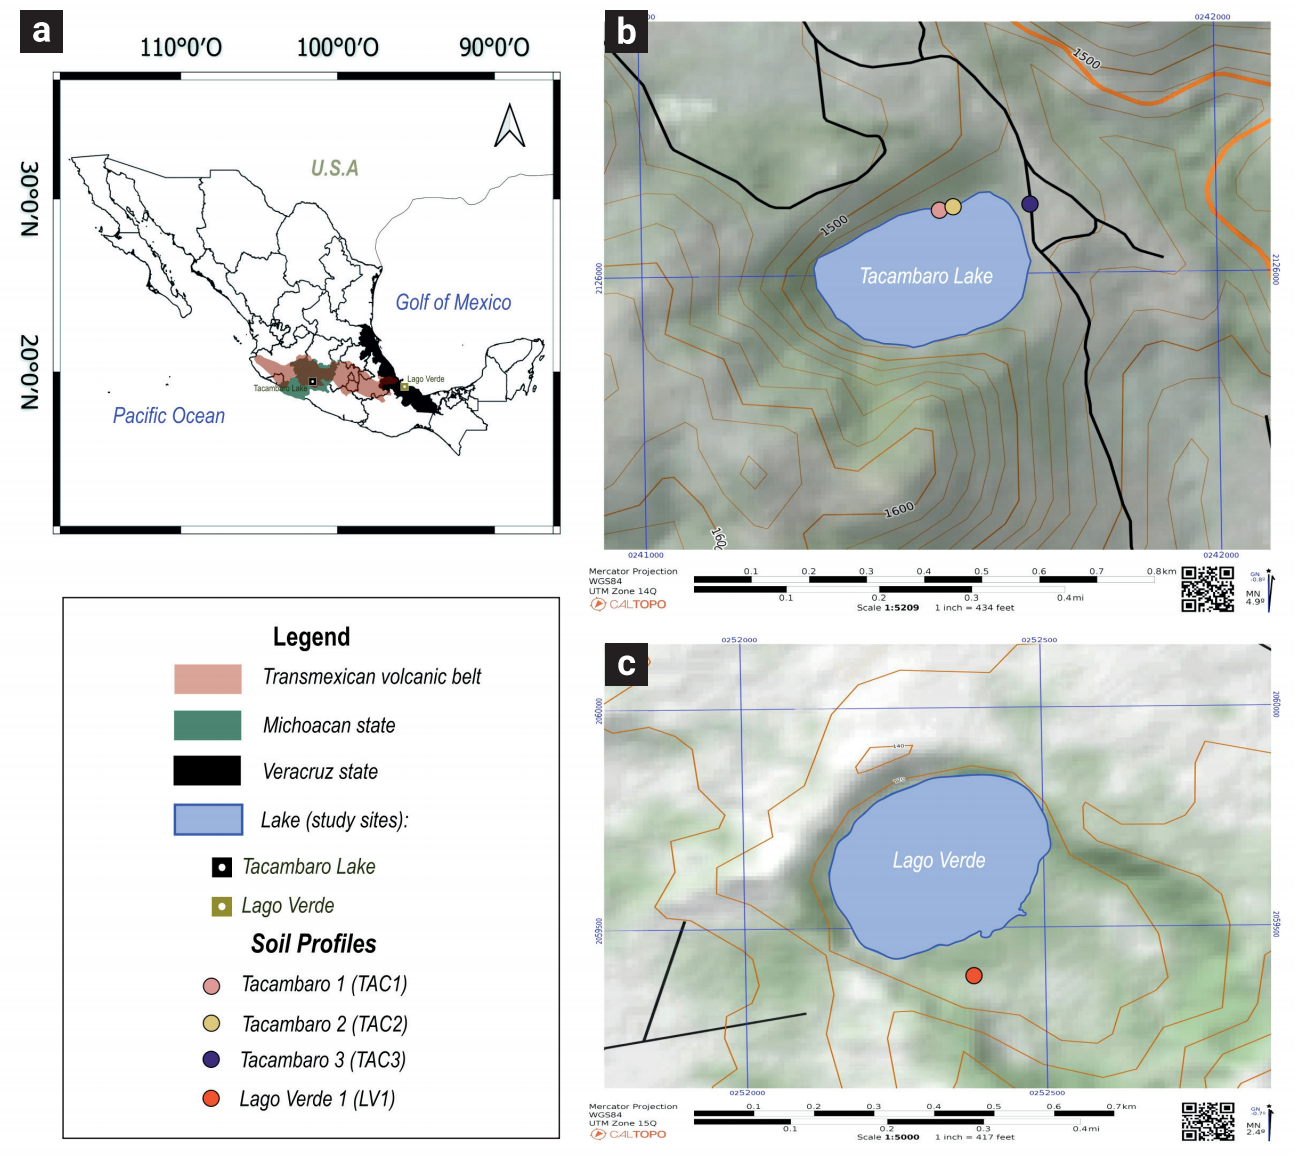
Figure 1 a) Location of Tacambaro Lake (Michoacan state) and Lago Verde (Veracruz state) in Central Mexico where the Trans-Mexican Volcanic Belt (TMVB) is located. b) soil profiles (TAC1, TAC2 and TAC3) position in the Tacambaro Lake. c) Location of Lago Verde 1 (LV1) soil profile in Lago Verde.
The Tacambaro Lake (Figure 1a) is located within the Michoacán-Guanajuato Volcanic Field (MGVF) (Ferrari et al., 2012; Larrea et al., 2019). The Tacambaro Lake is a maar lake at the altitude of 1480 m a.s.l. emplaced on Pliocene to middle Pleistocene volcanic rocks (of basaltic-andesitic to andesitic composition) and dated by 40Ar/39Ar at 0.06±0.05 Ma (Guilbaud et al., 2012). The lake is 0.3 km in diameter and has a maximum depth of 28 m (Caballero et al., 2016). The crater is characterized by steep walls (28 m) and narrow coastal areas except for its eastern flank (Ortega-Guerrero et al., 2021). The climate is tropical sub‐humid, with a mean annual precipitation (MAP) of 1140 mm concentrated over the summer months from June to October and a mean annual temperature (MAT) of 18°C, with the warmest months from April to June. The lake is mesotrophic to eutrophic (Caballero et al., 2016). The meteorological data available from 1988 to 2011 record a warming trend with negative temperature anomalies before the year 2000 and positive anomalies of approximately 2°C since 2003 (Caballero et al., 2016). The Tacambaro lake was a closed system until the construction of a canal in the early 20th century (Ortega-Guerrero et al., 2021). This lake is commonly used for recreational activities and water extraction for irrigation (Morales et al., 2011). In the Michoacán State, where Tacambaro Lake is located, there is a gradual deterioration of the remaining forests annually due to the combined effect of illegal logging, the extraction of wood for fuel, overgrazing, and frequent forest fires (Gobierno del Estado de Michoacán, 2007). According to INEGI (2004), the predominant soil group in the area is Acrisol. Other soil groups identified are Andosol, Alisol, and Umbrisol (Anaya et al., 2016). The natural vegetation is characterized by tropical deciduous, pine, and oak forests (Rzedowski, 1994).
Lago Verde is located within the Los Tuxtlas volcanic field (Figure 1 a), which comprises more than 276 volcanic structures in a subcircular area of 50 km in diameter. The composition of the Oligocene-Holocene volcanoes varies from tephritic basanite to basalt and rarely to basaltic andesite (Verma et al., 2016). The Lago Verde is located on the northern slope of the San Martin volcano within one of seven phreatic explosion craters (maars) around that volcano. It is found at 100 m a.s.l., its diameter is 400 m, reaching a depth of 4.5 m and the average depth of 1.9 m (Vázquez et al., 2004; Caballero et al., 2006). The prevailing climate in the area is warm (MAT ~ 25°C) and humid (MAP ~ 2500 mm/yr) (Alatorre, 1996; Ruan-Soto, 2004). The recent record of the lake corresponding to the first 300 to 400 years (1 m) of the sequence is defined by the presence of tephra corresponding to the 1664 eruption of the San Martín volcano. Meso-eutrophic conditions were inferred between 1664 and 1963, with the first pulse of disturbance due to human impact around 1921. After 1963, an intense impact associated with deforestation, the presence of crops, and high erosion rates were recorded. The maximum impact on the ecosystem was recorded in 1988. Subsequently, conditions of reduction in deforestation were recorded, with which the lake seemed to reach a new balance, and modern conditions were established (Caballero et al., 2006). Dominant soils in the area are Luvisols, Acrisols, Leptosols and Andosols (Castillo-Campos and Laborde, 2004). The main natural vegetation types are tropical rainforest, tropical evergreen forest, tropical sub-deciduous forest, deciduous forests, tropical pine forests, tropical oak forests, and induced savannas (Alatorre, 1996; Dirzo et al., 1997). The vegetation cover in this basin is grasslands for cattle ranching (Caballero et al., 2006).
3. Materials and Methods
3.1. Field survey
Three soil profiles were analyzed on the slopes of the Tacambaro maar-lake crater: Tacambaro 1 (TAC1), Tacambaro 2 (TAC2), and Tacambaro 3 (TAC3); and one profile within the Lago Verde crater: Lago Verde 1 (LV1). The slopes on the northern and northwestern rims of the Tacambaro Lake are ~40° but become gentler to the west. In the case of Lago Verde, it was decided to show results from a single soil profile, because, through exploratory field sampling, we identified that the LV1 profile was representative of the landscape. In the Lago Verde crater, the inclination of the slope (~15°) is not as pronounced as that in TAC. The profile descriptions were made following the guidelines of the IUSS Working Group WRB (2015).
The TAC1 profile (19°12′44″N, 101°27′31″W, 1494 masl) (Figure 1b) was situated on the northern slope (inside the crater). To dig the soil pit, we climbed to the highest level allowed by the morphology of the slope. TAC2 profile was located 6 m below TAC1 (19°12′41″N, 101°27′25″W, 1488 masl) (Figure 1b), also on the northern slope of the crater. In the case of the TAC 3 profile (19°12′47″N, 101°27′25″W, 1481 masl) (Figure 1b), we sampled a profile at the lake water level and took advantage of the presence of a lateral exposure along a path; this profile is located approximately 5 m below the TAC 2 profile. Although the TAC 3 profile is at the level of the lake surface, it is approximately 50 m from the lake water. It does not show evidence of flooding, possibly due to the presence of a channel that regulates the depth of the lake. LV1 profile (18°36′40″N, 95°20′49″W, 122 masl) (Figure 1c) was situated to the south of the Lago Verde water body, 6 m above the lake water level and approximately 80 m away from the shore.
Bulk samples from genetic horizons were taken for geochemical analyses, and unaltered samples for micromorphological evaluations. The number of samples used in each specific analysis is listed in Table 1.
Table 1 Number of samples used for the different analyzes.
| Analysis | Number of samples | Specifications |
|---|---|---|
| Color measurements | 61 | taken every 10 cm on each profile |
| Grain size distribution | 18 | of all the horizons of the four profiles |
| Carbon Content | 17 | of all the horizons of the four profiles (LV1_AB horizon) |
| Soil micromorphology | 18 | of all the horizons of the four profiles |
| X-ray fluorescence (XRF) | 18 | of all the horizons of the four profiles |
| Bulk mineralogical composition (XRD) | 6 | Horizons: TAC1_BC1, TAC2_BC2, TAC3_2Bwb1, TAC3_3Ctb2, LV1_2Cb1, LV1_3ACb2) |
| Clay identification (XRD) | 3 | Horizons: TAC2_BC2, TAC3_3Ctb1, LV1_2Cb1 |
| Magnetic properties of the soils | 61 | taken every 10 cm on each profile |
| Hysteresis parameters | 15 | from selected horizons |
| 14C dates | 3 | Horizons: TAC1_BC2, TAC2_BC2, LV1_ 2Cb1 |
3.2. Laboratory analyses
3.2.1. Color measurements
The color was evaluated in fine earth samples (< 200 mm) using a ColorLite sph860/sph900 spectrophotometer. The spectrophotometer has a scanning area of 38 mm, a blue and white LED light source, and a 10° viewing angle determining the diffuse reflection spectrum (3.5 nm resolution, spectral range 400-700) converted to CIELAB color space variables and displayed as RGB colors. Spectrophotometers quantify color parameters using the CIELAB color space variables L∗ (luminance, i.e., lightness [0-100]), a∗ (>0: red, < 0: green), and b∗ (>0: yellow, < 0: blue) and derived parameters like the Redness Index (Barrón and Torrent, 1986; Rossel et al., 2006).
3.2.2. Grain size distribution of samples
The grain size distribution was determined in every genetic soil horizon. The sand fraction (2-0.02 mm) was separated by sieving; silt (0.02-0.002 mm) and clay (<0.002 mm) fractions were separated by sedimentation and pipetting following Stokes' law with prior destruction of organic matter by treatment with H2O2 (15%) due to its behavior as an aggregating agent (Gee and Or, 2002).
3.2.3. Carbon Content
Total carbon and inorganic carbon were determined by dry combustion and coulometric detection (Huffman, 1977) using dry (105° C for 72 h) and pulverized samples. Organic carbon (OC) was calculated as the difference between total carbon and inorganic carbon.
3.3. Soil micromorphology
Unaltered soil samples were placed in an oven at 60°C for 48 h to remove moisture. Subsequently, they were impregnated with an MC40 Crystal polyester resin at room temperature and placed in a vacuum for 40 minutes. Soil blocks solidified within 2 weeks and were sectioned and polished to a thickness of 30 µm. All samples were described using an Olympus BX51 petrographic microscope. The micromorphological description of soils was carried out following the guidelines of Stoops (2021). Photomicrographs were documented using Image ProPlus® v.7 software from Media Cybernetics.
3.4. Bulk chemical composition and weathering indices
For geochemical X-ray fluorescence analysis (XRF), samples were dried, homogenized within an agate mortar, and measured using a Rigaku Primus II equipped with an Rh-anode and a 30 µm Be window. Verification of the analysis was done using the IGLa-1 standard. Details of the preparation procedure are available in the RMCG (Lozano and Bernal, 2005).
The determined weathering indices include Si/Al (Ruxton ratio (1986)), which indicates the loss rate of silica (SiO2) with the loss of a resistant elemental oxide, namely, Al2O3 in the weathering process, and the Desilication Index (DI= SiO2/(Fe2O3 + Al2O3 + TiO2)), which is the molar ratio of movable Si to immobile oxides (Fe, Al, and Ti). The lower the DI value, the higher weathering degree. To calculate the Chemical Index of Alteration (CIA) we used the following equation: CIA=(Al2O3/(Al2O3+CaO+Na2O+K2O ×100. The CIA is used to evaluate the degree of weathering in samples, and its values can range between 50 and 100 (Nesbitt and Young, 1982; Fedo et al., 1995; Voicu and Bardoux, 2002).
3.5. Bulk and clay mineralogy
The bulk mineralogical composition was determined using 1g soil samples previously ground and sieved through a 100 mesh. The clay fraction (<0.002 mm) was separated from a stabilized aqueous suspension according to Stoke’s Law. In both cases (bulk and clay mineralogy) the analyses were performed by X-Ray Diffraction using an EMPYREAN diffractometer, operating with an accelerating voltage of 45kV and a filament current of 40mA, equipped with a nickel filter, CuKα radiation, and a PIXcel3D detector. The XRD analyses were done a) in air-dried oriented samples obtained by pipetting suspension drops onto a glass slide, which was then dried at 30°C for a few hours; b) after saturation with ethylene glycol vapor at 70°C, for a minimum of 12 hours; and c) after heating at 550°C. The XRD of air-dried samples was measured over a 2θ angle range of 2-70°, while the glycolate and heated slides were evaluated over a 2θ angle range of 2-30° with a step size of 0.04° (2θ) and 40 s of scan step time. Identification and semi-quantification were performed using the HIGHSCORE v4.5 software and the databases of ICSD (Inorganic Crystal Structure Database) and ICDD (International Center for Diffraction Data).
3.6. Measurements of the magnetic properties of the soils
Samples for the magnetic properties analysis were air-dried and lightly homogenized to fill acrylic cubes of 8 cm3 volume. Magnetic susceptibility was measured at low (976 Hz) and high (15916 Hz) frequencies on an MFK1-FA susceptometer (AGICO). Anhysteretic remanent magnetization (ARM) and isothermal remanent magnetization (IRM) were measured using a JR6 spinning magnetometer. ARM was imparted in a maximum alternating field (AF) of 100 mT in a direct current bias field of 50 μT. IRM was imparted in an ASC pulse magnetizer at direct fields of 100, 200, 300 and 1000 T, and backfields of 100, 200 and 300 mT. The ARM/SIRM ratio was used to estimate the concentration of SD grains contribution (Geiss, 1999) and the frequency-dependent susceptibility χfd (%) in order to estimate the concentration of ultrafine grained (<30 nm in magnetite) superparamagnetic (SP) particles (Dearing et al., 1996, Jordanova et al., 1997, Maher, 1998). The IRM parameter was used to estimate the concentration of high-coercivity minerals or very fine-grained ferrimagnetic grains (such as hematite or goethite) (Geiss et al., 2004, Rivas et al., 2006). HIRM was measured in backfields of 300 mT (HIRM = IRM1000 mT + IRM-300 mT/2). The S300 ratio was calculated as S300 = IRM300 mT/SIRM) (Evans and Heller, 2003, Ortega et al., 2006, Rivas et al., 2012). S300 ratios are used to interpret the presence of high coercivity minerals; when S300 ratios are <80%, it generally indicates the presence of hematite or goethite (Opdyke and Chanell, 1996).
Hysteresis parameters were measured using a Princeton Measurements Corporation Micromag Alternating Gradient Magnetometer (AGM) at room temperature in fields up to 1 T. A total of 15 samples (the A horizons of the profiles were not included) were selected and 100-step backfield remanence curves were measured using the Micromag. Magnetization (MS and Mr) and coercivity parameters (Hcr and Hc) were obtained from hysteresis loops. The ratios of Hcr/Hc and Mrs/Ms (indicative of the mean magnetic grain size of the samples) were plotted on a modified Day-Dunlop plot (Day et al., 1977; Dunlop, 2002). To identify the individual components contributing to remanence, we used a curve-fitting program developed in the R programming language MAX UnMix (http://www.irm.umn.edu/maxunmix). The method uses skew-normal distributions that can be described with a mean coercivity (Bh), a dispersion parameter (DP, equivalent to one standard deviation in log-space), and a skewness factor (S) (Maxbauer et al., 2016b).
4. Results
4.1. Morphological description of the studied profiles
4.1.1. Tacambaro Lake Profiles (TAC1, TAC2 and TAC3)
Tacambaro 1 (TAC1) profile is composed of the following horizons: Ah-AB-BC1-BC2 (Figure 2a). The upper horizons are dark brown and more than 1 m-thick (Figure 2a). They show a loamy texture and a granular structure that becomes subangular blocky in the AB horizons. Here, we detected medium-sized reddish igneous rock fragments (between 2 and 3 cm in diameter). Changes in compaction and structure were noted in the BC1 horizon (50 cm thick), which is light reddish brown, more compact, and less porous than the AB horizon. The BC2 horizon is darker than BC1. Both horizons show a medium-sized subangular blocky structure and a silty-clay texture. In the lowermost part of the profile, there is an increase in the abundance and size of rock fragments, which are between 4 and 5 cm in diameter.
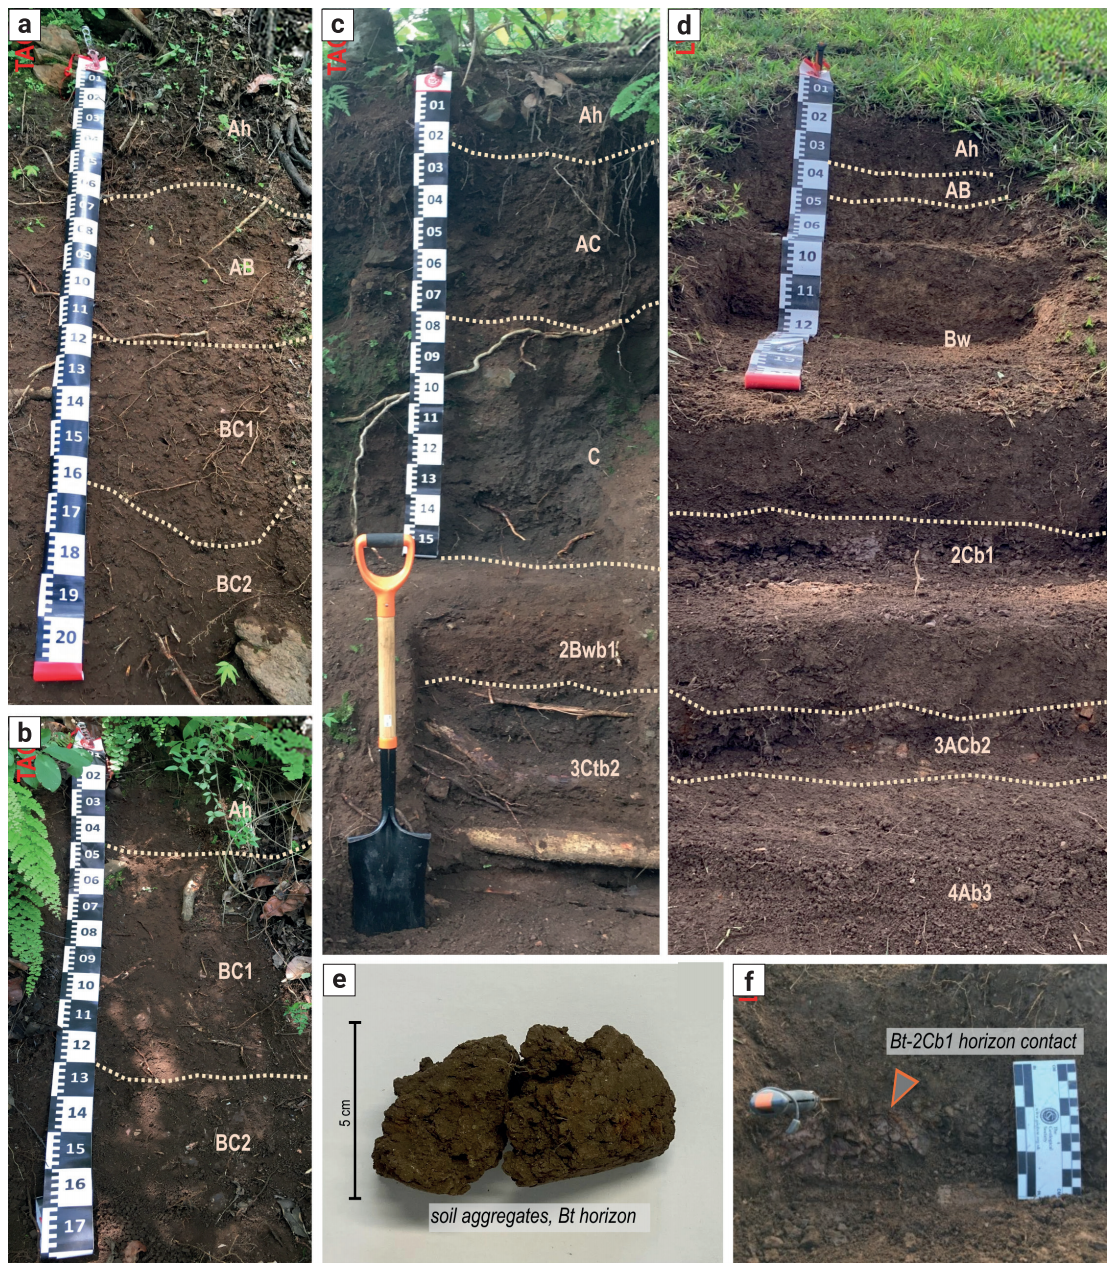
Figure 2 Studied profiles, a) TAC1 soil profile showing four different horizons A-AB-BC1-BC2; b) TAC2 profile showing three different horizons A-BC1-BC2; c) TAC3 polycyclic profile, showing the different horizons; the modern soil 150 cm depth (Ah, AB, C horizons) and two paleosols horizons (2Bwb1, 3Ctb2); d) LV1 polycyclic profile showing four cycles of pedogenesis, the modern soil with the A-AB-Bt horizons, 2Cb1 horizon from another cycle and 3ACb2 and 4Ab3 horizons at the bottom of the profile; e) morphology of the soil aggregates of the horizon Bt el in LV1 profile; f) contact of the Bt-2Cb1 horizons in the LV1 profile.
Tacambaro 2 (TAC2) is a profile located 6 m below the position of the TAC 1 profile and around 3 m above the lake's surface. Here the vegetation is denser than that over the TAC1 profile. TAC2 consists of Ah-BC1-BC2 horizons with a total thickness of 170 cm (Figure 2b). The Ah horizon (40-cm-thick) is dark reddish brown, silty loamy, and has a granular structure, but small subangular blocks are also present. Small red and white rock fragments were observed. The BC1 and BC2 horizons are reddish brown with a silt clayey texture and a subangular blocky structure. The blocks are larger in the BC2 horizon, which is relatively more compact. Rounded fragments of red rocks were observed.
Tacambaro 3 (TAC3) is a polygenetic profile being approximately 200 cm thick and consisting of Ah-AC-C-2Bwb1-3Ctb2 horizons (Figure 2Cb1). Its Ah horizon (only 13 cm thick) is much thinner than those in profiles TAC1 and TAC2, while the brown AC horizon is more than 70 cm thick. Both Ah and AC horizons are dark brown, with a granular structure and a clayey-sandy texture. Fine roots and gravel are abundant in the AC horizon. The C horizon is dark gray, 60 cm thick, poorly structured, and sandy. The lower red-brownish 2Bwb1 horizon is clayey-sandy, with a subangular blocky structure. The presence of gravel was observed. The 3Ctb2 horizon is gray, sandy, and structureless. Here, abundant red saprolized rocks were observed.
4.1.2. Lago Verde Profile (LV1)
The LV1 profile is polygenetic, 140 cm thick, and consists of the following horizons: Ah-AB-Bt-2Cb1-3ACb2-4Ab3 (Figure 2d). The dark brown Ah and AB horizons have a granular and granular blocky structure with a silty-sandy texture and a high abundance of fine roots. The dark reddish-brown Bt horizon is 25 cm thick, silty, with a compact subangular blocky structure (Figure 2e). Some rock fragments are visible. The contact between Bt and 2Cb1 horizons is abrupt and smooth (Figure 2f). The 2Cb1 horizon presents a parallel lamination and, in some areas, has a reddish coloration due to the possible presence of Fe oxides. The 3ACb2 horizon is dark reddish brown, also laminated, and has a loamy-clayey texture. The lowermost 4Ab3 horizon is dark brown, with a loamy texture and small subangular blocks that break up into a granular structure.
4.2. Physical and chemical soil properties
The color variations in the studied profiles can be seen in Figure 3. The luminosity, represented by the L* parameter, is relatively higher in the TAC3 profile, reaching up to 64 in the BC horizon. Darker colors are observed in the Ah horizons. The highest a* values (reddish colors) correspond to the BC, Bw, and Bt horizons in all profiles. The values of b* (yellowish colors) are similar in all the horizons of the TAC1 and TAC2 profiles. Relatively higher b* values were found in the 2Bwb1 horizon of the TAC3 profile and the Bt and 2Cb1 horizons of the LV1 profile.
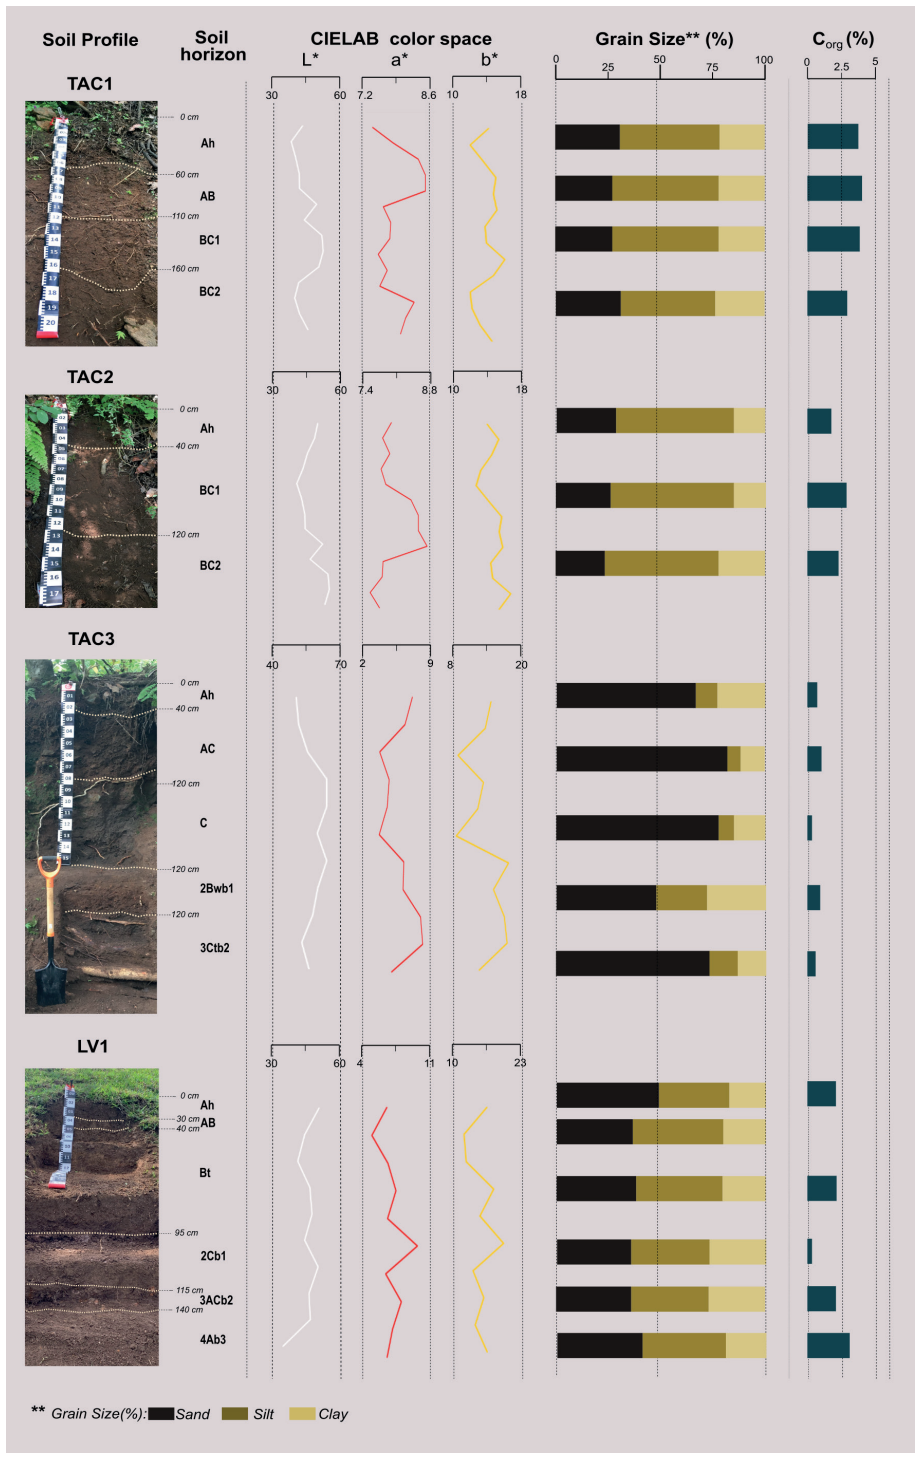
Figure 3 Summary of selected physical and chemical properties: color, grain size, and organic carbon content of the studied soils and paleosols.
Concerning grain size distribution (Figure 3), the silt fraction predominates in the TAC1 and TAC2 profiles, where the clay content slightly increases in the BC horizons. The TAC3 profile shows a different pattern, with a considerably higher content of sand. However, a higher proportion of clay (26%) was also detected in the 2Bwb1 horizon. In the LV1 profile, the percentages of sand and silt are similar in all the horizons. The clay content ranges from 16.27 to 26.40%, with a higher proportion in the 2Cb1 and 3ACb2 horizons. The TAC1 and TAC2 profiles have high organic carbon contents (around 4%), while the TAC3 profile has a much lower carbon content. The 2Bwb1 horizon has higher organic carbon content (1.10%) than the upper Ah horizon (0.81%) (Figure 3). In the LV1 profile, the A and AB horizons contain 2.08% and 2.85% OC, respectively.
4.3. Soil Micromorphology
The A and AB horizons of the Tacambaro soils have a dark groundmass with aggregates showing a granular structure and small subangular blocks (Figure 4 a). Bioturbation is strong, being evidenced by a high amount of fresh plant and root fragments and channels filled with coprolites (Figure 4b). Charcoal is also present in these horizons. Rounded and weathered minerals and rock fragments were observed in the groundmass (Figure 4c), especially in the TAC3 profile, increasing in the sand fraction. The BC horizons were characterized by a subangular to angular blocky structure and a medium porosity in the form of fissures and cavities (Figure 4d, e). Charcoal fragments (Figure 4e) and orthic Fe nodules and Mn stains were observed (Figure 4f, g). Rock fragments in the BC horizons show alteration coating on their surface (Figure 4h). In the lowermost horizons, there is an increase in the content of volcanic rock fragments. Rock fragments were also observed in the C horizon of the TAC3 profile (Figure 4i). The buried 2Bwb1 horizon is reddish brown with a subangular block structure (Figure 4j). Thin clay coatings on some aggregates and along the pores (Figure 4j, k) as well as orthic Fe nodules were observed in this horizon (Figure 4k). Thicker clay coatings were observed in the 3Ctb2 horizon (Figure 4 l).
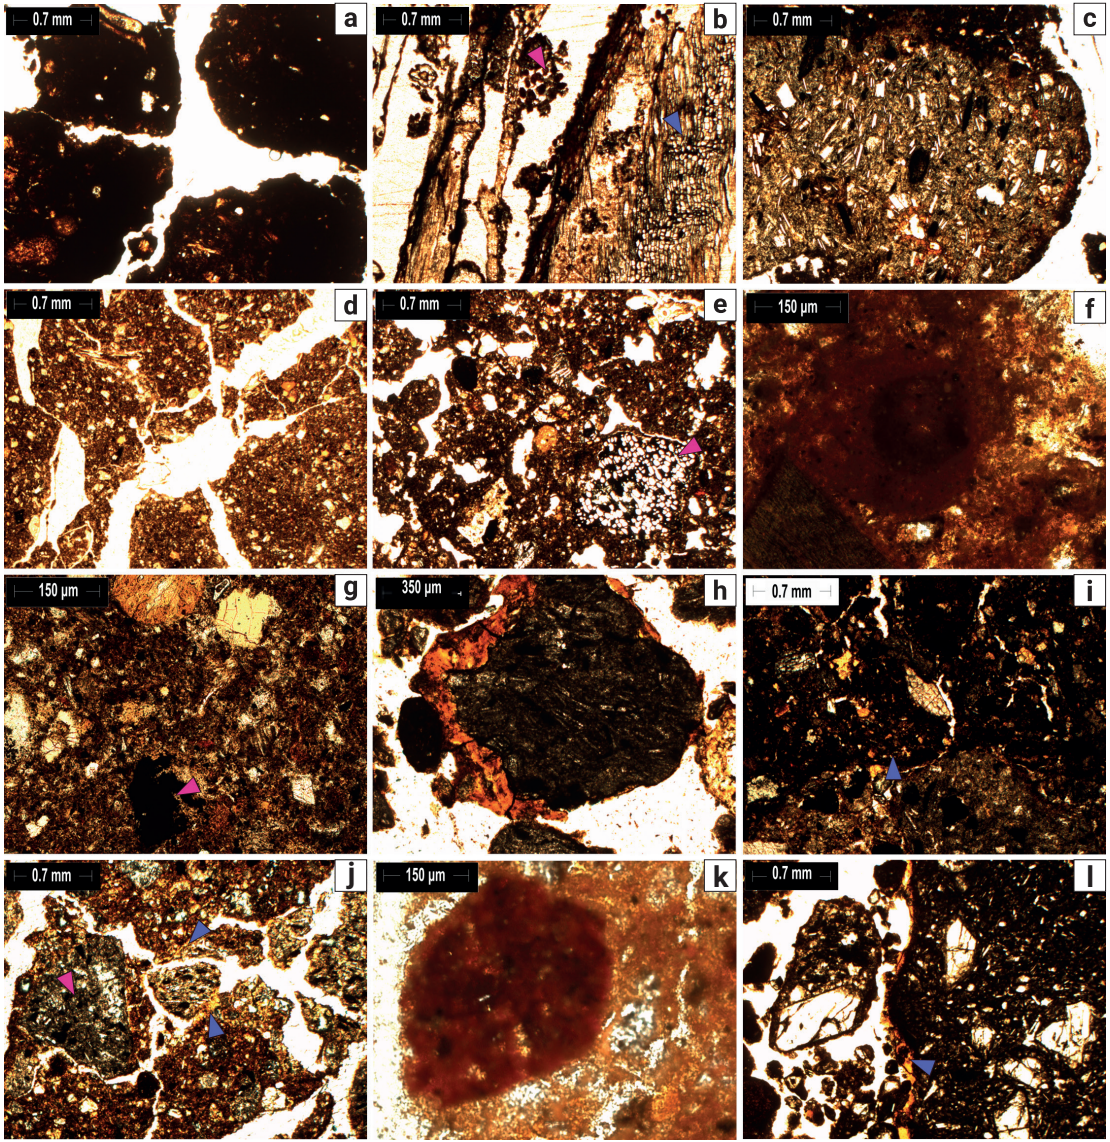
Figure 4 Tacambaro Lake soil horizons photomicrographs, a) TAC1_A horizon, small subangular blocks structure; b) fresh plant tissue (blue arrow) and coprolites (pink arrow) in the TAC1_A horizon; c) rock fragments in the TAC1_AB horizon showing a dark weathering patina; d) TAC2_BC1 horizon angular blocky structure; e) TAC1_BC1 horizon fissures and cavities porosity and charcoal fragments (pink arrow); f) Fe orthic nodule in the TAC1_BC2 horizon; g) Mn oxide stains in the TAC2_BC1 horizon (pink arrow), and fragments of a reworked soil material included in the groundmass (blue arrows); h) Clay and Fe coatings on a rock fragment in TAC1_BC2 horizon; i) TAC3_C horizon groundmass (blue arrow) with rocks fragments and minerals; j) TAC3_2Bwb1 horizon subangular blocky structure, rocks fragments (pink arrow) and thin clay coatings on soil aggregates (blue arrows); k) Fe nodules in the TAC3_2Bwb1 horizon; l) clay coating on rock fragments in the TAC3_3Ctb2 horizon.
4.3.1. Lago Verde soil profile (LV1) micromorphology
The A horizon of the LV profile shows a structure of small subangular blocks and composite packing pores (Figure 5a). Some plant fragments are unaltered (Figure 5b). Weathered mineral fragments are also present within the aggregates (Figure 5a, c). In the Bt horizon, in contrast to the surface horizons, the color of soil aggregates is brown. The porosity is in a form of channels filled with illuvial clay (Figure 5d). Some nodules and coatings of Fe and Mn oxides were also observed in this Bt horizon (Figure 5e). The 2Cb1 horizon, being beneath the Bt horizon, has groundmass of a coarser texture shaped into angular aggregates separated by planar voids (Figure 5f, blue arrow). The 3ACb2 horizon’s groundmass is darker and more compact; there is also incorporated and reworked material in the form of tabular fragments of a dark red soil (Figure 5g). Clean illuviated clay coatings with a higher birefringence fill some pores (Figure 5 h). The LV1 4Ab3 horizon, found in the lowermost part of the profile, is dark brown with a granular structure and a high porosity. Even at this depth, plant tissue fragments can be seen (Figure 5i).
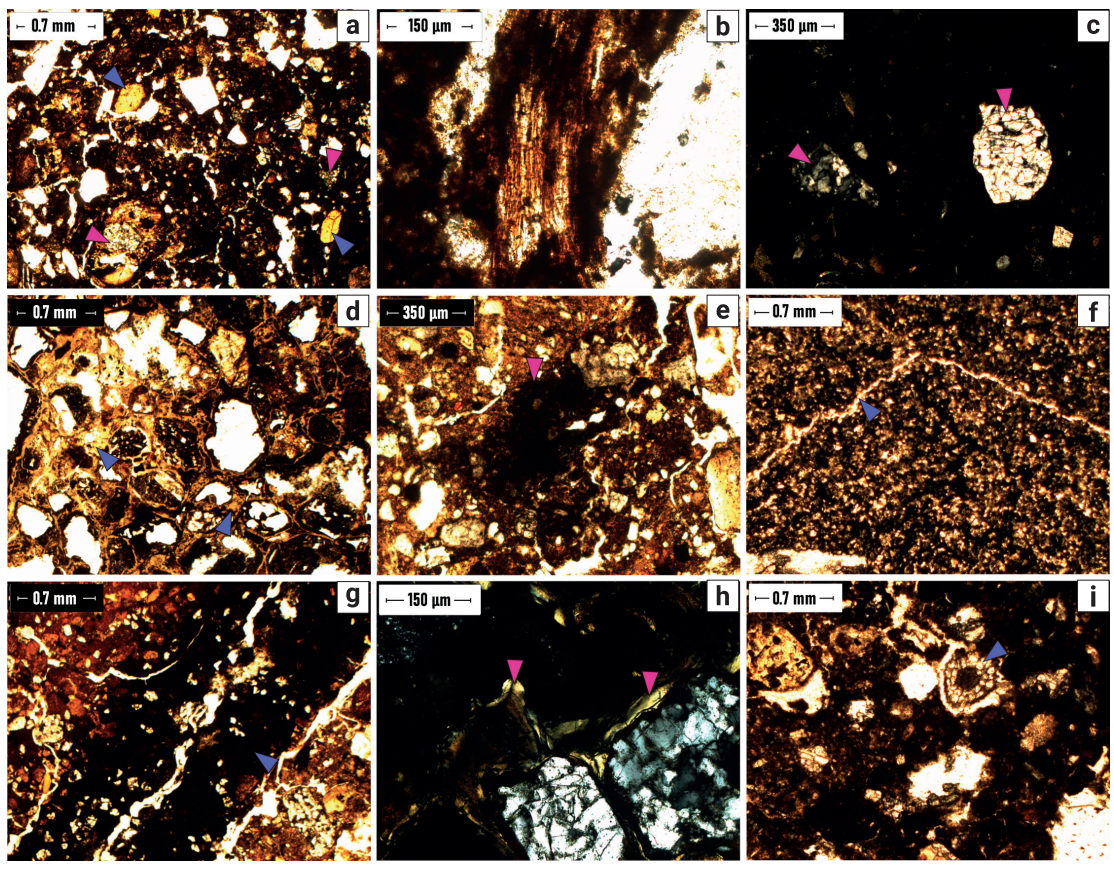
Figure 5 Lago Verde 1 (LV1) soil horizons photomicrographs, a) A horizon granular structure and interconnected vughs porosity; mineral fragments (blue arrows) and rounded yellow soil material incorporated into the groundmass (pink arrows) are also observed; b) plant fragment tissue in the A horizon; c) weathered minerals in the AB horizon; d) heterogeneous material in the Bt horizon: soil fragments with a yellowish clayey groundmass, with soil fragments with a reddish groundmass; e) Mn oxides stain at the Bt horizon; f) 2C horizon, fine grain groundmass separated by planar fissures; g) large tabular fragments of dark brown soil placed in the groundmass of the 3ACb2 horizon (blue arrows); h) laminated clay coatings in some pores of the 3ACb2 horizon (XPL), i) 4Ab3 horizon granular structure and root cortex (blue arrow).
4.4. Bulk geochemistry and weathering indices
The proportions of major oxides (wt%) are shown in Table 2. The amount of SiO2 is indicative of an intermediate to basic composition. The Fe2O3 content is higher in the LV1 profile as compared to that in the Tacambaro soils; the maximum percentage (16.48 %) is found in the LV1_Bt horizon. The CaO content has low values (consistently below 1.5%) in all the horizons of the TAC1 and TAC2 profiles, in contrast to the higher values obtained in the TAC3 profile, which reach 5.9% in the TAC3_C horizon. The Ruxton ratio (Rr), which characterizes the rate of loss of silica (SiO2) in comparison with the loss rate of resistant elemental oxide (Al2O3), has values ranging between 1.88 (LV1_Bt) and 3.28 (TAC3_C). DI (Desilication Index) is the molar ratio of movable Si to immobile oxides (Fe, Al, and Ti); and its values range between 1.03 and 2.30, with the lowest values found in the LV1 profile. The CIA values are relatively high in all the horizons of LV1 profile, reaching 94.71 % in LV1_Bt. The lowest CIA value (61.64%) was recorded in the TAC3_C horizon.
Table 2 Major oxide (in wt %) abundances in the TAC1, TAC2, TAC3, and LV1 soil profiles.
| Sample ID | Horizon | SiO2 | TiO2 | Al2O3 | Fe2O3 | MnO | MgO | CaO | Na2O | K2O | P2O5 | LOI 1 | Suma | Si/Al 2 | DI 3 | CIA 4 |
|---|---|---|---|---|---|---|---|---|---|---|---|---|---|---|---|---|
| TAC1_A | A | 48.41 | 1.09 | 18.92 | 9.16 | 0.14 | 1.35 | 1.81 | 1.37 | 0.95 | 0.17 | 16.65 | 99.99 | 2.56 | 1.66 | 82.08 |
| TAC1_AB | AB | 49.43 | 1.15 | 19.48 | 9.63 | 0.15 | 1.15 | 1.62 | 1.27 | 0.95 | 0.15 | 15.03 | 99.99 | 2.54 | 1.63 | 83.55 |
| TAC1_BC1 | BC1 | 50.18 | 1.15 | 20.35 | 9.82 | 0.15 | 1.30 | 1.49 | 1.41 | 1.03 | 0.16 | 12.98 | 100 | 2.47 | 1.60 | 83.84 |
| TAC1_BC2 | BC2 | 49.68 | 1.14 | 19.91 | 9.57 | 0.14 | 1.15 | 1.57 | 1.29 | 0.94 | 0.15 | 14.46 | 99.99 | 2.50 | 1.62 | 83.99 |
| TAC2_A | A | 50.81 | 1.13 | 18.81 | 9.26 | 0.15 | 0.96 | 1.59 | 1.25 | 0.90 | 0.14 | 15.00 | 100 | 2.70 | 1.74 | 83.41 |
| TAC2_BC1 | BC1 | 51.96 | 1.14 | 19.75 | 8.99 | 0.15 | 1.51 | 1.71 | 1.56 | 0.99 | 0.12 | 12.12 | 100 | 2.63 | 1.74 | 82.23 |
| TAC2_BC2 | BC2 | 51.83 | 1.15 | 19.29 | 9.29 | 0.15 | 1.93 | 1.77 | 1.44 | 0.99 | 0.13 | 12.04 | 100 | 2.69 | 1.74 | 82.14 |
| TAC3_A | A | 49.31 | 0.94 | 22.92 | 8.49 | 0.11 | 2.33 | 2.48 | 2.12 | 0.84 | 0.13 | 10.32 | 100 | 2.15 | 1.52 | 80.83 |
| TAC3_AC | AC | 55.04 | 0.79 | 19.32 | 6.94 | 0.11 | 4.24 | 5.69 | 3.36 | 1.09 | 0.17 | 3.26 | 100 | 2.85 | 2.04 | 65.56 |
| TAC3_C | C | 56.91 | 0.73 | 17.33 | 6.66 | 0.10 | 5.08 | 5.88 | 3.60 | 1.31 | 0.18 | 2.22 | 100 | 3.28 | 2.30 | 61.64 |
| TAC3_2Bwb1 | 2Bw | 50.78 | 0.92 | 22.27 | 8.42 | 0.11 | 2.87 | 3.19 | 2.18 | 0.84 | 0.14 | 8.29 | 100 | 2.28 | 1.61 | 78.22 |
| TAC3_3Ctb2 | 3Ct | 54.00 | 0.77 | 18.41 | 7.37 | 0.11 | 5.62 | 5.28 | 3.04 | 1.10 | 0.17 | 4.14 | 100 | 2.93 | 2.03 | 66.15 |
| LV1_A | A | 46.52 | 2.05 | 17.45 | 14.28 | 0.13 | 2.98 | 2.27 | 0.49 | 0.38 | 0.28 | 13.17 | 100 | 2.67 | 1.38 | 84.75 |
| LV1_AB | AB | 50.58 | 1.90 | 15.95 | 13.27 | 0.11 | 3.61 | 2.15 | 0.43 | 0.38 | 0.25 | 11.37 | 99.99 | 3.17 | 1.63 | 84.39 |
| LV1_Bt | Bw | 42.21 | 2.10 | 22.47 | 16.48 | 0.09 | 1.40 | 0.86 | 0.16 | 0.24 | 0.22 | 13.78 | 99.99 | 1.88 | 1.03 | 94.71 |
| LV1_2Cb1 | 2C | 47.79 | 1.64 | 17.75 | 14.93 | 0.17 | 3.15 | 1.89 | 0.48 | 0.31 | 0.30 | 11.60 | 100 | 2.69 | 1.39 | 86.90 |
| LV1_3ACb2 | 3AC | 43.22 | 1.79 | 18.89 | 15.05 | 0.19 | 3.50 | 2.63 | 0.61 | 0.34 | 0.37 | 13.42 | 100 | 2.29 | 1.21 | 84.05 |
| LV1_4Ab3 | 4A | 43.41 | 1.94 | 17.93 | 15.80 | 0.15 | 3.19 | 2.49 | 0.54 | 0.37 | 0.33 | 13.86 | 100 | 2.42 | 1.22 | 84.07 |
1LOI: Loss of Ignition.
2Si/Al: Ruxton ratio (1986) calculated the loss rate of Silica (SiO2) with the loss of resistant elemental oxide, namely Al2O3 in the weathering process.
3 DI: DI= SiO2/(Fe2O3 + Al2O3 + TiO2). Desilication index is the molar ratio of movable Si to immobile oxides (Fe, Al, and Ti). The lower the DI value, the higher weathering degree.
4CIA =(Al2O3/(Al2O3+CaO+Na2O+K2O) × 10.
4.5. Bulk and clay mineralogy
The mineral phases identified in the bulk samples from selected horizons (TAC1_ BC1, TAC2_BC2, TAC3_2Bwb1, TAC3_3Ctb2, LV1_3ACb2, and LV1_2Cb1) are generally similar and include intermediate plagioclases, quartz, tridymite, potassium feldspar and phyllosilicates (Table 3). Regarding plagioclases, it is worth mentioning that in the soils of Tacambaro, their content is approximately 18%, except for the 3Ctb2 horizon of TAC3, where the plagioclase content reaches 59%. In the case of the Lago Verde profile, it reaches 63% in the Bt horizon. Fe oxides were found in the horizons of the TAC1 and TAC3 profiles, however, some differences between them were detected. Magnetite was quantified (7%) in the TAC1_ BC1 horizon,), while hematite was identified (6%) in the TAC3_2Bwb1 horizon.
Table 3 Samples mineralogy: phases identified and semi-quantified in bulk samples, and clay phases.
| Sample | Identified Phases (bulk sample) | SemiQuant (%) |
|---|---|---|
| TAC1_ BC1 | − Quartz: SiO2 − Intermediate plagioclase: (Na,Ca)(Si,Al)3O8 Augite/diopside type pyroxene: (Ca,Mg,Fe)2 Si,Al)2O6 − Magnetite: Fe3O4 − Phyllosilicates at ~14Å (smectite (?)) − Phyllosilicates at ~10Å (illite (?)) − Phyllosilicates at ~7Å (kaolinite (?)) |
− 17 − 15 − 7 − 8 − 7 − 12 − 20 − 15 |
| TAC2_BC2 | − Intermediate plagioclase: (Na,Ca)(Si,Al)3O8 − Phyllosilicates at ~14Å (smectite (?)) |
− 19 − 81 |
| TAC3_2Bwb1 | − Intermediate plagioclase:(Na,Ca)(Si,Al)3O8 − Quartz: SiO2 − Tridymite: SiO2 − Hematite: Fe2O3 − Phyllosilicates at ~7Å (kaolinite (?)) |
− 20 − 6 − 11 − 6 − 57 |
| TAC3_3Ctb2 | − Intermediate plagioclase:(Na,Ca)(Si,Al)3O8 − Potassium feldspar:(K,Na)(Si,Al)4O8 − Tridymite: SiO2 − Phyllosilicates at ~7Å (kaolinite (?) |
− 59 − 17 − 8 − 16 |
| LV1_2Cb1 | − Intermediate plagioclase:(Na,Ca)(Si,Al)3O8 − Quartz: SiO2 − Tridymite: SiO2 − Phyllosilicates at ~10Å (illite (?) − Phyllosilicates at ~7Å (kaolinite (?) − Possible traces of smectite |
− 60 − 8 − 5 − 16 − 12 |
| LV1_3ACb2 | − Intermediate plagioclase:(Na,Ca)(Si,Al)3O8 − Quartz: SiO2 − Augite-type pyroxene: (Ca,Mg,Fe)2(Si,Al)2O6 − Olivine ferric forsterite type: − Hornblende type amphibole: Ca2(Mg,Fe,Al)5(Al,Si)8O22OH Phyllosilicates at ~7Å (kaolinite (?)) |
− 63 − 5 − 11 − 7 − 7 − 7 |
| Sample | Clay Peaks | Identified Phases |
| TAC2_ BC2 | − Untreated peaks: ~7.37Å − Peaks with ethylene glycol: ~7.37Å − Peaks at 550°C: - |
− Kaolinite |
| TAC3_3Ctb2 | − Untreated peaks: ~7.25Å − Peaks with ethylene glycol: ~7.41Å − Peaks at 550°C: - |
− Kaolinite |
| LV1_ 2Cb1 | − Untreated peaks: ~13.53 Å ~7.31Å Peaks with ethylene glycol: ~16.88 Å ~8.1Å ~7.2Å Peaks at 550°C: ~10.10Å | − Smectite − Smectite − Kaolinite |
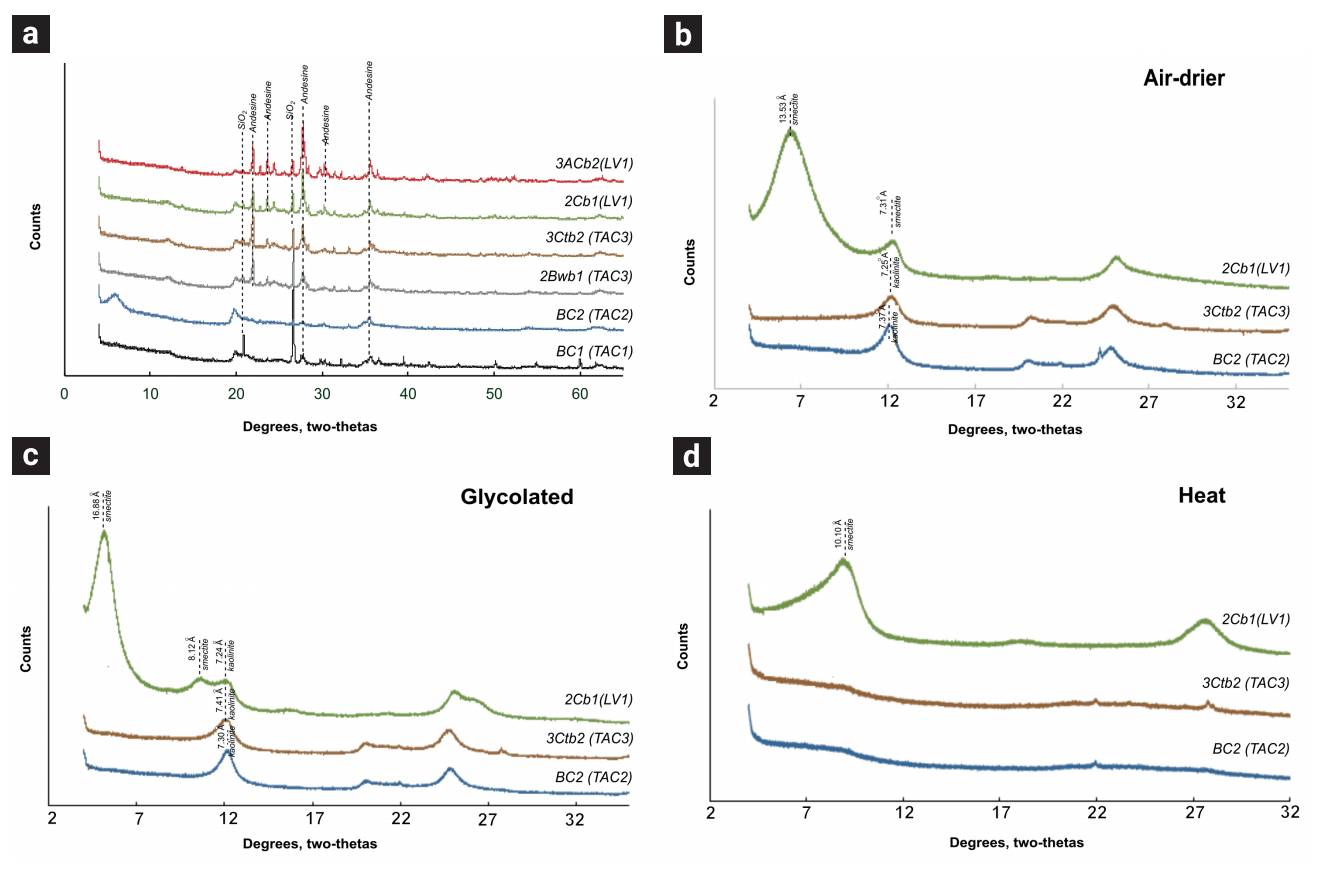
The presence of kaolinite and smectite in TAC and LV1, respectively, is another interesting property detected in diffractograms of the oriented samples (Table 3, Figure 6). Kaolinite was observed in the BC2 horizon of TAC2 and in the 3Ctb2 horizon of TAC3. In both cases, the kaolinite peak appears at 7.37Å in the untreated samples, moves to ~7.30Å in the glycolated samples and collapses in the samples heated to 550°C. In the case of the 2Cb1 horizon of LV1, the smectite was identified in the untreated oriented sample at the peaks of 13.53 Å and 7.31Å (Table 2, Figure 6), which moved to ~16.88 Å ~8.1Å after glycolatation.
4.6. Rock magnetism
4.6.1. Magnetic concentration
The bulk χ oscillates between 6 × 10⁻⁶ and 9 × 10⁻⁶ m3kg-1 in both TAC1 and TAC2 profiles. A significant decrease in the bulk χ (varying between 3 × 10⁻⁶ and 5 × 10⁻⁶ m3kg-1) was observed in the TAC3 profile in comparison with its values in TAC1 and TAC2 that were situated at greater elevations in the landscape. Even higher bulk χ values (between 7 × 10⁻⁶ and 10 × 10-6 m3kg-1) were detected in the LV1 profile (Figure 7). The saturation isothermal remanent magnetization (SIRM) is between 0.11 and 0.14 Am2/kg in the BC horizons of the TAC1 and TAC2 profiles and up to 0.14 Am2/kg in the C horizons of TAC3. The SIRM values are generally lower in the LV1 profile, i.e., reaching only 0.07 Am2/kg in the upper horizons and up to approximately 0.13 Am2/kg in the 3ACb2 horizon. The HIRM300 values indicate that we have minerals with greater coercivity in the TAC3_C horizon (233.25 A/m) as well as the LV1_2Cb1 and LV1_3ACb2 horizons (reaching 221 A/m). The S300 ratio is between 0.90 and 0.95 in the profiles of the Tacambaro Lake and a little closer to 1 in the case of LV1. Such values indicate a mineralogy dominated by soft minerals.
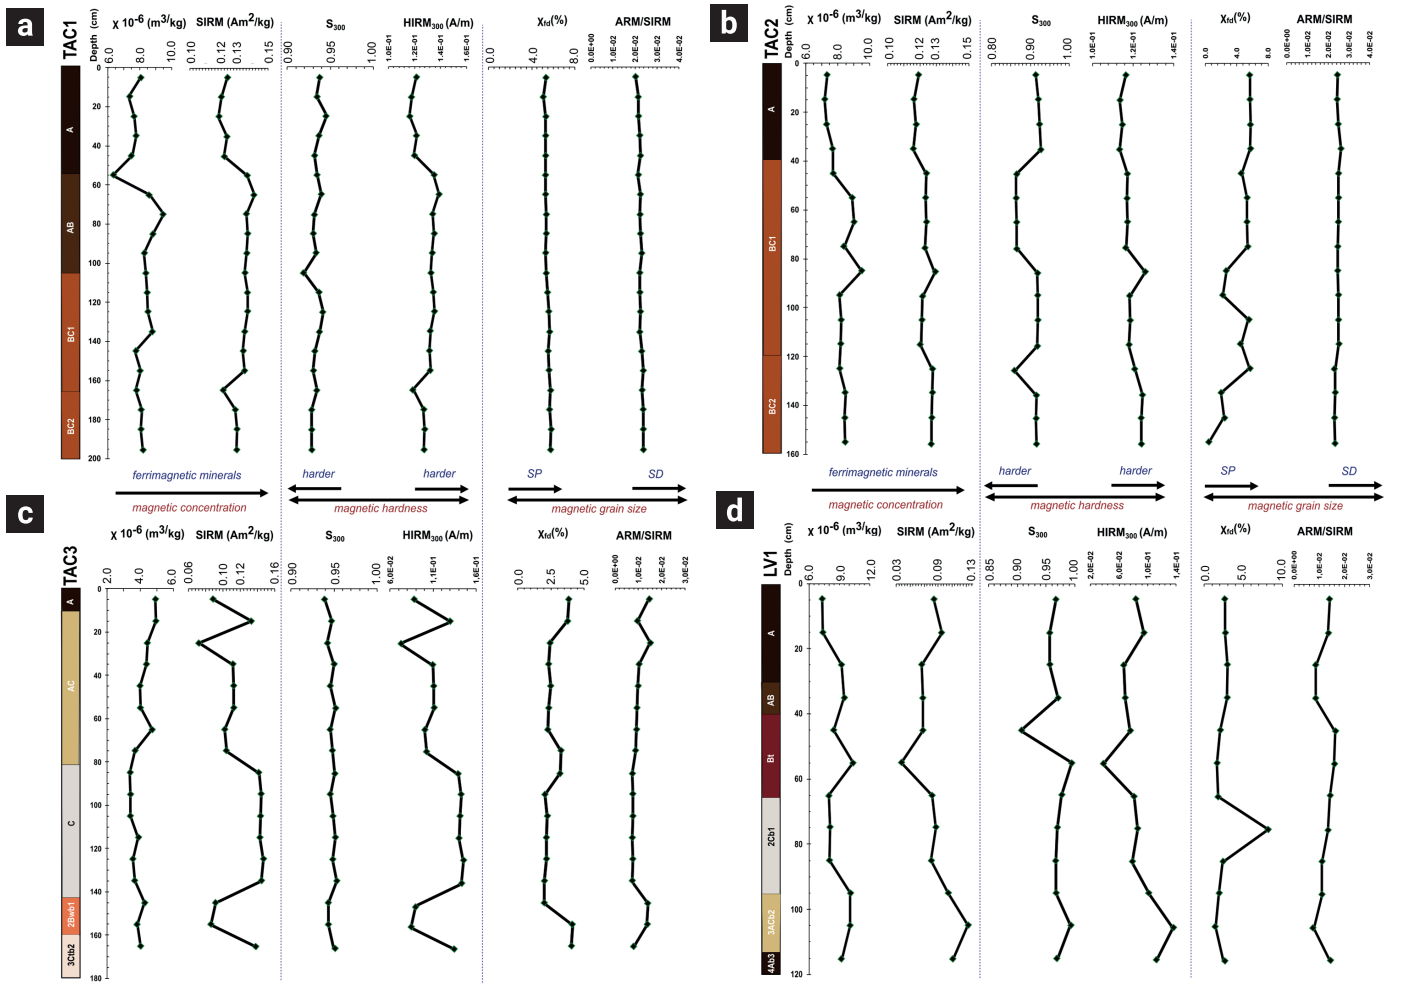
Figure 7 Selected magnetic parameters were measured in the TAC1, TAC2, TAC3, and LV1 soil profiles. Ordered as follows: magnetic susceptibility (χ) and SIRM as indicators of the concentration of magnetic minerals; S300 ratios as indicators of coercivity; HIRM300 as an indicator of high coercivity mineral concentration; χfd and ARM/SIRM as indicators of magnetic grain size.
4.6.2. Magnetic grain size
In the case of the TAC1 profile, the χfd% values vary between 5 and 5.5%, indicating the presence of a mixture of fine superparamagnetic (SP) grains and coarser grains. The values of less than 2% in the TAC2_BC2 horizon indicate the content of less than 10% of SP grains. The TAC3 horizons were characterized by values between 2 and 4%, also indicating a mixture of grain sizes. In the LV1 profile, we observed a punctual increase of 8% at the transition between the Bt and 2Cb1 horizons, indicating an increase in the content of SP grains in LV1_2Cb1. In the other horizons of LV1, the values vary between 1.5 and 2.9% (Figure 7).
The ARM/SIRM ratio indicates the abundance of single-domain (SD) minerals (Figure 7). In the case of TAC1 and TAC2, it practically does not change with depth, having an average value of 0.02. In TAC3, this ratio is 0.01. In the LV1 profile, values of this ratio in both Bt and 2Cb1 horizons are lower than those in the A horizons.
Hysteresis parameters in the Day diagram (Day et al., 1977) (Figure 8) allow for estimating the size of magnetic domains in a material. Dunlop (2002) suggests some specific trends in SP, SD, and MD grains in soil samples. In our case, the data plot closer to the MD curve.
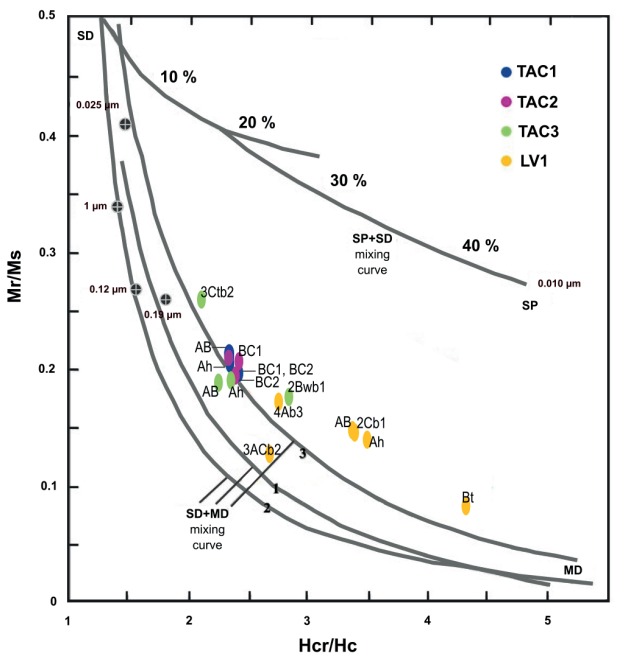
Figure 8 Day plot of Mr/Ms versus Hcr/Hc (Day et al., 1977), modified by Dunlop (2002). Samples tend to be multi-domain (MD) grain size.
4.6.3. Coercivity unmixing
The analysis of the coercivity distribution in the B and C horizons of the profiles shows that the remanent magnetization is held by three components (Figure 9a). For the Tacambaro Lake profiles, the low coercivity component C1 is characterized by having Bh values between 0.8 and 1.8 (6-62 mT) and DP of approximately 0.3. The other low coercivity component C2 has Bh values ranging from 0.7 to 1.5 (4-35 mT) and DP of roughly 0.3. In the case of the LV1 profile, the Bh of C1 varies between 1.5 and 1.6 (32-40 mT) and DP between 0.3 and 0.4; for C2, the Bh varies between 0.6 and 0.8 (4-6 mT) and the DP between 0.3 and 0.4 (Figure 9b).
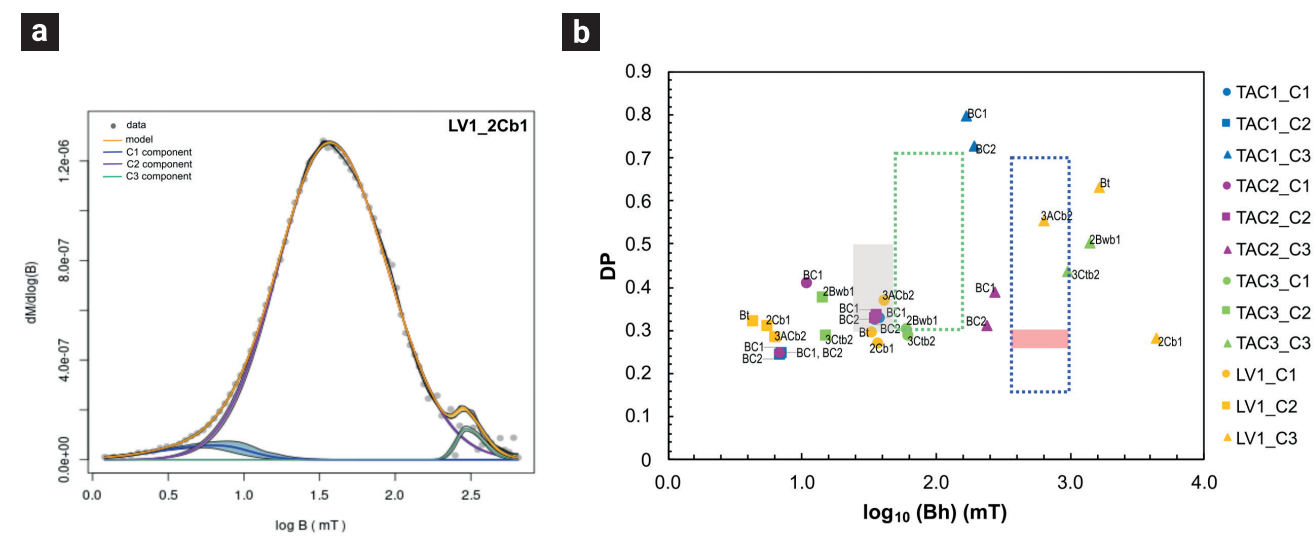
Figure 9 a) example of backfield coercivity spectra for the LV1_2Cb1 horizon (data shown in gray symbols) with the modeled best fit (yellow). Data were fitted using a three-component (C1, C2 and C3) model with a high coercivity component (green) and two low coercivity components (purple and blue). Shaded envelopes for component distributions and model indicate an approximate 95% confidence interval: b) Cross plot of the dispersion parameter (DP) and mean coercivity (Bh) for the B and C horizons for de C1, C2 and C3 component. Examples of modern pedogenic magnetite appear as the gray square (Egli, 2004; Geiss and Zanner, 2006; Lindquist et al., 2011; and Bourne et al., 2015) and hematite by the red rectangle (Hyland, (2015). Also, data for the B-horizon specimen from core and outcrop paleosols obtained by Maxbauer (2016a) is shown as a green dotted line square for the low-coercivity component and a blue dotted line square for the high-coercivity component.
In the case of the high coercivity component (C3), those of Bh in the Tacambaro Lake profiles are between 2.2 and 3 (167-1413 mT) and the DP between 0.2 and 0.4. While in the LV1 profile, the Bh values are between 2.8 and 3.6 (640-4330 mT), and the DP is between 0.3 and 0.6 (Figure 9b).
4.6.4. Magnetic mineralogy
Figure 10 shows the dispersion diagram of the remanent coercivity Hcr vs. SIRM/κ (Peters and Dekkers, 2003), in which the fields for different magnetic minerals are defined. The samples of the TAC3 profile are distributed along the titanomagnetite field, while those of the TAC1 and TAC2 profiles indicate a mixture of titanomagnetite and magnetite by their distribution. The mineralogy of the LV1 samples is mainly distributed in the maghemite field.
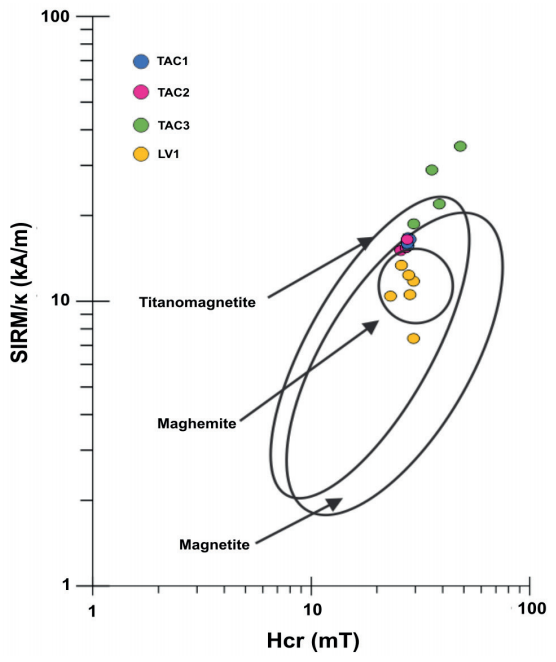
Figure 10 Hcr vs. SIRM/κ dispersion plot (Peters and Dekkers, 2003). Most of the samples for the Tacambaro Lake profiles fall in the magnetite and titanomagnetite zone, while in the case of the LV1 profile, they are also within the maghemite area.
4.7. Chronology and ẟ 13 C values
Three 14C AMS dates were obtained (Table 4). The calibration of radiocarbon age to calendar years was done using the High Probability Density Range Method (HPD) (Ramsey, 2008) as follows: INTCAL13 + NHZ2 (Hua et al., 2013; Reimer et al., 2013). The dates obtained for the Tacambaro profiles in the BC horizons are between 2006 and 1955 cal AD, while the date we have in the 2Cb1 horizon of the Lago Verde profile is 2007 cal AD. The values of δ13C are more negative in the Tacambaro Lake profiles, reaching -24.3 ‰, while in LV1_2Cb1, it is -18.1 ‰.
Table 4 Results of the 14C dating and δ13C signature.
| Sample | Lab ID | Profile | Depth (cm) | Conventional Radiocarbon Age (BP) | Date (cal AD) | δ13C (‰) |
|---|---|---|---|---|---|---|
| TAC1_BC2 | Beta - 625574 | TAC1 | 190 | -340 +/- 30 | 1955 | -24.3 |
| TAC2_BC2 | Beta - 625575 | TAC2 | 150 | -340 +/- 30 | 1955 | -23.6 |
| LV1_ 2Cb1 | Beta - 625577 | LV1 | 95 | -390 +/- 30 | 2007 | -18.1 |
5. Discussion
5.1. Soil development: integration of the rock magnetism and pedogenetic properties
It is possible to identify differences between the degree of development of pedogenesis and the magnetic properties of soils located in contrasting climatic regions of the TMVB. The characteristics of micromorphology, geochemistry, as well as magnetic mineralogy show a direct relationship with the conditions under which they developed. The lithogenic minerals found in the soil parent materials usually contribute to higher magnetic response (Maher et al., 2002), particularly in soils at the initial phases of pedogenesis. Although no C horizons are observed in the TAC1 and TAC2 profiles, TAC3 has two layers where this kind of horizon is still preserved (C and 3Ctb2 horizons), and one horizon (2Cb1) is present in the Lago Verde profile. The magnetic concentration of coarse ferrimagnetic minerals is high, based on our data on the high SIRM and lower χfd% values in the C and 3Ctb2 horizons of TAC3 (Figure 7c). In LV1, the 2Cb1 horizon has a higher percentage of SP particles than the rest of the profile; the χfd% reaches 8%, while its values are close to 2.5 % in the other horizons (Figure 7d). In general, this horizon has approximately equal percentages of silt, clay (Figure 3) and fine sand, as was observed in the thin sections (Figure 5f). The C horizons in Tacambaro are sandier (Figure 3). An abundance of residual volcanic rock fragments was clearly seen under the microscope. However, the values of weathering degree, calculated as the Ruxton ratio and the desilication index, were not too low (Table 2), probably due to the presence of soil fragments incorporated in the groundmass (Figure 4i) and rock fragments with alteration rinds that can be related to both hydrothermal and weathering processes (Figure 4h). The BC horizons of the Tacambaro soils are silty, but also with abundant rock fragments (Figure 4b). Magnetic properties of those horizons are similar, with high values of χ, SIRM, and HIRM300, with a mixture of SP particles and coarser grains since most χfd% values range between 2% and 8% (Figure 7a, 7b). Some differences were observed however: higher χ in BC1 than that in BC2, probably due to the presence of charcoal particles; it is well known that fires transform weakly-magnetic Fe oxides or hydroxides into magnetite or maghemite (Jordanova et al., 2019) with the consequent increase in magnetic susceptibility (Le Borgne, 1960; Kletetschka and Banerjee, 1995). BC1 also shows the presence of orthic Fe nodules, formed in situ, linked to redoximorphic processes (Dearing et al., 1995, Grimley and Arruda, 2007).
The Ah and AB horizons in the four profiles studied did not show the typical magnetic increase observed in soils derived from non-volcanic materials (e.g., Maher et al., 2002; Jordanova et al., 2016). On the contrary, a decrease in the concentration of magnetic minerals was observed. The transformation of lithogenic minerals by pedogenetic processes in the soil samples analyzed is not enough to erase the magnetic signal from the volcanic minerals. This behavior has also been observed in other volcanic soils of the Transmexican Volcanic Belt (Rivas et al., 2006, 2012), where magnetic minerals such as magnetite are present (Rivas et al., 2012). In the case of the AB horizons (TAC1_AB, LV1_AB) we detected high χ values probably due to fire-induced magnetite neoformation, as charcoal fragments were observed in the thin sections (Figure 4e). Wildfire-affected soils show systematic enrichment with iron oxides magnetite and/or maghemite in the topmost 0-2 cm. They are formed during a wildfire from the fire emissions and vegetation ashes or shortly after the fire due to the intensified microbial production of nanomagnetite (Jordanova et al., 2019).
The Bw and Bt horizons have the highest degree of development (TAC3_2Bwb1 and LV1_Bt); they exhibit more reddish colors (Figure 2) and are better structured (Figure 4j, 5d). In Lago Verde, the Bt horizon has a very significant level of weathering, according to the Si/Al, DI, and CIA indices, due to a relative accumulation of the most stable oxides such as Al2O3, TiO2, and Fe2O3 (Table 2). Regarding their magnetic properties, both horizons (TAC3_2Bwb1 and LV1_Bt) have similar patterns as they have higher magnetic susceptibility values but lower SIRM. However, in Tacambaro, the soil particles are finer (indicated by the higher χfd%) and softer (due to the low values of HIRM300). Practically all horizons in Tacambaro showed similar values in Si/Al, DI, and CIA indices (Table 2). However, a notable difference was found in the TAC3 profile, which had lower CIA values, even in the C horizons.
We observed clear differences between the TAC1-TAC2 and TAC3 profiles. The TAC3 is polycyclic (with several phases of sedimentation and soil formation). This difference can also be detected by changes in the magnetic mineralogical composition. The Hcr vs. SIRM/κ ratio suggests a predominance of magnetite in TAC1 and TAC2, while TAC3 additionally contains titanomagnetites (Figure 10). The XRD-data on the bulk samples show that the TAC1_BC1 horizon contains 7% of magnetite (semi-quantified), while TAC3_2Bwb1 contains 6% of hematite. It is interesting that in the Figure 8 biplot, the three cycles are clearly separated: the first horizons from the modern soil are in the same area of the TAC1 and TAC2 profiles, while the 2Bwb1 horizon is completely apart from the 3Ctb2. In the case of Lago Verde, where the climatic conditions are more humid and warmer, all the horizons are situated within a different zone of the biplot (Figure 8), with a higher contribution of maghemite (Figure 10) by the slow oxidation of magnetite (van Velzen and Dekkers, 1999; Chen et al., 2005). This result suggests a higher degree of development and maturity of this soil as compared to those of Tacambaro Lake.
The Dispersion vs. mean coercivity biplot (Figure 9) shows areas proposed by different authors that correspond to: pedogenic magnetite in modern soils (gray square, Egli, 2004; Geiss et al; 2008; Lindquist et al., 2011; and Bourne et al., 2015); hematite in red rectangle (Hyland et al., 2015); B horizons of paleosols in green dotted line square (Maxbauer et al., 2016a) for the low-coercivity component (partially oxidized pedogenic magnetite) and in blue dotted line square for the high-coercivity component (dehydrated fine-grained goethite into hematite, or simply hematite). Our soil samples contain the following minerals according to their origin: soft detritals (such as titanomagnetites) with Bh < 1.0 log10 mT. Soft pedogenics Bh between 1.0 and 1.5-2.6 log10 mT, hard pedogenics (maghemitized) values that are close to the green dotted rectangle. Although Maxbauer (2016a) says that its high coercivity components are between 2.5 and 3.0 log10 mT, which can be interpreted as hematite, a product of goethite dehydration, in our soils, we have values above 3.0 that could suggest the presence of goethite.
5.2. Landscape transformations
Climate, relief, and weather are the primary factors that control the development of a soil profile and predetermine different pedogenic trends (e.g., Ugolini and Dahlgren, 2002; Bernhard et al., 2018; Candra et al., 2021; Salazar- Jaramillo et al., 2022). The development of volcanic soils can follow different routes depending on the prevailing climatic conditions. In humid climates, it is possible to trace evolution from Regosol-type soils to clayey soils such as Luvisols and Acrisols (Parfitt and Saigusa, 1985, Delvaux et al., 1989, Shoji et al., 1993, Sedov et al., 2003) while under semi-arid conditions or in seasonal climates Regosols can evolve into Phaeozems and Vertisols (Shoji et al., 1993). In general, the first 100 years of soil development are characterized by the process of accumulation of organic matter both in cool and humid climates (Wada, 1985; Vilmundardóttir et al., 2014) and under humid tropical conditions (Nieuwenhuyse et al., 1993; Gracheva et al., 2001). Bt horizons formation, such as those of Lago Verde Profile, require a minimum of 10,000 years both in the semiarid climates (Jahn and Stahr, 1996) and in the humid tropical climates (Gracheva et al., 2001). However, the formation of a Bt horizon can be faster if the parent material originally contains clay (Birkeland, 1999, Díaz-Ortega et al., 2011). If we take into consideration only the degree of development of the soils studied, we can speculate that their formation took pedogenetic periods greater than one hundred years in the case of profiles TAC1 and TAC2, and even more time would be required for the presence of kaolinite (Table 3), which is a clay mineral that needs humid climates and time to form in volcanic soils (Shoji et al., 1993; Wilson, 1999; Sedov et al., 2003; Ryan and Huertas, 2009). It is considered that more than 10 ka are needed for the formation of kaolinite in soils (Wilson, 1999). However, there are signs of reworking in both profiles, i.e., the presence of charcoal (Figure 4e), with practically the same percentages of organic carbon in all the horizons (Figure 3). In “normal” soils, this value gradually decreases with depth. In the case of TAC3, there are three cycles of sedimentation and soil formation, each also including erosional phases. First, clear clay coatings observed in the 3Ctb2 horizon (Figure 3l) indicate that it is a remnant of a well-developed soil formed over a long period of landscape stability prior to the erosion of the upper genetic horizons (A and Bt). The second cycle is represented by a 2Bwb1 horizon, which, in terms of soil formation, represents a more evolved phase, but the lack of an A horizon also indicates erosion, i.e., movement of soil material down the slope to the Tacambaro Lake. Recent studies on magnetic parameters in superficial lake sediments in the Tacambaro Lake (Ortega-Guerrero et al., 2021) show similarities with our soil observations, e.g., a great proportion of low coercivity minerals. Detrital and pedogenic magnetite were also found in the sediments of the deepest part of the lake (Ortega-Guerrero et al., 2021). A brief period of strong erosion coinciding with the arrival of the Spanish conquerors in the region was identified within the superficial sediment record of the Tacambaro Lake (from 1760 AD). Possibly, there was a drastic change in the land use, e.g., a rapid deforestation that induced erosion (Ortega-Guerrero et al., 2021). The upper part of the profile (A, AC and C horizons) has uniform magnetic properties (Figure 8, Figure 9), therefore, it is likely to belong to a single pedogenetic phase. The radiocarbon ages obtained from the BC horizons in TAC1 and TAC2 are equal (1955 cal AD), which means that the destabilization of the slope occurred in recent times. Orozco-Ramírez et al. (2017) conducted a detailed analysis of the land use in Michoacan and showed that agriculture experienced a big expansion with avocado orchards during the 1970s, and lime (Citrus aurantiifolia) production started in some areas during the 1950s. More recent studies focused on satellite images indicate that between 2007 and 2019, the farmland and urban areas in the lake's surroundings increased by 50 % and 28 %, respectively (the forest cover decreased by 16 %). At the north of the volcanic cone, a large portion of the forest became farmland (Montero et al., 2021). It is likely that these changes are reflected in the soil erosion in the Tacambaro area.
In the Lago Verde profile, we have identified even more cycles of soil formation, with lower degrees of soil development. The first paleosol is represented by the 4Ab3 horizon, the second paleosol - by a 3ACb2 horizon (weakly pedogenized volcanic material), while the 2Cb1 horizon corresponds to a fine volcanic reworked sediment (Figure 5f) with 60% of plagioclases (Table 3). When we compare the geochemistry of the recent ashes from San Martin volcano (Espíndola et al., 2010; Rodríguez-Elizarrarás et a., 2023), none of them has the same composition. In profile LV1 we found lower values of bases and a relative increment of Al2O3 and Fe2O3 (Table 2), making it difficult to establish its provenance. This is due to weathering and reworking of the material.
The modern soil is better developed, with Ah, AB and Bt horizons. Nevertheless, even this soil shows strong evidence of reworking. At a depth of 90 cm, we obtained the date close to 2007 CE and observed a high amount of total carbon which is equal to that of the Ah horizon (Figure 3). In addition, this soil has a heterogeneous groundmass, including clayey soil fragments and fresh minerals without any signs of alteration (Figure 5d, 5e). Dirzo and García (1992) reported high deforestation rates in the Los Tuxtlas region since 1967 with an important reduction of the forest area, mainly due to the agricultural use. In 1998, the area was designated as a biosphere reserve (Von Thaden et al., 2018) and hence there was a reduction in the tendency for deforestation from 1998 to 2003. Unfortunately, Von Thaden et al. (2018) documented an increase in forest loss from 2007 to 2011. When soil lacks vegetation, it can easily erode. This can be the case of the studied profile as the age of the 2Cb1 horizon coincides with the 2007 deforestation phase. In the sedimentary records of Lago Verde, the upper 0.35 m corresponds to the last 40 years, also suggesting a recent trend for increasing erosion rates (Ortega-Guerrero et al., 2006).
6. Conclusions
The studied soils from the lake basins in climatically different regions of Central Mexico differ in pedogenetic development on a centennial-millennial scale. The LV1 profile shows the highest degree of development, which is manifested in a brighter red color, better structure, and higher weathering indices. In addition, the macro and micromorphological data indicate the development of horizons with clay cutans and Fe oxide stains in the LV1 profile, as opposed to the formation of BC horizons with abundant rock fragments in the TAC profiles. The clay mineralogy data showed the presence of kaolinite in the TAC3_2Bwb1 horizon, which is considered a clay mineral inherited from the parent material. However, smectite in the LV1_Bt horizon is a result of pedogenesis. As in other volcanic soils in the region, pedogenetic processes cannot erase the magnetic signal of the volcanic parent material, which accounts for the relatively higher concentrations of coarse ferrimagnetic minerals in the C horizons of the TAC3 and LV1 profiles. In the soil samples we identified the following minerals according to their origin: soft detrital (titanomagnetites) with Bh < 1.0 log10 mT, soft pedogenic Bh between 1.0 and 1.5-2.6 log10 mT, and hard pedogenic (maghemitized). The presence of magnetite was identified in profiles TAC1 and TAC2. In addition, titanomagnetites were observed in TAC3. The LV1 profile was characterized by a higher contribution of maghemite due to the slow oxidation of magnetite related to a more humid and warmer climate as compared to that at the TAC site.
The soils of the two lake basins have also suffered disturbances over the recent decades, possibly associated with anthropogenic activities. In Tacambaro, the presence of charcoal (indicated by higher χ) in the BC1 horizon is possible evidence of man-made fire events. In the case of the TAC3 profile, we observed three cycles of soil formation and subsequent soil erosion. The dating of the BC horizons of the TAC1 and TAC2 profiles at 1955 cal AD also points to a recent slope destabilization and mixing of the edaphic materials, i.e., such age implies the rejuvenation of the organic matter of the BC horizons by mixing with more recent plant material. In the modern soil of LV1 (Ah-AB-Bt horizons), reworking traits such as clayey soil fragments and fresh minerals were also observed. We obtained an age of 2007 CE for the 2Cb1 horizon at a depth of 90 cm, which also points to the intense movement of materials that was reported in ecological studies on the Lago Verde sediments of that time interval.
The information obtained in the present study, such as the characteristics of magnetic properties, micromorphology, and mineralogy of soils in the basins, will allow the establishment of a complementary soil-sediment link in paleoenvironmental studies, which previously focused on the climatic data provided by the limnological, physicochemical, and magnetic mineralogy analyses of the lake basin sediments in the central region of Mexico.

