


 nueva página del texto (beta)
 Inglés (pdf)
 Artículo en XML
 Referencias del artículo
 Enviar artículo por email
 Citado por SciELO
  Similares en
SciELO
Similares en
SciELO 
 Permalink
Introduction
The Xalapa earthquake of January 4, 1920 (MS6.4), is the second most deadly earthquake in Mexico’s recent history; only the Michoacán earthquake of 1985 (Mw8.0) caused more deaths (Suárez, 1992). Flores and Camacho (1922) reported a detailed description of the 1920 earthquake, based on which Figueroa (1974) elaborated and published an isoseismal map of the earthquake. More recently, Suárez (1992) revisited the earthquake region, summarized the damage and felt reports, and re-interpreted the data in a modern seismotectonic framework. Suter et al. (1996) augmented felt and damage reports from newspaper accounts and produced a revised isoseismal map.
According to Flores and Camacho (1922), 647 persons were killed as a consequence of the earthquake. Suter et al. (1996) reported that the number of death exceeded 1500. Most of the deaths were caused by a mud avalanche and debris flow. Modified Mercalli intensity (MMI) exceeded X in the epicentral zone. Intensities were as high as X-XI in the towns of Chilchotla, Coatepec, Xico, and Teocelo. In Xalapa the intensities did not exceed VIII-IX (Suárez, 1992). The damage was more extensive in the south of the city. Many houses suffered damage and some walls collapsed. Serious damage was reported to the post office building, the Justice Palace, and the Government Palace.
Xalapa lies in the eastern part of the Trans-Mexican Volcanic Belt (TMVB) (Figure 1). The belt is host to faults that are nearly parallel and orthogonal to its approximately E-W axis (Johnson and Harrison, 1990; Suter et al., 2001). Seismicity is relatively low in the TMVB but moderate and large earthquakes do occur. Xalapa earthquake of 1920 is one example. Acambay earthquake of 1912 (MS7.0), which occurred in the central part of the TMVB about 100 km WNW of Mexico City (Urbina and Camacho, 1913), is another example. Suárez et al. (1994) reported a large earthquake in 1568 (M~7) in/near Guadalajara which caused severe damage to the city. A relatively large earthquake on February 11, 1875, destroyed the town of San Cristóbal de la Barranca located about 40 km NNW of Guadalajara (García Acosta and Suárez Reinoso, 1996). Cities and towns in the Mexican altiplano, such as Xalapa, are exposed to seismic hazard from earthquakes in the TMVB. Unfortunately, with the exception of Mexico City and the city of Oaxaca, there are few strong-motion recordings of such earthquakes in other cities of the altiplano. This leads to uncertainty in the estimation of seismic hazard. An estimation of ground motion during these events may be obtained by converting reported MMI to peak acceleration, Amax, or/or peak velocity, Vmax (Trifunac and Brady, 1975; Wald et al., 1999). This, however, is an extremely unreliable process, especially because no such relationship is available for the region of interest.
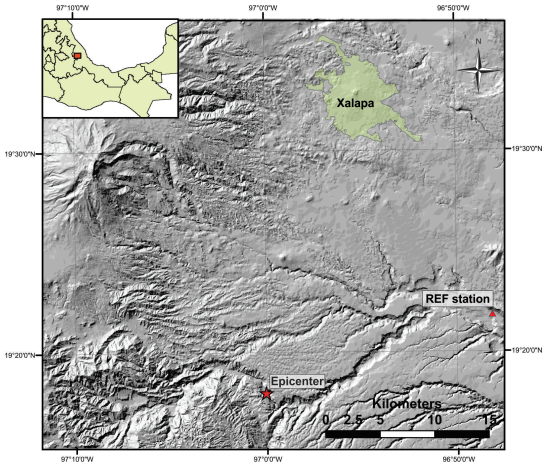
Figure 1 High resolution digital elevation model (Lidar image) showing the city of Xalapa, the epicenter of the 1920 Xalapa earthquake, and the reference site (REF).
Xalapa is also exposed to large intermediate-depth, normal-faulting, intraslab earthquakes in the subducted Cocos plate. Such earthquakes have caused frequent, severe damage in the Mexican altiplano. Some examples are the earthquake of January 15, 1931 (M7.8), which caused heavy damage to the city of Oaxaca (Barrera, 1931; Singh et al., 1985), and the earthquakes of August 28, 1973 (Mw7.0), October 24 1980 (Mw 7.0), and June 15, 1999 (Mw7.0), all of which resulted in deaths and damage in the states of Veracruz, Puebla, and Oaxaca (Singh and Wyss, 1976; Yamamoto et al., 1984; Singh et al., 1999). Significant intraslab earthquakes in the vicinity of Xalapa are listed in Table 1 and plotted in Figure 2. Of these events, the three recent Mw7.0 earthquakes of 1973, 1980, and 1999 were located within 250 km from Xalapa (Figure 2). Yet, due to lack of seismic instrumentation, no recording is available of ground motion produced by these events in the city. García et al. (2005) have derived ground motion prediction equations (GMPEs) for intraslab Mexican earthquakes. These equations are valid for hard sites in the fore-arc region. As Xalapa lies in the back-arc with possible significant site effect, there is no reason to expect that the GMPE would be valid for the city.
Table 1 Intraslab earthquakes within 250 km of Xalapa that are relevant to this study.
| Event | Date | Latitude (°N) | Longitude (°W) | Depth | Magnitude |
|---|---|---|---|---|---|
| 1 | 1864-10-03 | 18.70 | 97.40 | --- | 7.3a |
| 2 | 1879-05-17 | 18.60 | 98.00 | --- | 7.0a |
| 3 | 1937-07-26 | 18.48 | 96.08 | 85 | 7.3a |
| 4 | 1973-08-28 | 18.30 | 96.53 | 82 | 7.3 (mB)c, 7.0 (Mw )d,e |
| 5 | 1980-10-24 | 18.03 | 98.27 | 65 | 7.0 (mB)c, 7.0 (Mw )c,d |
| 6 | 1999-06-15 | 18.15 | 97.52 | 60 | 7.0 (MW)g |
| 7 | 2009-05-22 | 18.10 | 98.43 | 41 | 5.7 (Mw)h |
c. m B: long-period body-wave magnitude (Abe, 1981)
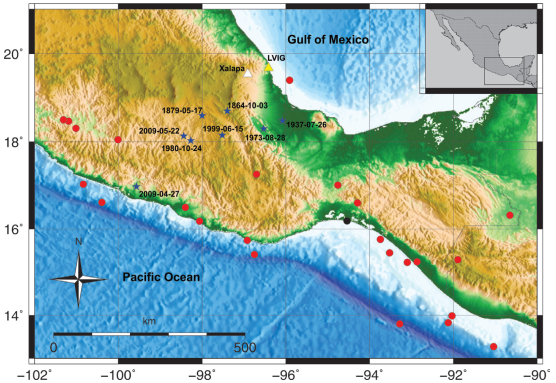
Figure 2 Seismicity location. Red circles: earthquakes used in the estimation of site effect in Xalapa. Blue stars: significant intraslab earthquakes within 250 km of Xalapa which are discussed in the text. Black dot: earthquake whose recordings at REF and LVIG are used to estimate the site effect at REF.
The main goal of this paper is to estimate Amax and Vmax in Xalapa during the 1920 earthquake and during the three Mw7.0 intraslab earthquakes (1973 Orizaba, 1980 Huajuapan, and 1999 Tehuacán). To accomplish the latter, an estimation of the site effect at several locations in the city is performed and then a stochastic method is applied, an approach that has proven very useful in regions lacking recordings (Boore, 1983). The predicted ground motions from these types of earthquakes (shallow and intraslab) should help constrain and complement probabilistic seismic hazard analysis (PSHA) in the city of Xalapa.
1920 Xalapa earthquake
A precise location of the earthquake and geometry of the causative fault could not be determined due to the lack of adequate seismic instrumentation. The epicenter of the event, 19.3 ºN, 97.0 ºW, listed in different studies of the earthquake, is based on the area that suffered the highest damage. This epicenter is ~ 29 km SSE of Xalapa (Figure 1). A Wiechert seismograph was temporarily installed in Xalapa within a few days after the earthquake. Hypocentral distances obtained from the seismograms of the aftershocks were 30 to 40 km, ruling out intraslab origin of the earthquake in the subducting Cocos plate since such an event would occur at depths greater than about 60 km (Suárez, 1992). The geologic fault where the 1920 earthquake originated has not yet been identified and probably does not have a surface expression.
According to Suter et al. (1996), satellite imagery shows a lineament ≥ 15 km long and striking N72°E in the area of the highest damage. The orientation of this lineament is parallel to the trajectories of the tectonic maximum horizontal stress in this region, inferred from the alignments of Quaternary cinder cones (Suter, 1991; Zoback et al., 1990). Normal faults have been mapped from geological surface observations further west in the TMVB (Johnson and Harrison, 1989; Suter et al., 1991). Earthquakes in the TMVB are shallow in depth (< 15 km) with normal-faulting focal mechanism (Suárez and Ponce, 1986; Singh et al., 2011). Most probably the Xalapa earthquake occurred also at a shallow (depth ≤ 15 km) on a normal fault with an ~ E-W orientation.
The magnitude of the Xalapa earthquake listed in the catalog of Mexican earthquakes by Figueroa (1970) is 7.8. This magnitude is unrealistically high. It does not appear to be an instrumental magnitude but was probably subjectively assigned, biased by the damage reports. Singh et al. (1984) estimated surface-wave magnitude, MS, as 6.4 from an Uppsala Wiechert seismogram. Suárez (1992) reported body-wave magnitude, mb, as 6.4. In this study, Mw = MS = mb = 6.4 will be taken for this earthquake, where Mw is the moment magnitude.
Intraslab earthquakes
The intraslab earthquakes relevant to this study, which have occurred in the states of Oaxaca, Veracruz, and Puebla, are shown in Figure 2 and listed in Table 1. The source parameters of the earthquakes of 1973, 1980, and 1999, including location, depth, and Mw, should be fairly reliable as they are based on special studies. It is for these three intraslab earthquakes that ground motions in Xalapa are estimated.
A Brief Description of the Stochastic Method
If Fourier amplitude spectrum and duration of the intense part of ground motion at a site can be specified, then the peak ground motion parameters can be estimated through the application of Parseval’s theorem and results from the random vibration theory (Cartwright and Longuet-Higgins, 1956; Hanks and McGuire, 1981; Boore, 1983, 2003). An estimation of the Fourier acceleration amplitude spectrum of the ground motion of an earthquake, A(f, R), can be obtained from the following relation which is valid under far-field, point-source approximation (Singh et al., 2002):
where
In equations (1) and (2), Ṁ0( f ) is the moment rate spectrum, R = hypocentral distance, Rθf = average radiation pattern (0.55), F = free surface amplification (2.0), P takes into account the partitioning of energy in the two horizontal components (1/√ 2), b = shear-wave velocity in the focal region, ρ = density in the focal region, and G(R) accounts for the geometrical spreading. The terms in the second square bracket of Equation (1) modify the source acceleration spectrum, f2Ṁ0(f). In these terms Q(f) = quality factor which includes both anelastic absorption and scattering. The attenuation in the near-surface layer and the finite bandwidth of the observed spectrum imposed by the sampling rate are taken into account by parameter κ (Singh et al., 1982; Anderson and Hough, 1984) and/or Butterworth filter B(f, fm). Following Boore (1983), B(f, fm) = (1.0 + (f / fm)8))-0.5 was taken. Often either B(f, fm) or κ is found sufficient to model the high-frequency fall off of the observed spectrum. S(f) in Equation (1) is the local site effect.
In using Equation (1), it was assumed that the sources follow a Brune ω-2 model, i.e.,
where fc is the corner frequency which is related to the source radius, a, by fc = 2.34β/2πa (Brune, 1970). The source radius, in turn, is related to stress drop, Δσ, by Δσ = (7/16)(M0 /a3).
To compute A(f, R) estimations of Δσ, fm, κ, Q(f), and the site effect S(f) are needed. As will be mentioned later in the text, Q(f), corresponding to crustal and intraslab earthquakes, are reasonably well known. Reasonable values of Δσ, fm, and κ in the estimation of peak ground motion parameters will be assumed. Below, the procedure used to estimate the site effect, S(f), in Xalapa is described.
Deployment of portable seismographs in Xalapa
To determine the site effect, broadband seismographs were deployed in the city in nine locations (Figure 3). Some of these sites were located in the area that experienced the large damage during the 1920 earthquake. An additional station was installed on a hard site which was taken as the reference site. Given the low signal/noise ratio within the urban area, the reference station (henceforth called REF) was installed near the town of Jalcomulco ~ 20 km from Xalapa (Figure 1). At the REF site in Jalcomulco, basement rock is composed of Mesozoic calcareous rocks, characterized by a low noise level, while in Xalapa, the noise level is considerably higher. Although basaltic lava flows crop out throughout Xalapa city, the underlying volcanic stratigraphy includes loose pyroclastic material, which could explain the high noise levels.
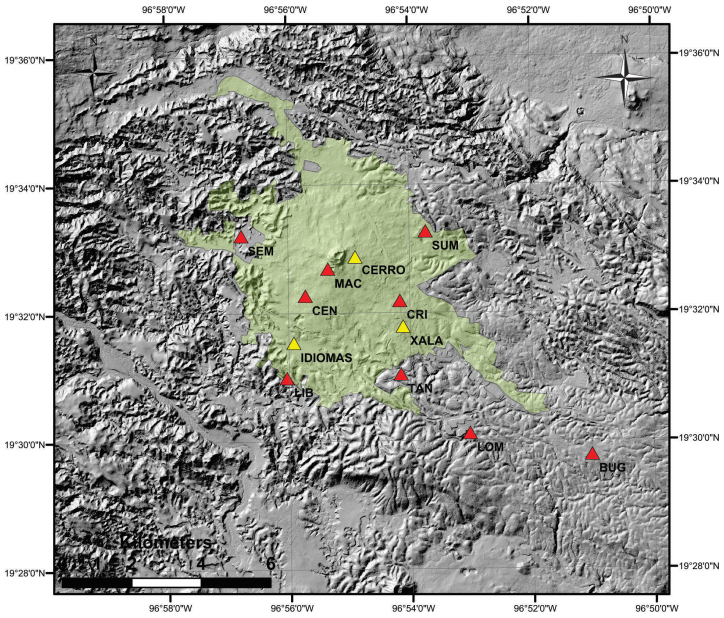
Figure 3 High resolution Lidar image of Xalapa. Red triangles: nine sites in the city where portable seismographs were deployed to estimate site effect. Yellow triangles: temporary stations (CERRO and IDIOMAS) deployed by another workgroup and the accelerographic station (XALA). XALA is operated by Instituto de Ingeniería UNAM.
Since only a limited number of seismographs were available, their location was changed three times during the experiment, thus occupying a total of nine sites. Only the REF station operated continuously at the same site.
The seismographs functioned in autonomous mode recording continuously at a sampling interval of 0.01 s. Figure 3 shows location of XALA, an accelerographic station operated by Instituto de Ingeniería, UNAM, and two portable seismographs that were deployed by another group at sites CERRO and IDIOMAS in 2009. Amax and Vmax values of two earthquakes recorded at these stations were used in the present study to compare observed and estimated values.
Site effect estimation using standard spectral ratio (SSR) technique
All the events reported by the Servicio Sismológico Nacional (Mexican National Seismological Service, SSN) that were recorded at the reference station, REF were first selected. From this set of earthquakes, those that were also recorded at one or more temporary sites in Xalapa were chosen. The earthquakes are listed in Table 2 and their locations are shown in Figure 2.
Table 2 Focal parameters of earthquakes used in the estimation of site effect at nine locations in Xalapa. Source: Mexican National Seismological Sevice (http://www.ssn.unam.mx).
| Date | GMT Time | Latitude °N | Longitude °W | Depth km | M |
|---|---|---|---|---|---|
| 26/11/2007 | 21:56:16 | 18.50 | -101.31 | 53 | 5.6 |
| 07/12/2007 | 06:00:01 | 16.50 | -98.40 | 20 | 4.7 |
| 11/12/2007 | 01:28:52 | 15.74 | -96.92 | 27 | 4.6 |
| 13/12/2007 | 17:08:54 | 17.26 | -96.70 | 82 | 4.5 |
| 04/01/2008 | 14:27:57 | 17.01 | -94.76 | 122 | 4.4 |
| 05/01/2008 | 01:56:45 | 13.83 | -92.12 | 63 | 5.6 |
| 06/01/2008 | 16:55:20 | 13.99 | -92.03 | 20 | 5.0 |
| 12/02/2008 | 12:50:18 | 16.19 | -94.54 | 90 | 6.6 |
| 12/03/2008 | 04:51:52 | 15.23 | -93.10 | 97 | 4.8 |
| 12/04/2008 | 08:23:18 | 17.03 | -100.84 | 20 | 4.5 |
| 15/04/2008 | 03:03:06 | 13.27 | -91.04 | 40 | 6.5 |
| 15/04/2008 | 07:31:43 | 18.31 | -101.01 | 65 | 4.6 |
| 17/04/2008 | 01:52:59 | 15.45 | -93.52 | 95 | 5.4 |
| 28/04/2008 | 00:06:29 | 18.05 | -100.01 | 52 | 5.6 |
| 28/04/2008 | 08:18:02 | 16.61 | -100.39 | 7 | 4.6 |
| 29/04/2008 | 10:56:42 | 18.47 | -101.19 | 60 | 5.4 |
| 30/04/2008 | 10:47:10 | 15.24 | -92.87 | 125 | 4.5 |
| 04/05/2008 | 10:21:35 | 15.41 | -96.75 | 10 | 4.5 |
| 17/05/2008 | 20:04:08 | 16.18 | -98.06 | 40 | 4.8 |
| 25/05/2008 | 05:45:12 | 15.29 | -91.89 | 198 | 4.7 |
| 31/05/2008 | 08:05.30 | 16.32 | -90.65 | 25 | 4.8 |
| 05/06/2008 | 05:11:26 | 15.76 | -93.74 | 99 | 4.8 |
| 22/06/2008 | 01:32:07 | 16.60 | -94.29 | 112 | 4.9 |
| 27/06/2008 | 02:33:03 | 19.40 | -95.91 | 22 | 4.0 |
| 29/06/2008 | 09:42:19 | 13.80 | -93.28 | 25 | 5.1 |
The recordings were first corrected for instrumental response. The standard spectral ratios (SSRs) were computed by dividing the Fourier amplitude spectrum of each of the horizontal components recorded at the Xalapa sites by the Fourier amplitude spectrum of the corresponding component at the reference station. Baseline correction and 5% cosine taper were applied to the traces before computing the amplitude spectrum. The spectra were smoothed by applying 1/6 octave filter before computing the spectral ratios (see Córdoba-Montiel, 2010 for details). The NS component sensor at the reference station REF failed on March 16th, 2008. Therefore, the SSRs of subsequent recordings were computed with only the EW component assuming both components to be equal. The same assumption was made at station LOM which NS component also failed during the experiment.
Site effect at the reference site REF
It was first checked that REF was indeed a hard site by computing horizontal to vertical (H/V) spectral ratios (Lermo and Chávez-García, 1993) using the records obtained at this site during the first months after installation. Figure 4 shows median and ±1 standard deviation curves of H/V spectral ratio computed for several registered earthquakes. The median ratio at REF was ~ 1 implying no significant amplification of seismic waves at this site and, hence, it was considered to be a hard site.
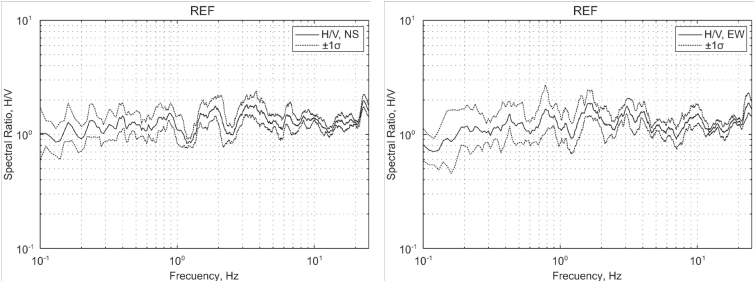
Figure 4 Horizontal to vertical (H/V) spectral ratio as a function of frequency at the reference station, REF. The curves corresponding to the median and ± 1 standard deviation are shown. Left: NS component, right: EW component.
Figure 5 shows SSRs (site/REF spectral ratios) at sites in Xalapa. These ratios illustrate a de-amplification around f = 10 Hz at most of the sites which suggests either high attenuation of seismic waves at sites in Xalapa or an amplification at REF near 10 Hz. An amplification at REF site would not be problematic if ground motions of future earthquakes could be predicted on this site. The motions elsewhere in Xalapa could then be estimated using the known site effect (relative to REF). This, for example, is the method often used in Mexico City where the observed or estimated ground motion at the reference site of CU (Ciudad Universitaria, a hill-zone site in Mexico City) is used to calculate the motions elsewhere in the city (Singh et al., 1988). The method was validated by Ordaz et al. (1988). The estimation of ground motion at CU is possible since many events have been recorded at the site since 1964. This, of course, is not the case for the reference site REF. It is, therefore, important to know if REF is amplified at high frequencies and, if so, to quantify this amplification.
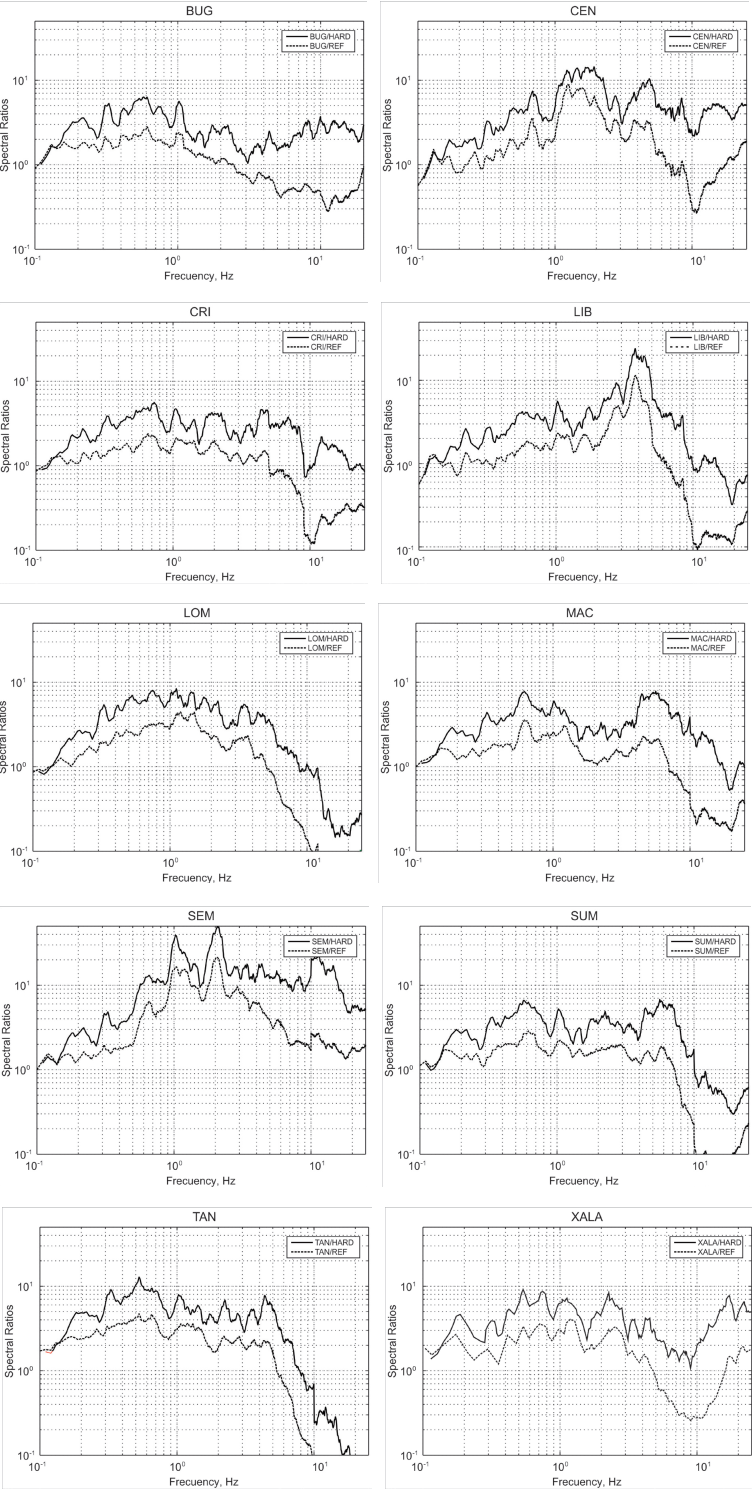
Figure 5 Standard spectral ratios (SSRs) of EW component at sites in Xalapa. Dashed curves: Site/REF spectral ratios. Continuos curves: Site/Hard (Site/LVIG) spectral ratios.
Recordings at REF and LVIG produced by the Oaxaca earthquake of February 12, 2008 (16.35 ºN, 94.51 ºW; Mw6.5, H = 87 km, black circle in Figure 2), provide an opportunity to check and quantify possible site effect at REF (Figure 6). LVIG is a SSN broadband station located in the Laguna Verde nuclear plant facility, it is approximately at the same distance (~ 440 km) and nearly at the same azimuth as REF (Figure 2). LVIG is a known hard site (Singh et al., 2006). The median REF to LVIG spectral ratio of the two horizontal components is shown in Figure 7. There are three arguments which support REF/LVIG spectral ratio as reasonable proxy for the spectral amplification at REF with respect to a hard site. Firstly, as mentioned above LVIG is known to be a hard site (Singh et al., 2006). Secondly, a peak in the REF/LVIG spectral ratio occurs at about 10 Hz (Figure 7) which corresponds to the sag in the spectral ratios at sites in Xalapa with respect to REF (Figure 5). Thirdly, as shown later, the observed spectrum at REF during an intraslab earthquake of May 22, 2009, is similar to the theoretical spectrum corrected for REF site effect. Clearly, a truly hard site in Xalapa would have been desirable as a reference site. However, the use of REF/LVIG spectral ratio as the spectral amplification at REF with respect to a hard site is a reasonable compromise.
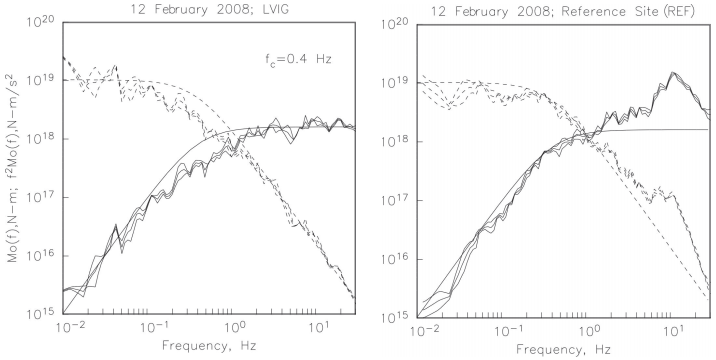
Figure 6 The source displacement (dashed curves) and acceleration spectra (continuous curves) retrieved from the recordings at LVIG and REF are shown on the left and right graphics, respectively.
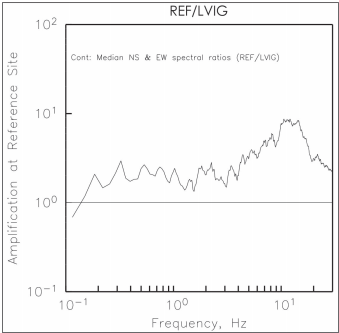
Figure 7 Median (REF/LVIG) spectral ratio of the two horizontal components of February 12, 2008, earthquake (black dot in Figure 2). Since LVIG is a hard site, the spectral ratio gives site effect at REF.
To estimate site effect in Xalapa with respect to a “true” hard site, we need to multiply the SSRs computed with respect to REF, shown in Figure 5, by the REF/ LVIG spectral ratio given in Figure 7. The resulting site effect is also shown in Figure 5. Two sites with unusually large amplification are LIB (~ 20 times at ~ 4 Hz) and SEM (~ 40 times at ~ 2 Hz).
Ground motions in Xalapa
Under some further reasonable assumptions, we can now compute A(f, R) in Equation (1) using the random vibration theory to estimate peak ground motion parameters. The shallow Xalapa earthquake of 1920 and the intraslab earthquakes will be separately treated.
Estimation of ground motion for the 1920 Xalapa earthquake
As the earthquake was shallow, ρ = 2.85 gm/cm3 and β = 3.6 km/s were chosen in the source region. Since R ~ 30 km, in this case the geometrical spreading term, G(R) was taken, as 1/R. Q = 98f0.72 obtained by Singh et al. (2007) for the central TMVB was taken. A ω-2 Brune source model (Equation 3) was assumed. Following Herrmann (1985), the approximation for the duration of the intense part of the ground motion, Td, by Td = 1 / fc + 0.05R, where R is in km was used. It was assumed that the high-frequency fall off of the spectrum could be adequately modeled by B(f, fm) and setting κ = 0.0 s (this value for 1920 earthquake was based on REF recordings). Figure 8 shows estimated Amax and Vmax assuming fmax = 10 and 15 Hz, and Δσ = 30, 50 and 100 bar, a reasonable range of stress drop for crustal earthquakes in the TMVB. Observed spectra at REF support fmax between 10 and 15 Hz (Córdoba-Montiel, 2010) and κ = 0.0 s. As expected, the peak values are somewhat greater for fmax of 15 Hz than 10 Hz. For Δσ = 50 bar and fmax of 15 Hz, the estimated Amax values were between 100 and 250 cm/s2, except at sites LIB and SEM where they are ~ 300 and 600 cm/s2, respectively. These are also the sites with large site effect (Figure 5). Δσ of 30 and 100 bar produce about half and twice of these peak values, respectively. Estimated Vmax values for Δσ = 50 bar were between 10 and 20 cm/s, except at SEM where it is ~ 40 cm/s. Again, Δσ of 30 and 100 bar give rise to about half and twice of these peak values. At a hypothetical hard site in Xalapa (R ~ 30 km), Amax and Vmax, corresponding to Δσ = 50 bar, would be 40 cm/s2 and 3.5 cm/s, respectively. Thus, the site effect in the city causes an amplification of Amax and Vmax by a factor of ~ 3 to 6.
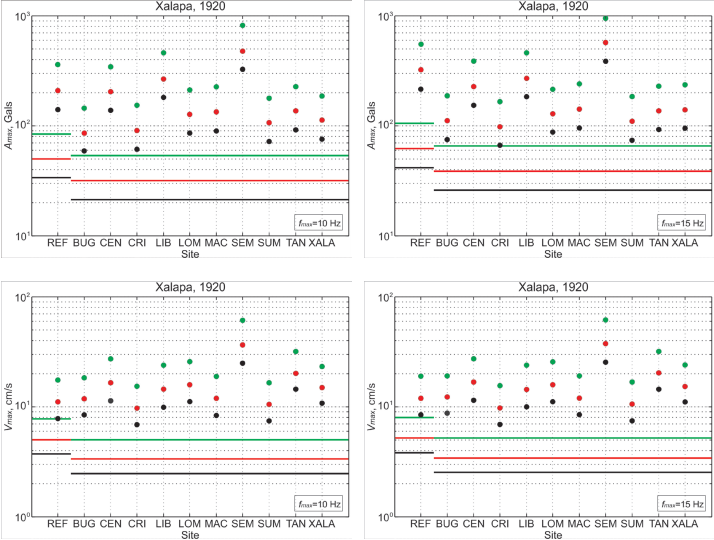
Figure 8 Estimated Amax and Vmax at sites in Xalapa and at REF during the 1920 Xapala earthquake assuming fmax = 10 and 15 Hz. Black, red, and green dots correspond to Δσ of 30, 50, an 100 bats, respectively. Black, red, and green lines show estimated values corresponding to Δσ 30, 50, 100 bars, respectively, ignoring the site effect.
Estimation of ground motions for intraslab earthquakes
Note that hypocentral distances of the 1973 Orizaba and 1999 Tehuacán earthquakes from Xalapa are roughly the same (168 km and 177 km, respectively). As the magnitudes of the two earthquakes are the same, Mw7.0, the estimated peak ground motions for the 1973 earthquake will also be roughly valid for the 1999 earthquake.
For simulating ground motions, ρ = 3.2 gm/cm3 and β = 4.68 km/s were chosen in the source region. Following García et al. (2004), the geometrical spreading, G(R), is taken as 1/R for all R. García et al. (2004) reported Q(f) = 251f0.58 for intraslab earthquakes, the stations reported by these authors were located in the forearc region. Singh et al. (2006 analyzed seismograms of intraslab earthquakes recorded at station LVIG, located in the backarc, and relatively close to Xalapa (Figure 2). They found that S waves were highly attenuated requiring a quality factor given by Q(f) = 120f0.75. These authors attributed low Q to wave trajectories partly traversing through the mantle wedge. In the present ground motion simulations at Xalapa this Q will be used. Also fmax = 15 Hz and κ = 0.04 s were selected (for intermediate-depth events this value was based on intraslab earthquake recording of May 22, 2009).
A validation of the chosen parameters above is provided by the recordings of the intraslab earthquake of May 22, 2009, which was located near the 1980 Huajuapan earthquake (Figure 2, Table 1). It was recorded at stations REF, XALA, IDIOMAS, and CERRO in Xalapa, and at LVIG in Laguna Verde. Unfortunately, the seismograms at IDIOMAS and CERRO were not available for analysis in the present study, only the Amax and Vmax values. The 2009 earthquake was studied in some detail by UNAM Seismology Group (2010). From the analysis of S-wave spectra, M0 and Δσ of the earthquake were estimated as 4.6x10¹⁷ Nm (Mw5.7) and 340 bar, respectively. Figure 9 compares the observed spectra with the estimated spectra at REF, XALA, and LVIG (through Equation 1) using the parameters given above, including and excluding site effect (site effect = 1 for LVIG). The spectra ignoring the site effect are, as expected, well below the observed ones. The observed and estimated spectra with site effect are in reasonable agreement, except at low frequencies. The disparity at low frequencies, which is due to poor estimations of the stochastic method at low frequencies (i.e. Boore, 1983), can be reduced by assuming a larger magnitude and/or choosing G(R) corresponding to the dominance of surface waves. A larger magnitude, however, is unacceptable as it would not be in agreement with the study of UNAM Seismological Group (2010) and Mw5.6 reported in the Global CMT catalog. On the other hand, the dominance of surface waves over body waves and Q(f) = 120f0.75 are not compatible. Amax and Vmax are associated with the spectrum at higher frequencies (f > 1 Hz). Since the estimated and observed spectra are in reasonable agreement at f > 1 Hz, it was justified to use the parameters given above for estimating spectra of the target events. Estimated (via stochastic method) and observed Amax and Vmax at sites REF, XALA, and LVIG are given in Table 3 along with the predictions from the GMPE for intraslab Mexican earthquakes by García et al. (2005). The estimations from the stochastic method at REF and XALA are greater, but within a factor of ~ 2, from the observed ones. The results in Table 3 give some confidence that the stochastic predictions for target earthquakes, based on the chosen parameters given above, may be accurate within a factor of 2 to 3. Estimated Amax and Vmax at sites in Xalapa along with observed values, if available, are shown in Figure 10. As in the case of the 1920 earthquake, relatively high peak values, related to large site effects (Figure 5), occur at SEM, LIB, and CEN. Figure 10 also shows predictions from the GMPE and stochastic method excluding site effect. Stochastic predictions of Amax and Vmax in Xalapa with and without site effect differ by a factor of ~ 3 to 6. Curiously, the estimated Amax in Xalapa via stochastic method including site effect is, on average, about the same as from the GMPE even though there is a considerable site effect in the city. This is most probably a consequence of two opposing effects. Although the seismic waves suffer amplification due to the site effect, it is counterbalanced by higher attenuation due to lower Q along the wave path traversing the mantle wedge. The estimated Vmax from stochastic method at Xalapa site, on average, is greater by a factor of ~ 2 as compared to that from GMPE (Figure 10). It seems that the amplification caused by site effect and deamplification resulting from a low Q in the mantle wedge do not balance at frequencies related to Vmax and the amplification effect dominates.
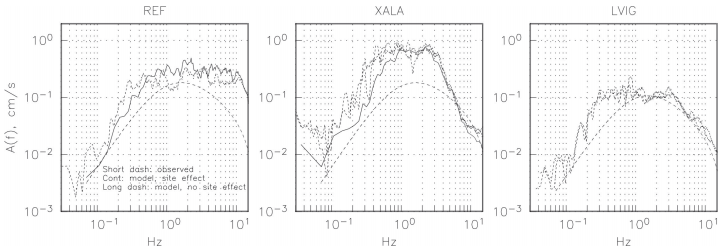
Figure 9 Observed spectra (short dashed curves) of horizontal components at REF, XALA, and LVIG for the intraslab Chiautla earthquake of 2009 (Table 1). Estimated spectra (through Equation 1), including site effect (continuous curves) and excluding site effect (long dashed curves) are also shown. The spectra ignoring the site effect, , are below the observed ones. The observed and estimated spectra with site effect are in reasonable agreement except at low frequencies (see text).
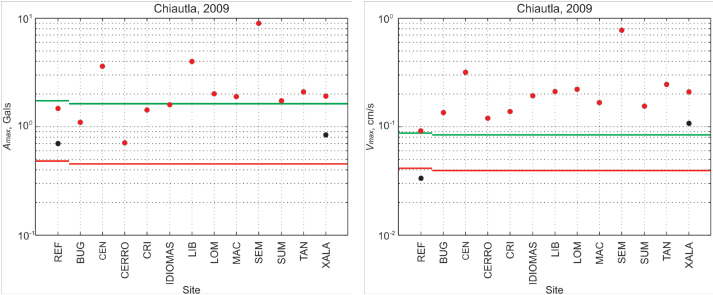
Figure 10 Estimated (red dots) and observed (blue dots) Amax and Vmax at sites in Xalapa and at REF for the Chiautla earthquake of 2009. The estimations are from application of the stochastic method. Red line shows stochastic estimation excluding site effect. Green line indicates estimation from GMPE of García et al. (2005).
Table 3 Observed and estimated Amax and Vmax during intraslab earthquake of 22 May 2009 (Mw5.7) at sites REF and XALA in Xalapa, and LVIG in Laguna Verde.
| Station | Observed | Stochastic estimation# | Estimation fro GMPE$ | |||||
|---|---|---|---|---|---|---|---|---|
| Amax' cm/s2 | Vmax' cm/s | Amax'cm/s2 |
Vmax' cm/s |
Amax' cm/s2 |
Vmax' cm/s |
|||
| NS | EW | NS | EW | |||||
| REF% | - | 7.0e-1 | - | 3.3e-2 | 1.5e0 | 9.1e-2 | 1.8e0 | 8.7e-2 |
| XALA | 9.0e-1 | 7.8e-1 | 1.1e-1 | 1.1e-1 | 1.9e0 | 2.1e-1 | 1.7e0 | 8.4e-2 |
| LVIG | 1.7e-1 | 2.3e-1 | 2.1e-2 | 2.7e-1 | 3.9e-1 | 3.7e-2 | 8.8e-1 | 5.2e.2 |
#Stochastic estimation is based on ω-2 source with Mw 7.0, Δσ = 304 bar Q(f) = 120f0.72, fmax = 15 Hz, κ = 0.04 s and includes site effect at XALA (see text).
κ = 0.04 s, and includes site effect at REF and XALA (see text). Site effect is taken 1 at LVIG
$ GMPE from García et al. (2005) for the quadratic mean of the two horizontal components.
% NS component malfunctioned at REF.
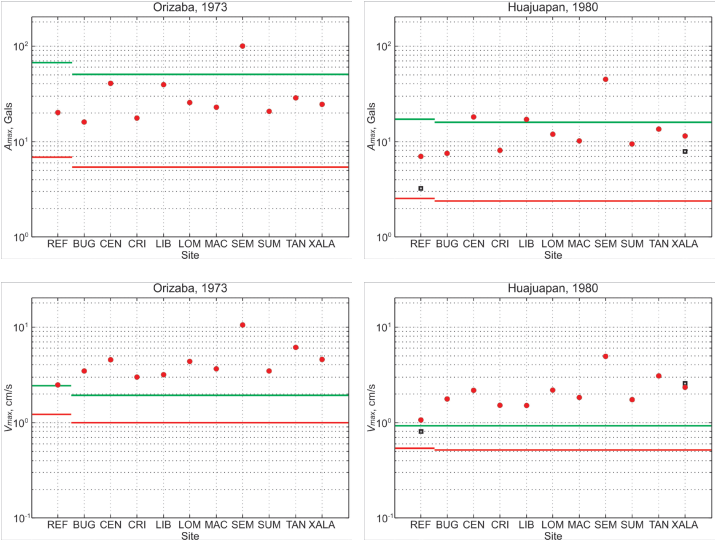
Peak ground motions in Xalapa during the intraslab earthquakes of 1973 and 1980 were estimated using the stochastic method and the parameters given above. As mentioned earlier, the earthquake of May 22, 2009, was located near the 1980 earthquake (Figure 2). The recordings of the 2009 event at REF and XALA as empirical Green’s function (EGF) were used to synthesize motions at these sites following a random summation scheme proposed by Ordaz et al. (1995). In the synthesis a stress drop was used, Δσ, of 340 bar for the EGF event of 2009 as reported by UNAM Seismology Group (2010). The same stress drop for the target events was assumed. Table 4 lists the estimated peak values at sites REF and XALA from the stochastic method and the GMPE for the 1973 and 1980 earthquakes. For the latter earthquake, the estimated peak values from the EGF technique are also listed. The predictions from the stochastic method are similar to those obtained by the EGF technique for the 1980 earthquake. Unlike the 2009 earthquake, the estimated Amax at Xalapa sites by the stochastic method is, on average, somewhat larger than that predicted by the GMPEs for both 1973 and 1980 earthquakes (Figure 11). Estimated Vmax from the stochastic method for both earthquakes are consistently larger than those obtained from GMPE by a factor of ~ 2 (Figure 11). The present estimated Amax and Vmax values at sites in Xalapa during the 1973 Orizaba earthquake are ~ 30 cm/s2 and 4 cm/s, respectively; the corresponding values during the 1980 Huajuapan earthquake (and, hence, also during the 1999 Tehuacán earthquake) are ~12 cm/s2 and 2 cm/s.
Table 4 Estimated Amax and Vmax at sites REF and XALA near/in Xalapa from Mw7.0 intraslab earth quakes of 1973 and 1980.
| Earthquake | Station | EGF estimation% | Stochastic estimation# | Estimation from GMPE$ | |||||
|---|---|---|---|---|---|---|---|---|---|
| Amax' cm/s2 | Vmax' cm/s |
Amax' cm/s2 |
Vmax' cm/s |
Amax' cm/s2 |
Vmax' cm/s |
||||
| NS | EW | NS | EW | ||||||
| 1973, | REF, F = 147km | - | - | - | - | 20.3 | 2.4 | 67.9 | 2.4 |
| M w 7.0 | XALA, R = 168 km | - | - | - | - | 24.6 | 4.6 | 50.8 | 1.9 |
| 1980, | FER, R = 224 km | - | 3.2 | - | 0.8 | 6.9 | 1.0 | 16.9 | 0.9 |
| M w 7.0 | XALA, R = 229 km | 8.2 | 7.5 | 2.9 | 2.1 | 11.3 | 2.3 | 15.7 | 0.9 |
% Accelerogram of May 22, 2009 (Mw 5.7), used as empirical Green's finction. Synthesis follows a random summation scheme proposed by Ordaz et al. (1995). Δσ = 340 bar for both EGF and target events.
#Stochastic estimation is based on ω-2 source with Mw 7.0, Δσ = 304 bar Q(f) = 120f 0.72, fmax = 15 Hz, κ = 0.04 s and includes site effect at XALA (see text).
$GMPE from García et al. (2005) for the quadratic mean of the two horizontal components.
Discussion and Conclusions
A stochastic method was applied to estimate Amax and Vmax in the city of Xalapa during some critical earthquakes of the last century. The calculations account for amplification of seismic waves due to site effect. A Brune ω-2 source model and a stress drop, Δσ, of 50 bar was assumed to estimate Amax in Xalapa during the shallow, crustal 1920 Xalapa earthquake (Mw6.4). The present estimates of Amax range between 100 and 250 cm/s2 reaching approximately 300 and 600 cm/s2 at two locations with the largest site effect. The estimated Vmax values are between 10 and 20 cm/s except at the location of the largest site effect where it is ~ 40 cm/s. When ignoring the site effect the model yields Amax and Vmax of 38 cm/s2 and 3 cm/s, respectively. Thus the site effect amplifies Amax and Vmax by a factor of ~ 2.5 to 6 at most locations but by ~ 15 at one site.
The parameters used in the estimation of ground motion during the 1920 earthquake are not constrained by data, since no recording of local, crustal earthquakes in Xalapawere available. The peak ground motions are critically dependent on stress drop. For example, Amax and Vmax values for Δσ = 30 and 100 bar are about half and twice those for Δσ = 50 bar. A stress drop between 30 and 100 bar is probably reasonable for crustal earthquakes in the TMVB. If so, then Figure 8 summarizes the corresponding range of Amax and Vmax values which may have occurred during the 1920 earthquake.
The estimated peak ground motions from the intraslab earthquakes are expected to be reliable (within a factor of about 2) since a better control on average stress drop was available from a previous study (García et al., 2004). There is also some validation of other input parameters used in the application of the stochastic method. It comes from the Xalapa recordings of an Mw5.7 intraslab earthquake and simulation of ground motions using these traces as empirical Green’s functions. Median Amax and Vmax of ~ 30 cm/s2 and 4 cm/s, respectively were estimated in Xalapa during the 1973 Orizaba and 1999 Tehuacán earthquakes; the corresponding values during the 1980 Huajuapan earthquake are ~ 10 cm/s2 and 2 cm/s. In the isoacceleration map of the 1999 earthquake, Xalapa falls between the contours of 20 and 40 cm/s2 (Singh et al., 1999), which agrees with the present estimation of Amax. From the range of Amax and Vmax at sites in Xalapa shown in Figure 11 and GMICE by Wald et al. (1999), the estimated MMIs for the 1973 and 1999 earthquakes are IV-V while for the 1999 earthquake it is III-IV. These intensities are lower than MMI of VI reported by Figueroa (1974) for the 1973 earthquake and VI estimated by Yamamoto et al. (1984) for the 1980 earthquake. The reason for this discrepancy, as in the case of the 1920 earthquake, probably arises from the fact that the GMICE developed from recent California data is not valid for the TMVB.
As previously reported for Laguna Verde, the seismic waves from intraslab earthquakes traversing through the mantle wedge before arriving Xalapa are expected to suffer relatively large attenuation. However, these waves amplify due to local site effect. It seems that in Xalapa the two effects, roughly, balance each other. As a consequence, the Ground Motion Prediction Equation, developed from data in the forearc region with lesser attenuation and at hard sites (García et al., 2005), appears to work reasonably well for Xalapa.
The present study provides a rough estimation of peak ground motions in Xalapa during the scenario earthquakes considered above, and lays ground for their estimation during future postulated earthquakes. The large uncertainty in the estimations can only be mitigated by extensive recording of local and regional earthquakes in the city.

