


 nueva página del texto (beta)
 Inglés (pdf)
 Artículo en XML
 Referencias del artículo
 Enviar artículo por email
 Citado por SciELO
  Similares en
SciELO
Similares en
SciELO 
 Permalink
Introduction
On September 19, 1985, a magnitude 8.1 earthquake occurred near the Pacific coast of Mexico on the Michoacán Gap of the Mexican subduction zone. Severe damage occurred in Mexico City, at a distance of 300 km to the rupture area, caused mainly by the dynamic amplification of the lakebed deposits. The government did not know the full extent of the damage until many hours later because the communication systems were severely disrupted. A total of 7,400 buildings were affected, including 265 collapsed and 775 severely damaged (Meli, 1986). The number of deaths was estimated between 10,000 and 15,000 (Astiz et al., 1987). Mexico City’s primary water system failed leaving almost 3.5 million people without water (Ayala and O’Rourke, 1989; O’Rourke and Ayala, 1993). The power supply was interrupted in vast areas. The damage caused by the earthquake was much larger than anyone could have expected, and the weakness and lack of proper management of the emergency by the government was revealed.
Technological advances in seismic instrumentation, digital communication and computer technologies enable the implementation of real-time early warning and rapid damage assessment systems. An earthquake early warning system can provide a rapid notification (time, location and magnitude) from a few to tens of seconds before the arrival of strong ground shaking. This information can help to minimize loss of lives and property (Kanamori et al., 1997). In some cases, managers or authorities in charge of strategic facilities may receive this information even before the ground shaking begins, allowing timely emergency shutdowns or other opportune protection measures for systems susceptible to damage, such as power stations, transport and computer centers and telephone systems (Erdik et al., 2003; Erdik, 2006). Erdik and Fahjan (2006) provide a review of early warning systems in countries such as Japan, Mexico, United States, Taiwan, Italy, Rumania, Turkey and Greece.
Systems for rapid damage assessment can provide real-time estimates of the distribution of ground shaking intensities, building damage and impacts on the population. This information is useful to activate previously set emergency management scenarios and to efficiently execute search and rescue activities. For instance, the EPEDAT system (Early PostEarthquake Damage Assessment Tool) was developed to estimate building and lifeline damage in Southern California (Eguchi et al., 1994; 1997). In Japan, the Tokyo Gas Company developed the SIGNAL system (Seismic Information Gathering and Network Alert), to estimate damage of a natural gas network based on extensive earthquake monitoring and geographic information systems (Yamasaki et al., 1994). Currently, there are several systems capable of computing damage and casualties in several regions of the world. Erdik et al. (2010) summarizes the work done over the last decades regarding the development of recent approaches and the setting up of new applications for earthquake rapid response systems. What is common to most of these systems is that they require a large number of seismic stations deployed over the epicentral region for a quick detection of the earthquake, a reasonably accurate estimation of the potential damage and a continuous communication between the seismic stations and the central processing station.
In this work, the early earthquake damage assessment system developed for Mexico City, based on a single station, which has been working since 2005 is presented. This system estimates losses (fatalities and building and water supply network damage) immediately after an earthquake is recorded, without human intervention. The system records accelerations (two horizontal components) at the base station and computes their response spectra. Pre-calculated response spectral ratios are then used to compute response spectra at thousands of predefined sites throughout the city. Fatalities, as well as building and water supply network damages are estimated using intensity-fatality and intensity-damage relations derived for six classes of buildings representative of Mexico City’s stock, and one relation for the water supply network. This information, along with the geographic distribution of the buildings, the population and the water supply network, allows the computation of expected losses after about two minutes. These estimates are finally sent to government officials, to a web page and to the Emergency Management Center, to provide the information for an opportune decision (http://aplicaciones.iingen.unam.mx/webSAPS/).
Description of early earthquake damage assessment system
Figure 1 presents a general scheme of the early earthquake damage assessment system in Mexico City, which involves mainly two processes: (Process A) pertaining to seismic data acquisition and processing; and (Process B) dealing with the storage, delivery and publication of the generated information.
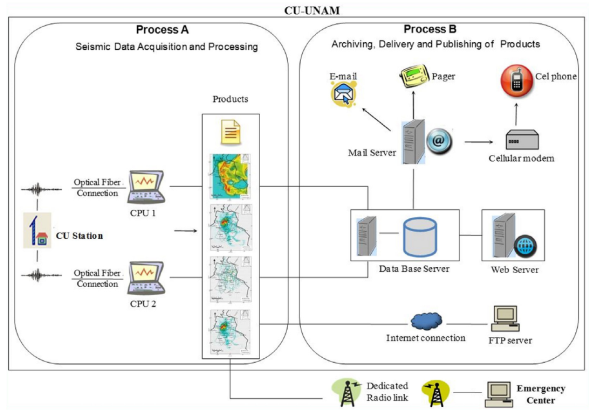
Process A includes the following tasks:
Acquisition, detection and recording of real-time acceleration data;
Computation of peak ground acceleration, peak ground velocity and response spectra at the reference station;
Computation of peak ground acceleration, peak ground velocity and response spectra at other sites throughout the city;
Estimation of damage in buildings and the water supply network, as well as fatalities;
Transferring of the generated maps and tables to a server for Process B.
Tasks of Process B are related to the automatic publication of the generated information. A detailed description of Process B is out of the scope of this study, which focuses on the seismological aspect.
Real-time seismic data recording
The real-time seismic data acquisition is based at the reference station CU (Ciudad Universitaria), where strong ground motions of more than 30 events have been recorded since 1964. Since the early nineties, this station has also a broadband seismometer. It is located at a hill zone site over basaltic lava flows, and it has become the reference site to study the dynamic amplification at the lakebed zone of Mexico City (Singh et al., 1988a,b; Ordaz et al., 1989; Montalvo-Arrieta et al., 2002).
CU station operates a parallel redundant system of two accelerometers, each one connected by optic fiber cable to a separate computer, where seismic data are processed independently. The optic fiber cables pass through their own conduit but the pipeline is the same in certain sections. Therefore, if the pipelines were damaged by an earthquake, it could generate damage to the optic fiber cable and cut communication. In this study, we assumed that during a large earthquake (e.g., a similar or worse event than that of September 19, 1985) the CU station will no suffer severe damage. For instance, during the 1985 seismic event, no damage was reported at the CU station and surrounding structures (e.g., Meli, 1986; O’Rourke and Ayala, 1993), since it is not located at the lakebed zone, the shaking does not reach levels to damage the station and the conduit. Additionally, it is important to note that CU station is approximately 100 m away from the Seismic Processing Centre of the Institute of Engineering of the National Autonomous University of Mexico (II-UNAM). Therefore, it was not considered necessary to use two different routes to reach the optic fiber to the Seismic Processing Centre. Other options could be used to improve the real-time seismic data acquisition. For instance, adding more stations for true redundancy and improving the real-time seismic data acquisition (e.g., stations Tacubaya, TACY or Secretaría de Comunicaciones y Transportes, SCT). Another option is to implement a radio transmission system between CU station and the II-UNAM Seismic Processing Centre.
It should be noted that each accelerometer has an external deep cycle battery of 70 Ampere-hour, which can keep operating the system during 10 to 12 days without power supply. In addition, these batteries are recharged by a dual power supply system. A first energy-supply system is based on an array of solar panels with a design that requires only 3 h of solar insolation to maintain the battery charged. The second energy-supply system operates with a single-phase supply of 127 volts. Although the time life of the batteries is estimated to be about 3 years, new batteries are installed every 12 to 18 months.
Data acquisition, detection and recording are carried out using the SEISLOG system (Havskov, 2006), which was configured to generate events in SEISAN format based on a STA/LTA (Short Time Average/Long Time Average) trigger algorithm. As it was mentioned before, each accelerometer is connected to a different computer, where seismic data are processed independently. Therefore, in case of a large event the system retrieves the seismic data from the first computer (CPU 1). If for any reason the seismic data were not generated in this computer, then the system would proceed to use the information from the second computer (CPU 2).
Evaluation of strong ground motion AT the reference station
The seismic signal at CU station is continuously recorded and evaluated to determine when a seismic event has occurred or not. The system then computes, for two horizontal components, peak ground acceleration, peak ground velocity and spectral accelerations for selected structural periods.
Results by Iglesias et al. (2007) suggest that the minimum peak ground acceleration (PGA) at CU for an earthquake to be considered a relevant event should be about 2 cm/s2, since this intensity would occur about twice per year, and in view of the amplification at the lakebed zone, it would be felt by most people. However, we observed that some seismic events with no relevant magnitude (Mw<5.9) could trigger the system based on a single measure. Therefore, we have considered a second criterion where the mean horizontal spectral acceleration at T=1 s must be 1.5 times larger than the mean horizontal PGA to prevent that these earthquakes could be triggered. Consequently, we have proposed that a warning must be issued when the following two criteria are fulfilled: (1) the mean horizontal PGA equals or exceeds 2 cm/s2; and (2) the spectral ratio between the mean horizontal spectral acceleration at T=1 sec and its corresponding mean horizontal PGA is larger than 1.5.
Table 1 shows some representative earthquakes used to check these two conditions. Note that the two criteria implicitly take into account that the rapid damage assessment system will be triggered with earthquakes with magnitude approximately larger than Mw=5.9 (events with symbol √).

Estimation of ground motion intensities at Soft Soil
Once the ground motion at the reference station is evaluated and fulfills the above described criteria, the next step is the calculation of ground motion intensities at other sites in the city. As it was mentioned previously, it is assumed that the strong ground motion at CU is a measure of the seismic input motion that excites the soft soil of Mexico City.
Estimation of seismic intensities (PGA, PGV and spectral responses) for other sites throughout the city is performed using response spectral ratios (RSR) (Rosenblueth and Arciniega, 1992; Reyes, 1999) pre-computed for a grid of 6400 points, approximately 400 m apart. The mean response spectrum measured at CU station is multiplied by the RSR at each of these points in order to obtain an estimation of the local response spectrum. Also, PGV measured at CU is multiplied by a precomputed amplification factor at each point in order to obtain the local PGV value.
RSR for the grid of points are determined -off line- in two steps. First, for all instrumented sites in the city (about 120, located mainly in the lakebed zone; see Figure 2), empirical spectral ratios and PGV ratios are obtained by averaging the computed ratios, for each accelerometric station with respect to CU station and for all the earthquakes that have been recorded simultaneously at each station and at CU. In a second step, RSR are determined for arbitrary sites (those that pertain to the 6400-point grid) through interpolation (Pérez Rocha, 1999; Pérez-Rocha et al., 2009). The interpolation procedure is as follows: 1) each RSR at an instrumented site is normalized with respect to its dominant period (Reinoso and Lermo, 1991); 2) the normalized RSR of the instrumented sites are used in a twodimensional Bayesian interpolation scheme to obtain the normalized RSR at an arbitrary site (the Bayesian prior amplification values at an arbitrary site are those associated to 1D SH-wave propagation analysis); and 3) the interpolated normalized RSR is renormalized with respect to its dominant period. In this study, we considered that RSR for lakebed sites are relatively constant regardless of the magnitude, epicentral distance and azimuth of subduction and normal faulting earthquakes (Reinoso and Ordaz 1999). For other occasional rare large earthquakes within the TransMexican Volcanic Belt (e.g., the Acambay earthquake of 1912 M~7.0), we also assumed that RSR for lakebed sites with respect to CU for shallow, crustal earthquakes at regional distances may be similar to those estimated for shallow, coastal earthquakes (e.g., Singh et al. 2011). At least for Mexico City, it is well known that the clay has behaved almost linearly for most of the sites so far, and that the observed nonlinear behavior, if any, is very small (Reinoso and Ordaz, 1999).
As mentioned, in order to reduce the computing time of the real-time calculation, we pre-calculate the RSR for a grid of points.

Real-Time estimation of damage and fatalities
Construction of the exposure database
We use three sets of exposure databases: buildings, water supply network, and population. The area of study is presented in Figure 3, including zones where heavy damage has been reported during past seismic events, such as the 1957 (M = 7.5; Orozco and Reinoso, 2007), 1979 (M = 7.6) and 1985 (M = 8.1) events.

Building database
We obtained from the Mexico City government a database of all buildings. A total area of 830 million square meters of the city is covered, with a total built area of approximately 313 million square meters. For each property, the data base contains structural information such as year of construction, number of stories, construction area, occupancy and a qualification of the maintenance. According to our experience, we divided the total 1,023,508 buildings into six classes, depending on their corresponding number of stories. Characteristics of these six classes, along with some related statistics, are shown in Table 2.

We assumed structural systems for the six classes based on their dynamic response and on construction characteristics at Mexico City, namely: a) building classes 1 and 2 are buildings of confined masonry walls with reinforced concrete slabs commonly used for housing; b) buildings class 3 are reinforced concrete frame buildings with masonry infill walls; c) building classes 4 and 5 are reinforced concrete frame buildings with concrete shear walls and d) buildings class 6 are steel frame buildings with concrete shear walls. From an analysis of the database information, it was also concluded that the building classes could also be grouped considering the year of construction, as those built after 1987 (building classes 1, 2, 5 and 6) and those built between 1959 and 1976 (building classes 3 and 4).
A key parameter to estimate the seismic response of a building is its dominant period, T. In order to estimate the period of vibration, we used an empirical expression inferred from acceleration records obtained during earthquakes in instrumented buildings in Mexico City, in terms of the number of stories, N, as T=0.08×N1.26 (Mosquera, 2007).
With this information, we created a database in a geographical information system (GIS), including our own corrections from either full or sidewalk inspections.
Since the available time to carry out the computation is short, the studied area was divided into 6400 cells, each one of 400 × 400 m, where only 4250 of 6400 cells contain available information representative of the building and population database of the city (Figure 3). For the purpose of this work, at each cell we obtained spatially aggregated information of built-up area per square meter and maximum number of occupants of the six considered building classes. Table 3 shows additional characteristics of the six building classes, including their assigned fundamental period. Table 3 also shows parameters related to expected fatalities caused directly by the buildings damage (FH, FT, and FF) and parameters that define the vulnerability of the structures (K and α) whose details will be shown later. Figure 4 shows the distribution of the built-up area of buildings with number of stories between 6 and 10. It can be noted that these buildings are located at zones where severe damages were reported during past earthquakes (Figure 3). Although results were obtained for all classes of buildings, in what follows only results for these buildings will be shown.

Figure 4 Example of distribution of building database by cell for the rapid damage assessment system in Mexico for buildings having between 6 and 10 stories.

Water supply network
From Mexico City government a description of the Mexico City’s main water supply network was obtained, having more than 600 km length with a flow of about 35 m3/sec of water for 8.5 million inhabitants. The database of water supply network created in a GIS has a wide variety of diameters, mainly 20” (140.20 km, 23.2%), 32” (22.78 km, 3.8%), 36” (81.79 km, 13.5%), 48” (323.4 km, 53.6%) and 72” (25.36 km, 4.2%). The materials of the pipelines are made of asbestos cement, concrete, cast iron and steel. The location of pipelines by material is unknown. As it will be seen later, pipeline damage in soft soil of Mexico City is only related to the ground motion parameter PGV2/ PGA (Pineda and Ordaz, 2007). Figure 5 shows the distribution of Mexico City’s water network.

Population Database
In order to assess the social impact related to earthquake life losses caused by building damage, we estimated information related to the maximum number of occupants in the buildings. Statistics of percentage of population by time of the day, day of week and occupancy type are available in the literature (Coburn et al 1992). However, we used approximate occupation density by building occupancy (Reinoso and Jaimes, 2015). Building occupants were inferred by multiplying the approximate occupation density by the construction area contained into the database for each building. From a total of 1,023,508 buildings in Mexico City, approximately 12.67 million of maximum occupants were obtained. The percentages corresponding with the number of stories into six classes above mentioned are 43.46% (1 to 2), 40.32% (3 to 5), 10.86% (6 to 10), 3% (11 to 15), 1.41% (16 to 20) and 0.95% (>20). Finally, as it was previously mentioned, we obtained spatially aggregated information of the maximum number of occupants, Oij, for the structural class i and for the cell j. Figure 6 illustrates the distribution of population in buildings with 6 to 10 stories.

As it has been observed during earthquakes, the time of the earthquake occurrence determines where the person is more likely to be trapped. Therefore, it will be a different scenario if the earthquake occurs during the day, when people are located out-doors, in public buildings and offices, or during the night, when almost everyone is at their homes. Table 3 presents average occupant ratios at different hours of the day (FH, in this work) based on the survey origin-destination (Coburn et al. 1992; INEGI, 2010). The time intervals based on the survey are: 1) daytime is considered to be from 9:00 a.m. to 2:00 p.m. and from 4:00 p.m. to 6:00 p.m., 2) nighttime between 8:00 p.m. and 7:00 a.m., and 3) commuting time from 7:00 a.m. to 9:00 a.m., from 2:00 p.m. to 4:00 p.m. and from 6:00 p.m. to 8:00 p.m. With the mentioned ratios, we estimated the distribution of 7.31, 6.18 and 7.86 millions of persons at the buildings during the day, commuting and night, respectively.
Seismic damage anda fatalities
Building Damage Assessment
For the case of buildings, seismic intensity is expressed in terms of spectral acceleration at the fundamental period of vibration of the building. The mean damage ratio Dij, defined as the ratio of the expected repair cost to the replacement cost of the structure, for a group of class structures i, located in the cell j, is computed a
 1
1
In Eq. (1), Sij is the spectral acceleration measured at the period assigned to class i. Ki and αi are parameters that define the vulnerability of structures of class i based on a combination of construction material, construction type, number of stories and year of construction (Ordaz et al., 1994). In this study, the parameters Ki and αi were determined by:
1. Comparing vulnerability functions ended up in a proprietary software (RS-Mex©, also known as the UNAM model, Ordaz et al., 2000) used by the insurance industry to compute and manage their catastrophic risk. Recently, this software has been used by national governments and institutions to study scenarios of losses and affected people (R-FONDEN for Mexico and CAPRA for Latin America), and
2. Carrying out empirical analysis of damage due to past earthquakes at Mexico City, but mainly due to the 1985 earthquake.
These damage functions, together with the seismic intensities, allow us the calculation of damage for each class of building at each cell. Table 3 presents the values of Ki and αi .
Figure 7 shows the six damage functions used in this work. If we accept that, within a cell, the replacement cost of structures of a given class is constant, then Dij can be interpreted as the fraction of the total area covered by structures of class i in cell j that was damaged.

Figure 7 Example of building intensity-damage relations for the rapid damage assessment system in Mexico City.
To compute the damage, we translated the damage ratio given by Eq. (1) into loss by multiplying it by the total area Aij covered by structures of class i at cell j. The result is an equivalent damaged area with a reconstruction value proportional to the value of the economic losses produced by the earthquake,
 2
2
Notice that PBij has units of area. Assuming that the reconstruction cost per unit area is independent of structural class, the expected loss at cell j for all the structural classes PBj can be obtained with a simple addition:
 3
3
Once the total losses are calculated for all cells the geographical distribution of the damage can be generated.
Damage assessment for Mexico City’s water network
The damage to the water system was quantified in terms of the number of pipe repairs per unit length of pipeline. Pineda and Ordaz (2007) analyzed the behavior in the Mexico City’s primary water network due to the 1985 earthquake and proposed an intensity-damage relation in terms of PGV2/ PGA, where PGV and PGA are the peak ground velocity and acceleration, respectively, yielding a relationship between the pipeline damage rate Dpi (number of repairs per kilometer) and PGV2/PGA given by

This pipeline damage function, together with the seismic intensity (measured in terms of PGV2/PGA) obtained at midline for each segmented pipeline; allowed to compute the geographical distribution of the damage of water supply network.
Fatality assessment
There are models that relate the fatalities from earthquakes to factors such as buildings with severe damage or collapse, and the occupancy at the time of earthquake (e.g. Coburn et al., 1992; Murakami, 1992; Reinoso et al. 2005). A method proposed by Reinoso et al. (Reinoso and Jaimes, 2015) was used to obtain fatality ratios associated directly with structural damage for the six building classes and the occupancy at the time of an earthquake. The mean fatality ratio, RFij, for a structure of class i located at cell j, is obtained as
 5
5
where, as it was mentioned earlier, FH is the occupants ratio in the structure class i at the time of the earthquake occurrence and the maximum occupancy; FT is the ratio of trapped people which depends on the structural type and the occupants at the time of an earthquake; FF is the ratio of trapped people and those who would die if not rescued (this value depend on the structural type, number of stories, and the emergency management of the city); and FSFij is a structural damage factor related to the expected damage (Eq. 1) for a group of class structures i, located in the cell j. As it will be explained later, FSFij is proposed to relate the affected people on the building with Dij.
FT depends on the preparedness, education and building size, among others; it is well known that some people manage to evacuate the building before it collapses or present severe damage. On the other hand, most collapsed buildings leave spaces and gaps where people may escape the ruins by themselves or eventually are rescued. Ratios of trapped people with respect to number of occupants at the time of the earthquake were used. This means that only a fraction of the people, FT, who are in the building will be trapped in the ruins. Table 3 shows the values of FT resulting from a comprehensive empirical analysis of a database obtained for the 1985 earthquake (Reinoso an Jaimes, 2015).
FF depends on type of contents, age and health of occupants, structural type and type of collapse, occupancy and number of stories, rescue teams efficiency, weather conditions, fires, and intensities of aftershocks among others. Published data on fatalities rates is limited. Coburn et al. (1992) summarized approximate casualty rates for masonry and reinforced concrete structures based on worldwide data. Table 3 shows the values of FF used in this work.
FSFij depends on the damage of every building. We assume that large expected damage is correlated with large probabilities of caused victims. This may not be true especially for modern ductile buildings, where the expected damage can be very large but they do not collapse. FSFij is expressed through a lognormal probability distribution of the mean damage ratio Dij as
 6
6
where Φ is the cumulative standard normal distribution, xm is the median of the damage of the building required to produce damage to the people in the building, βc is the logstandard deviation, and Dij is the damage given by Eq. 1 in percentage. Values of xm and βc of 17 and 0.3, respectively, were obtained from a comprehensive empirical analysis of the database of earthquakes in Mexico, mainly the 1985 earthquake. Figure 8 shows an example of intensity-fatality relations during day for the six structural classes.

Figure 8 Example of intensityfatality relations considering the number of stories and that the earthquake occurs during the day for the rapid damage assessment system in Mexico City.
The expected fatalities during an earthquake and their spatial distribution throughout the city for the structural class i and for the cell j is,
 7
7
where Oij is the maximum number of occupants for a group of class structures i, located in the cell j and RFij is the mean fatality ratio given by Eq. 5.
The expected fatality in the cell j for all the structural classes, PFj, is obtained as,
 8
8
Similarly, once the total fatalities are calculated for all cells, the geographical distribution of the fatalities can be generated to estimate losses.
Illustrative examples
In what follows, the results for two examples will be shown: 1) the Michoacán, September 19, 1985, earthquake and 2) the April 25, 1989 earthquake.
We use strong ground motion records of the September 19, 1985 earthquake (M = 8.1) recorded at CU station as a hypothetical event to trigger the rapid damage assessment system. Figure 9 presents the spatial distribution throughout the city considering the September 19, 1985 event: spectral intensity for structural period of T=2 sec (Figure 9a), building damages applying Eq. (3) (Figure 9b), damages for the Mexico City’s primary water network (Figure 9c) and fatalities applying Eq. (8) (Figure 9d). Note that damage distribution matches the zones where heavy damages have been reported during past earthquakes (Figure 2).

Figure 9 Spatial distribution throughout the city considering the September 19, 1985 event: a) spectral intensity for structural period of T=2 s, b) building damage, c) damage of the Mexico City’s primary water system and d) fatalities.
The second case study is the April 25, 1989 earthquake (M = 6.9). This earthquake was very well recorded by all stations of the Guerrero and Mexico City networks. Also, this earthquake has been the strongest earthquake felt in Mexico City after the 1985 one. Figure 10 presents the same maps as those shown in Figure 9 for the 1989 earthquake. Note that neither damages to buildings nor fatalities are predicted.

Notification system structure
After a major disaster, many types of data must be displayed as an aid to make decisions. Therefore, an automated reporting system is fundamental to obtain timely information for an effective response.
In order to carry out these automated processes, a custom application SAPS (Sistema Automático de Publicación de Shakemaps, Automatic System for Publishing Shakemaps) was developed to allow the rapid delivery of information by different communication mediums. The system is written under the Visual Studio (.NET) environment and the SQLServer is used as the database management system for storing and retrieving the information. Web Services are also employed for communication in the internal network, and to offer data access management and delivery of notifications in a simple and secure way. The application allows the following activities:
Creation and consulting of a historic database of shaking related products
Information related to the last published event
Recovery of an event to be published in case of an error
Storing maps and kmz google files
Management of e-mail distribution lists and notifications
Management of the web site
System monitoring and alerts
Management of errors
In Figure 1, the notification system structure transmits products to the Emergency Center and to decision makers by the following ways:
Short text messages to cell phones and pagers
Different types of e-mail messages and attached maps, according to previously set configurations
FTP servers over the Internet
Radio communication link based on disperse spectrum radio-modems with Ethernet inter-phase and FreeWave brand, and Yagi antennas
Via a passive Web page in which the user must seek for the information
Conclusions
A high-resolution rapid damage assessment system for Mexico City was presented to estimate real-time loss due to an earthquake and to improve emergency response based on a single accelerometric station. Fatalities and damage to buildings and the water supply system throughout the city in 10 to 15 minutes after an earthquake were estimated (depending on the standard PC computer speed), using real-time recorded (PGA) and computed (PGV and spectral ordinates for selected structural periods) seismic intensities at the reference station, pre-calculated response spectral ratios at soft sites, intensities-damage and intensitiesfatalities relations, along with the geographic distribution of constructions, population, and water supply system. Since the available time to carry out the computation is short, building and population database in populated areas, with a square mesh of 400 × 400 m, were elaborated. The system runs automatically on two computers with no human intervention. This information is sent to an Emergency Center so that decision makers can prioritize response and recovery efforts to focus on those areas most impacted by the earthquake during the initial period of the emergency (i.e., the first 1-3 hours). In addition, damage estimates can be used to set previously designed emergency plans which may include possibly required resources.
The development of the system could be applied to other regions and could be useful for variety of potential users. Any organization with a need to know damage impacts immediately after moderate and large earthquakes can benefit from this real-time earthquake damage assessment system. This technology which makes up rapid loss estimation could, however, be applied in a number of planning and response environments. This earthquake rapid damage assessment system could be adjusted to improve the emergency response of governments, lifeline maintenance teams and large corporations with geographically distributed facilities and assets.
Acknowledgments
The authors would like to thank to the Secretaría de Protección Civil of the Gobierno del Distrito Federal and to the Secretaría de Gobernación of the Federal Government of México for the financial support to build the entire system. We are very grateful to anonymous reviewers whose comments and suggestions considerably improved our original article. We also would like to acknowledge the generous participation of Ana Laura Ruiz, Rosario Delgado, Héctor Sandoval and David García-Soto for the system’s monitoring.

