


Servicios Personalizados
Revista
Articulo
 Inglés (pdf)
 Artículo en XML
 Referencias del artículo
 Enviar artículo por email
Indicadores
-
 Citado por SciELO
 -
 Accesos
Links relacionados
-
 Similares en
SciELO
Similares en
SciELO
Compartir

 Permalink
Geofísica internacional
versión On-line ISSN 2954-436Xversión impresa ISSN 0016-7169
Geofís. Intl vol.50 no.2 Ciudad de México jun. 2011
Review article
A comprehensive rock–magnetic, paleomagnetic, paleointensity and geochronologic study along the western Trans–Mexican Volcanic Belt: geodynamic and geomagnetic implications
Avto Goguitchaichvili1*, José Antonio González2, Christopher J. Pluhar3, Luis Alva–Valdivia1,2, José Rosas Elguera1,4, Vicente Carlos Ruiz–Martínez5, Jesús Solé6, Xixi Zhao7, Robert S. Coe7 and Cecilia Caballero3
1 Laboratorio Interinstitucional de Magnetismo Natural, Instituto de Geofísica, Universidad Nacional Autónoma de México, Unidad Michoacán, Campus Morelia, México. * Corresponding author: avto@geofísica.unam.mx
2 Laboratorio de Paleomagnetismo, Instituto de Geofísica Universidad Nacional Autónoma de México, Del. Coyoacán, 04510, México, D.F., México.
3 Department of Earth & Environmental Sciences, California State University, Fresno 2576 E. San Ramon Ave., Fresno, CA 93740, USA.
4 CUCEI, División de Ingenierías, Universidad de Guadalajara, México.
5 Departamento de Geofísica y Meteorología Facultad de CC Físicas, Universidad Complutense de Madrid 28040, Madrid, Spain.
6 Instituto de Geología, Universidad Nacional Autónoma de México, Del. Coyoacán, 04510, México, DF, México.
7 Department of Earth and Planetary Sciences, University of Santa Cruz California, Santa Cruz, CA 95064, USA.
Received: February 25, 2011
Accepted: March 4, 2011
Published on line: March 29, 2011
Resumen
Presentamos un estudio paleomagnético, de magnetismo de rocas geocronológico y de paleointensidad conjunto, en rocas volcánicas Miocénicas del sector oeste de la Faja Volcánica Transmexicana (FVTM). En el cual se emplearon 58 sitios compuestos por 7 a 21 unidades volcánicas de enfriamiento consecutivas de 4 secciones estratigrafías separadas. Nuestros nuevos fechamientos radiométricos sugieren que los flujos de lava de la secuencia Jesús María fueron emitidos durante un corto lapso de 11.1±0.8 a 10±0.8 Ma durante el cron de polaridad normal C5n.2n. La cercana sección de Atotonilco presenta características litológicas similares a la secuencia de Jesús María, con los 3 flujos de lava de la cima probablemente perteneciendo al cron C5n.lr. Nuestros resultados geocronológicos de la sección Funicular indican que estas lavas fueron emitidas durante un lapso más amplio, de 5.2±0.7 a 2.8±0.5 Ma. Con base en las observaciones de mineralogía magnética y de magnetismo de rocas de todas las muestras se determina que la mineralogía magnética es primaria e inalterada. Las titanomagnetitas de bajo–Ti, son resultado de la oxi–exsolución de las titanomagnetitas originales durante el enfriamiento inicial de los flujos. Los componentes estables de la magnetización se determinaron después de experimentos detallados de desmagnetización térmica y de campos alternos. Nuestros resultados combinados con los datos paleomagnéticos regionales existentes indican que las áreas de muestreo no han sufrido desplazamientos N–S, ni rotaciones de bloque significativos desde hace al menos 11 Ma. Las determinaciones de paleointensidad aceptadas son de buena calidad técnica con chequeos estándares positivos de magnetización parcial termoremanente (pTRM). Los datos de paleointensidad obtenidos van de 17.5 a 34.3 mT, sugiriendo la existencia tanto de una alta intensidad del campo geomagnético como de fluctuaciones bajas durante el Mioceno. Nuestros resultados sugieren que las rocas preservan una memoria magnética del campo geomagnético del Mioceno tardío y delimitan las reconstrucciones paleogeográficas. Los nuevos resultados paleomagnéticos contribuyen potencialmente a la reconstrucción de los modelos de evolución tectónica de la FVTM.
Palabras clave: Paleomagnetismo, magnetismo de roca, geocronología, método de Thellier, variación paleosecular, Mioceno, Faja Volcánica Trans–Mexicana.
Abstract
We present results from a comprehensive paleo–magnetic, rock magnetic, geochronologic, and paleointensity study on the Miocene volcanic rocks from the western Trans Mexican Volcanic Belt. A total of 58 sites composed of 7 to 21 consecutive volcanic cooling units from four separated stratigraphic sections have been collected. Our new radiometric dating results suggest that lava flows of the Jesus Maria sequence were erupted within a short time interval from 11.1±0.8 to 10±0.8 Ma during the C5n.2n normal polarity chron. The nearby Atotonilco section displays similar lithologic characteristics to the Jesus Maria sequence, with the top 3 lava flows probably belong to C5n.lr. Our geochronologic results from the Funicular section indicate that these lavas were formed in a longer time interval from 5.2±0.7 to 2.8±0.5 Ma. Based on rock–magnetic and microscopy observations the magnetic mineralogy of all samples is determined to be primary and unaltered Ti–poor titanomagnetites, resulting from oxy–exsolution of original titanomagnetite during the initial flow cooling. Stable components of magnetization are determined after detailed thermal and alternating–field demagnetization. Our new results combined with existing regional paleomagnetic data indicate that the sampled areas have not undergone significant N–S displacement and block rotations since at least last 11 Ma. Accepted paleointensity determinations are of good technical quality with positive standard partial thermoremanent magnetization (pTRM) checks. Obtained paleointensity data range from 17.5 to 34.3 mT, suggesting the existence of both relatively high geomagnetic field strength and low fluctuations in late Miocene. Our results suggest that the studied rocks preserve a magnetic memory of the late Miocene geomagnetic field and provide constraints for paleogeographic reconstructions. The new paleomagnetic data should help refine models for the tectonic evolution of the TMVB.
Key words: paleomagnetism, rock–magnetism, geochronology, paleointensity, Thellier paleointensity method, paleosecular variation, Miocene, Trans–Mexican Volcanic Belt.
Introduction
The Trans–Mexican Volcanic Belt (TMVB) is an E–W trending zone located between 19° and 20° N latitude, extending about 1,000 km from the Pacific Ocean to the Gulf of Mexico. TMVB is a continental magmatic arc consisting of nearly 8,000 volcanic structures and a few intrusive bodies (Gómez–Tuena et al., 2007). Some of its large strato–volcanoes such as Popocatépetl and Colima are famous worldwide for their great size, beauty, and recent volcanic activity. Less known is the fact that most volcanoes comprising the TMVB are monogenetic scoria cones. Their number has been estimated to be well above 3,000 though this remains undocumented. There is probably no other Neogene subduction–related magmatic arc in the world displaying such a large number of volcanic events, and in this respect the TMVB is unique – capable of offering a very detailed record of Earth's geomagnetic field during the Neogene as volcanic rocks are known to be reliable recorders of ancient geomagnetic field.
Despite numerous publications about its tectonic framework, stratigraphy, and paleomagnetism, the Miocene to Quaternary evolution of the TMVB is still not fully understood. In one of the truly regional paleomagnetic surveys, Ruiz Martinez et al. (2010) highlighted the need to increase drastically the number of sites to ensure the correct averaging of paleosecular variation. However, more than 80 per cent of published paleomagnetic data derives from the central and eastern parts of the TMVB, leaving the western part largely uncovered. Moreover, the database is heavily biased toward Quaternary volcanics, thus lacking in data from Miocene time. To overcome this problem, this study concentrated on the boundary area between the western and central TMVB segments, and collected paleomagnetic samples from 58 sites near Guadalajara city. Present results, accompanied by new radiometric dates, notably enhance the existing paleomagnetic dataset for the older TMVB activity.
The principal objectives of this study are: (i) to test the hypothesis and assess the timing of large–scale left–lateral displacement along the western TMVB, (ii) to establish high resolution geochronology using both magnetic polarity and radiometric dating, and (iii) to determine paleosecular variation and absolute paleointensity of the geomagnetic field recorded by TMVB basalt flows, which are fundamental constraints that are needed for recent supercomputer models of the geodynamo.
Geological Setting
The TMVB extends ~1000 km in length with an irregular width of ~80 to ~230 km. The arc follows an E–W orientation in its central and eastern sectors and a WNW–ESE trend in its western sector (Figures 1 and 2), and forms an angle of ~16° with the Middle America Trench (Gómez–Tuena et al., 2007). This peculiar geometry led to the term Trans–Mexican Volcanic Belt, because it is transversally emplaced over most of the NNW–SSE–trending Mexican geologic provinces (Ortega–Gutiérrez et al., 1994).
Subduction related volcanism in Mexico resumed during the Eocene after the Laramide orogenesis and formed the Sierra Madre Occidental silicic volcanic province (Figure 1). During early to middle Miocene the volcanic arc rotated counterclockwise and, in late Miocene, began to form the TMVB as a result subduction of the Cocos and Rivera plates (Ferrari et al., 1999). The initial stage of the TMVB was marked by widespread basaltic volcanism, emplaced from the Pacific coast to the longitude of Mexico City, north of the modern volcanic arc (Figure 1). This volcanism is characterized by plateau–like structures resulting from the coalescence of shield volcanoes and fissure–fed lava flows, with an estimated aggregate volume ranging between 3,200 to 6,800 km3 (Ferrari et al., 2000). Geologic and stratigraphic studies have shown that these basaltic lavas were emplaced during a well–defined period between 11 and 8 Ma (Ferrari et al., 1994, 1999; Moore et al., 1994; Righter et al., 1995), concurrently with the initial opening of the Gulf of California.
The TMVB is divided into three different sectors with distinct geologic and tectonic features (Demant, 1978; Pasquaré et al., 1988) (Fig. 1): a western sector that is located between the Pacific Coast and the triple junction formed by the intersection of the Zacoalco, Chapala, and Colima rifts (Allan, 1986); a central sector that is placed between this triple junction and the Taxco–San Miguel de Allende fault system (Alaniz–Álvarez et al., 2002); and an eastern sector located between these faults and the Gulf of Mexico. Previous work in the western section of the TMVB found evidence suggesting counterclockwise vertical axis rotations of Oligocene to late Miocene rocks in and around the study region (Rosas–Elguera et al., 2003). The present study seeks to test and extend this previous work.
The largest exposure of late Miocene basalts is along the Rio Grande de Santiago canyon, north of Guadalajara (Figure 2), where it has been informally named the San Cristobal basalt by Moore et al. (1994). The exposed volcanic succession is over 700 m thick and filled a preexisting depression cut into early Miocene ash–flows belonging to the Sierra Madre Occidental silicic volcanic province. East of Guadalajara, in the region known as Los Altos de Jalisco, the basalts exposed in the Rio Grande de Santiago river form a 130 km long and 60 km wide plateau, with a mean elevation of 1,900 m. In this area the basalts constitute tilted blocks partly covered by younger volcanic rocks (Rosas–Elguera and Urrutia–Fucugauchi, 1998).
Sampling
This study documents four stratigraphic sections, composed of 7 to 21 consecutive volcanic cooling units (Figure 2). Their ages range from 11.1 ± 0.8 to 2.9 ± 0.5 Ma according to radiometric dates (this study). The Funicular section (FN) near Guadalajara City (Figure 2) is composed of San Cristobal basalts (10.2 ± 0.4 Ma) at the bottom, Arcediano (5.3 ± 0.7 Ma, this study) sequence and "Megaplagioclase" basalts (about 4.8 Ma – González Rangel, 2009) in the middle part, and Guadalajara Ignimbrite (3.23 ± 0.08 Ma – Rosas Elguera et al. 1998) and Pliocene Basalts (2.9 ± 0.5 Ma, this study) at the top of the sequence. In total, we sampled 17 separate cooling units. The Agua Negra (AN) section contains 7 cooling units including San Cristobal Basalts at the bottom and pyroclastic rhyolites above capped by the San Gaspar Ignimbrite (Alva–Valdivia et al. 2005). The age of the Agua Negra section ranges from 10 to 5 Ma (González Rangel, 2009). The 200–m–thick Jesus Maria (JM) sequence is composed of twenty–one lithologically identical (independent) lava flows (each bounded by clearly–defined contacts but no paleosols or sediments between them). The lithologic similarity of these lavas suggests a very short eruption time–span. Indeed the base and top of the sequence yield statistically indistinguishable radiometric ages of 11.1 ± 0.8 Ma and 10.0 ± 0.8 Ma, respectively. The nearby Atotoniico (LN) section displays similar lithologic characteristics to JM. The total thickness of the LN section is just 100 m, comprised of thirteen consecutive lava flows (see Figures 2 and 3).
In total, we obtained 485 standard paleomag–netic drill cores belonging to 58 sites. Cores were drilled using a gasoline–powered portable drill and then oriented with a magnetic and in most cases also with a sun compass. Samples were distributed throughout each flow both horizontally and vertically. All lava flows sampled were almost horizontal (dip less than 4°). In general, samples were obtained from the finest grain–size portions of sampled units.
Radiometric Geochronology
Radiometric analyses on basalt–andesite matrix belonging to sites FN–1, FN9, JM–1, JM–16 and JM–21 were conducted at the Instituto de Geología, UNAM. Samples were obtained by crushing with steel–jaws, sieving, selection of the best fraction (300–400 μm), washing, and separation of whole rock without phenocrysts (i.e. matrix) by magnetic methods (Isodynamic Frantz separator). The K content of each sample was measured by XRF on 50 mg aliquots using a specific regression for measuring K in K–Ar samples (Solé and Enrique, 2001). Analytical precision was better than 2%. Samples weighing between 12 and 20 mg were degassed under high vacuum at ~ 150°C for twelve hours before analysis in order to reduce atmospheric contamination. Argon was extracted by complete sample fusion using a 50W CO2 laser defocused to 1–3 mm diameter. The evolved gases were mixed with a known amount of 38Ar spike and purified with a cold finger immersed in liquid nitrogen and two SAES getters in a stainless steel extraction line. Measurements were done in static mode with an MM1200B mass spectrometer using electromagnetic peak switching controlled by a Hall probe. Analytical precision on 40Ar and 38Ar peak heights was better than 0.2%, and better than 0.5% on 36Ar. The data were calibrated with internal standards and the international reference materials LP–6 and HD–B1 biotites, respectively. All ages were calculated using the constants recommended by Steiger & Jäger (1977). A detailed description of the procedure and calculations can be seen in Solé (2009). This experiment yielded a very restricted age interval for Jesus Maria section (11.1±0.8 to 10.0±0.7 Ma) while the Funicular section seems to have formed in a longer time interval from 5.2±0.7 to 2.8±0.5 Ma (Table 1).
Laboratory procedures and paleomagnetic results
A full battery of paleomagnetic, paleointensity, and rock magnetic experiments were performed for the purpose of revealing the complete record of geomagnetic behavior captured by the rocks and to assess the quality of their paleomagnetic recordings. In order to identify the magnetic carriers responsible for the remanent magnetization and to obtain information about their paleomagnetic stability, the following rock–magnetic and paleomagnetic experiments were carried out: a) measurements of the viscosity index, b) measurements of continuous thermomagnetic curves (susceptibility versus temperature), c) hysteresis experiments, d) observations under reflected light microscope and f) thermal and alternating field demagnetizations.
Viscosity index
Determination of the viscosity index (Thellier and Thellier, 1959; Prévot et al., 1983) allows estimation of the capacity of a sample to acquire a viscous remanent magnetization, and is therefore useful in assessing the paleomagnetic stability of the sample. For this purpose, we placed the samples with one of their axes aligned with Earth's magnetic field for a period of 14 days. After measuring their magnetization (Md), they were then placed for another 14 days in a field–free space, and the magnetization (M0) was measured again. This allows calculation of the viscosity index: V = [(Zd – Z0)/Mnrm ] x 100, where Zd and Z0 are respectively the magnetization components of Md and M0 which are parallel to the magnetizing field. Mnrmis the intensity of natural remanent magnetization. Two samples from each unit were subjected to these experiments and although viscosity indexes varied between 0.2% and 31.7%, most values were lower than 10 %. Generally speaking, the studied samples show a relatively low capacity of acquiring viscous remanent magnetization.
Continuous susceptibility curves
Low–field susceptibility measurements (k–T curves) were carried out in air using a Bartington susceptibility bridge equipped with furnace. One sample from each site was heated up to about 600°C at a heating rate 10°C/min and then cooled at the same rate. Curie temperature was determined by the Prévot et al (1983) method.
These experiments indicate, in most cases, the presence of Ti–poor titanomagnetites (Figure 4). However, the cooling and heating curves are not perfectly reversible, probably because of low initial value of magnetic susceptibility.
A few samples (91P390, 91P382 and 91P566) yielded evidence of two ferrimagnetic phases during heating (Figure 4a and b). The lower Curie point ranges between 350–450°C, and the highest one is about 580°C. The cooling curve shows only a single phase, with a Curie temperature close to that of magnetite. Such irreversible k–T curves can be explained by titanomaghemite, which probably transformed into magnetite during heating (Readman and O'Reilly, 1972; Özdemir, 1987). Reliable susceptibility versus temperature curves could not be obtained for some sites because the initial signal of susceptibility was smaller than instrument noise.
Hysteresis measurements
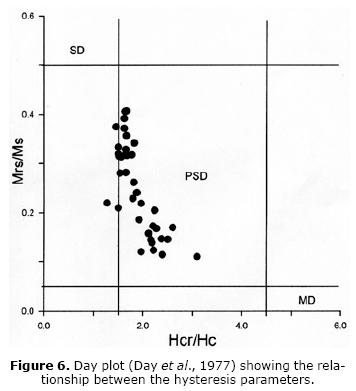
Hysteresis measurements at room temperature were performed on all studied samples using the AGFM "Micromag" apparatus of the paleomagnetic laboratory at Mexico City in fields up to 1.2 Tesla. The saturation remanent magnetization (Jrs), the saturation magnetization (Js) and coercive force (Hc) were calculated after correction for paramagnetic contributions. The coercivity of remanence (Hcr) was determined by applying progressively increasing the back–field after saturation. Typical hysteresis plots are reported in Figure 5. The curves reflect very restricted ranges of coercivity for the magnetic minerals. Judging from the ratios of hysteresis parameters (Figure 6), it seems that all samples fall in the pseudo–single domain (PSD) grain size region (Day, 1977), probably indicating a mixture of multidomain (MD) and a significant amount of single domain (SD) grains (Dunlop, 2002). Corresponding isothermal remanence (IRM) acquisition curves were also very similar for all samples. Saturation was reached in moderate fields of the order of 150–200 mT, which points to spinel–phase remanence carriers.
It is important to note that if some superparamagnetic fraction exists in these samples, the measured coercive force and saturation magnetization would be somewhat lower and larger, respectively, than those ferrimagnetic fractions alone.
Microscopy observation
Microscopic observations on polished thin sections under reflected light show that the main magnetic mineral is low–Ti titanomagnetite associated with ilmenite and hematite exsolution of trellis or composite form (Figures 7a and b, respectively), probably formed as a result of oxidation of titanomagnetite during the initial flow cooling. Other opaque minerals are divided by several relatively thin, grey, sub–parallel exolution lamellas (Figure 7c). The rest of the opaque crystals exhibit a very high reflectivity and a remarkable anisotropy which is characteristic of (titano)hematite. The exsolution features observed are typical of ilmenite or lamellar form of pseudobrookite (Haggerty, 1976).

These intergrowths typically develop at temperatures higher than 600°C (Haggerty, 1976), and consequently the natural remanent magnetization (NRM) carried by these samples should be a thermoremanent (TRM) magnetization. It should be noted that the size of the magnetic grains observed experimentally is often smaller than the petrological/optical observations of larger ferrimagnetic minerals and therefore may not be completely representative of the magnetic behavior of the whole rock.
Remanence Properties
The remanent magnetization was measured using either JR–6 spinner and/or 2G Enterprise cryogenic magnetometers. Measurements were recorded after stabilization of the remanence in these magnetometers. Progressive stepwise demagnetization experiments consisted of either alternating field (AF) demagnetization (mainly) using a custom AF–demagnetizer or stepwise thermal demagnetization up to 575–675 °C using a non–inductive Schonstedt furnace.
In most studied units, a stable primary component of paleomagnetic remanence was isolated (Figure 8). Very small secondary components were easily removed by applying 10 mT or 200–250 °C demagnetization. The majority of remanent magnetization, was removed at temperatures between 500 and 580°C, supporting the hypothesis that low–Ti titanomagnetite carries the magnetization in these rocks. The median destructive field (MDF) ranges mostly from 35 to 45 mT. Characteristic remanent magnetization (ChRM) directions were determined by the least squares method (Kirschvink, 1980), with 6 to 11 demagnetization steps being taken in the principal component analysis for this determination. Directions were averaged for each unit and the statistical parameters calculated assuming a Fi–sherian distribution (Fisher, 1953; McFadden and McElhinny, 1988).
Paleointensity determination
Absolute paleointensity experiments were performed using the Thellier method (Thellier and Thellier, 1959) in its modified form (Coe, 1967a and 1967b). Heating and cooling were made in air in a laboratory field of 30 μT. Ten temperature steps were distributed between room temperature and 560°C with several control heatings, i.e., reinvestigations of results from previous heating steps, commonly referred to as partial TRM (pTRM) checks were performed throughout the experiments.
Paleointensity experiments were performed on samples exhibiting favorable rock magnetic characteristics, based on paleodirectional and rock–magnetic experiments. Sixty–two samples, belonging to 11 cooling units, yielded dominantly stable, one–component magnetizations with blocking temperatures compatible to a Ti–poor titanomagnetite phase, low viscosity index (lower than 4%) and nearly reversible k–T curves. These samples were therefore pre–selected for Thellier paleointensity experiments.
Discussion
Nature of the characteristic remanence
Thermomagnetic investigations show that the remanence is carried in most cases by Ti–poor titanomagnetites, resulting from oxy–exsolution of original titanomagnetite during the initial flow cooling. The nature of magnetic carriers most probably indicates a thermoremanent origin for the primary magnetization. Moreover, unblocking temperature spectra and relatively high coercivities point to "small" pseudo–single domain magnetic grains as being responsible for remanent magnetization of most samples. Single–component, linear demagnetization behavior was observed in most cases. Some units seem to contain titanomaghemite as revealed by thermomagnetic analyses. It is possible that these samples carry chemical remanent magnetization. However, both experimental and theoretical studies (Heider and Dunlop, 1987; Özdemir and Dunlop, 1989; Nishitani and Kono, 1989) suggest that chemical remagnetization by maghemitization has the same direction as the original TRM. We thus consider the ChRM directions determined in this study to be of primary origin. This is also supported by the occurrence of antipodal normal and reversed polarities (see below). Consequently, paleodirections were most probably unaffected by alteration and they can be used for determining magnetic polarities and mean paleodirections.
Magnetic Stratigraphy
The average site–mean paleodirections are very precisely determined (Table 2). All α95–values are less than 10° (excepting two sites: JM13 and FN10), demonstrating small within–site dispersion and high directional stability. The Funicular section yielded the longest and most complex paleomagnetic record, exhibiting five polarity reversals during the period 10.2–2.9 Ma (see Table 2 and Figures 9 through 12) (10, 11). The four normally–magnetized lavas yielded I=32.2°, D=349.5°, k=37, a95=15.4°, N=4, while the reversed–polarity lavas give I= –27.4°, D=173.6°, k=27, a95=8.2°, N = 13. It cannot be excluded that the directions of this two populations are antipodal, taking into account their uncertainties bounds (dependent on N). Proposed correlation of Funicular–section magnetostratigraphy with the GPTS (Geomagnetic Polarity Time Scale, Cande and Kent, 1995; see also Gradstein et al. 2004) is shown in Figure 12, based on available radiometric dates and direct field observations.
The Agua Negra section, composed of San Cristobal basalts at the bottom and San Gaspar Ignimbrites at the top (both dated radiometrically – González Rangel, 2009) spans the time interval from about 10 to 4.8 Ma and exhibits 5 normal and 2 reverse polarities (Table 2 and Figures 9 through 13) (10, 11, 12) yielding 5 separate polarity zones. The section has a mean direction 1=23.3°, D=352.6°, k=26, α95=12.1°, N=7.
All twenty one consecutive basaltic lava flows belonging to the Jesus Maria sequence are normally magnetized. Some lavas, however, may belong to transitional geomagnetic regime (such as JM01, JM14, JM15, JM17). They span a relatively short time interval from 11.1±0.8 to 10±0.8 Ma according to the new radiometric dates obtained in this study (see Table 1). The radiometric ages are statistically indistinguishable at the one sigma level, but the remanence results reveal rather significant secular variation within the section. These lavas were probably erupted during C5n.2n normal polarity chron (Figure 14). The mean paleodirections obtained for JM section is 1=22.3°, D=355.1°, k=13, α95=9.4°, N=21.
The nearby Atotonilco section, which lithologically correlates with JM sections, displays transitional paleodirections (paleolatitude about 35°) at the bottom of the section (Table 2 & 3, Figures 9 through 15), followed by a normal polarity zone (C5n.2n same as for JM) consisting of seven lavas, capped by three reversely–magnetized lavas. These upper lavas probably belong to C5n.1r. Averaging all the sites from Atotonilco together, we obtained a mean direction of ChRM at 1=41.7°, D = 1.8°, k=12, α95 = 12.6°, N = 13. The relatively high dispersion is probably due to the inclusion of two apparently transitional flows in the mean ChRM calculation for this section.
Overall mean direction and paleosecular variation
Considering all unit (lava flow, ignimbrite, rhyolites) mean ChRMs obtained in this study (including transitional ChRMs), we find an overall mean direction with 1=28.6°, D=355.3°, k=15, α95=5.1°, N=58 for the studied regions. This corresponds to a mean paleomagnetic pole position at Plat=83.9N°, Plong=120.6E°, K=18, A95=4.6°. N=58. The primary nature of these mean directions is supported by a positive reversal test, i.e.; the hypothesis that normal (I=28.2°, D=357.0°, k=12, α95=6.8°. N=40) and reversed (I=–29.3°, D=171.6°, k=25, α95=9.5°, N = 18) distributions share a common geomagnetic field mean direction could not be rejected at the 95% confidence level (Figure 16). The positive reversal test is classified as "C type" (McFadden & McElhinny 1990) attending to the angle between the two mean directions yo and the critical angle yc at which the hypothesis would be rejected (γo=4.90 < γc=11.0°).
A generally accepted approach to estimate the paleosecular variation (PSV) consists of observing the angular standard deviation (ASD) of VGPs for a given locality. Several studies of dipole and non–dipole components allow prediction of the ASD characteristic of PSV with latitude (e.g., McFadden et al., 1988, 1991; Johnson et al., 2008; Opdyke et al. 2010). It is interesting to mention that Johnson et al. (2008) reported a detailed synthesis of a new generation of paleomagnetic data compilations for the last 5 Ma showing that the latitudinal dependence of VGP scatter for these data appears much less significant than previous suggested.
While abundant and well documented paleomagnetic records are available for recent periods (for instance, the last 5 Ma or so), older periods, in particular Miocene, are still poorly studied in terms of paleosecular variations of the Earth's magnetic field. This is true for Mexican lavas where most of PSV studies are concentrated on rocks from the last 1 Ma (Petronille et al. 2005, Rodriguez–Ceja et al. 2006, Goguitchaishvili et al. 2007). The classical formula S2B = S2T – S2w/n was used to estimate the geomagnetic dispersion, where, ST is the total angular dispersion or ASD, (Cox, 1969), N is the number in'the calculation, δi the angular distance of the ith VGP from the axial dipole, ST the within–site dispersion (following McElhinny and McFadden, 1997), and n the average number of samples per site. As showed by Biggin et al. (2008) the commonly–accepted calculation of the internal dispersion may be affected by some artifacts in the data. Thus, in this study, we use the Biggin et al. (2008) approach to calculate the internal dispersion, adopting the choice of cut–off angle described in Vandamme (1994), to separate paleosecular variation and intermediate geomagnetic regimes.
PSV analyses indicate that VGP dispersion values, SB, differ at each flow sequence (FN, AN, JM, LM), ranging from 7° to 28°, with variable cutoff angles varying from 17° to 56° and maximum VGP angular distances to the mean varying from 15° to 51° (Table 3). It is related to the dependence of SB on the limited number of analyzed sites and the presence of successive flows yielding statistically similar directions. The studied sequences do not seem to adequately average secular variation, as can be sometimes observed in clusters or great circle paths of consecutive VGPs. An additional test to detect potential under–representation of PSV was to analyze VGPs in stratigraphic order, following the non–parametric "Non–Random–Ordering (NRO) factor" test of Biggin et al. (2008) for identifying serial correlation. Along the whole JM section and along the same–polarity intervals from other sequences (e.g., LM4–13, FN3–8, FN14–17) the serial correlation is significant at the 95% confidence level (NRO factors greater than 0.95). However, combining all data from the four localities improves the representation of PSV. We consider that only this total combination–"ALL" (N=50) in Table 3–samples the 5–10 Ma full–polarity field broadly enough to afford a significant average of Late Miocene PSV, a conclusion that is also supported by the positive reversal test.
Using all data we obtain an initial ASD value (Figure 17a) of ST = 19.8 with SL = 13.2 and SU = 23.4 (upper and lower bootstrapped limits respectively). This result would be concordant within the uncertainty bounds with those obtained for Miocene times using data globally distributed at Mexican paleolatitudes (McFadden et al., 1991) and from the TMVB (Ruiz–Martínez et al., 2010), suggested to be relatively higher than for the Plio–Quaternary period (Lawrence et al., 2006, Johnson et al., 2008). Applying the variable cutoff given by the iterative process of Vandamme 1994 (23.2°), the geomagnetic dispersion value decreases to ST = 9.9, with SL = 8.4 and SU = 11.0 (with N=50, after rejecting sites JM17, JM15, JM14, JM01, LM13, LM12, LM11 and AN1, and maximum VGP distance to the mean of 19.2°). This decreased value does not match with those previously obtained in Miocene times, but is also slightly lower than the dispersion expected during the last 5 Ma (Figure 17b, Johnson et al., 2008).
If a fixed, 45° cutoff angle is taken, "ALL" distribution results are the same for PSV (and tectonic) purposes (N=54, Dec=353.6°, Inc=25.8°, k=22, a95=4.2°; displaying a ST mean value only 0.1° distant of that obtained using the cutoff value in Vandamme 1994).
Tectonic Implications
Vertical–axis rotation R and flattening of inclination F values (with their corresponding confidence limits following Demarest, 1983) have been determined. Averaged altogether, these directions are in excellent agreement with the expected paleodirections for the late Miocene time (Figure 16), as derived from reference poles for North America centered at Ma given by Besse and Courtillot (2002) (N= 21, PLat= 84.6N°, PLong= 164.4E°, 10 A95= 3.1 °) and Torsvik et al. (2008) (N= 30, PLat= 87.2N°, PLong= 138.4E°, A95 = 2.5 °). In both cases,  and is always lower that its uncertainty (~5°).
The significance of these tectonic implications is not affected whether or not a variable cutoff (Vandamme 1994) is applied to discard directions related to intermediate geomagnetic field regimes. After rejecting 8 directions, this iterative method increases the grouping and antipodal nature of normal (1=27.8°, D=353.3°, k=63, α95=3.2°. N=33) and reversed (I=–30.1°, D=173.4°, k=30, α95=6.6°, N = 17) distributions, which display a better quality reversal test ("type B", γo=2.3° < γc=6.4°). Comparing with the above mentioned reference directions, the amounts of vertical–axis rotations  are of the same order as their uncertainties.
The absence of appreciable vertical–axis rotations is graphically shown in Figure 16, where virtual geomagnetic poles (VGPs) from this study and their average mean pole are shown. The 10 Ma reference poles are located in the paleo–meridian defined by the sampling area and the mean paleopole obtained in this study. It should be noted that three of the four studied sections contain flows erupted during late Miocene times, whereas only the Funicular section includes younger flows. The Pliocene pole given by Besse and Courtillot (2002) (PLat= 86.IN°, PLong= 174.8E°, A95= 2.6 °) is not plotted for clarity because it is also indistinguishable from this study. In addition, it can be observed that the mean paleopole obtained by this study falls on the far side of the reference poles for North America (positive inclination flattening F values of ~6–8° and slightly higher than their uncertainties), in agreement with the so–called far–sided effect first noticed by Wilson.
Thus, our results suggest that no major block rotation is observed in the studied area since about 11 Ma, in contrast to the left–lateral transtension and extensional faulting proposed for the TMVB during this period (Rosas–Elguera et al., 2003). Rosas–Elguera et al. (2003) studied rocks spanning 31.6–8.36 Ma, substantially older than the rocks of the current study. Several authors have suggested that during this period the TMVB to the east of Guadalajara city experienced left–lateral transtensional tectonics (Pasquaré et al., 1991; Garduño et al., 1993; Ferrari et al., 1994, 2000; Urrutia–Fugugauchi and Rosas–Elguera, 1994). However, due to the poor behavior of basaltic rock in recording slickensides on fault planes, left–lateral oblique faulting has been directly observed only at a small number of sites. The interpretation of concordant paleomagnetic directions then suggests that the Late Miocene strike–slip faulting, documented along the western sector of the TMVB, could affect the region only before the emplacement of the early mafic volcanic succession of the area.
Our results are concordant with previous paleomagnetic observations reported (Alva–Valdivia et al., 2000; Goguitchaichvili et al., 2002; Ruiz.Martínez et al., 2010) in the same late Miocene basaltic plateau around Guadalajara area. When all data are analyzed and compared with the same, recent available reference poles, as discussed in Ruiz.Martínez et al. (2010), adequate secular variation averaging demonstrates no significant rotation in the study area during the last ~10 Ma.
Absolute Paleointensity
Paleointensity data are reported on the classical Arai–Nagata plot In Figure 18 and results are given in Table 4. We accepted only determinations that fulfill the following criteria: (1) determination obtained from at least 6 NRM (natural remanent magnetization) –TRM (thermoremanent magnetization) points corresponding to an NRM fraction larger than 1/3 (Table 4), (2) quality factor (Coe et al., 1978) of about 5 or more, and (3) positive ' pTRM' checks, i.e., the deviation of ' pTRM' checks were less than 15%. Directions of NRM remaining at each step obtained from the paleointensity experiments are reasonably linear and point to the origin. No deviation of remaining NRM directions towards the direction of the applied laboratory field was observed.
Application of these quality criteria left only 22 samples from 5 individual basaltic lava flows yielding acceptable paleointensity estimates (Figure 18, sample 91P039A and 91P076A). For these samples the NRM fraction f used for determination ranges between 0.29 to 0.87 and the quality factor q from 4.6 to 30.5. For rejected samples, the main reason for failure of Thellier paleointensity experiments (sample 91P147A) was a typical 'concave–up' behavior (Dunlop and Özdemir, 1997). An important loss of NRM was observed without any noticeable TRM acquisition.
For the acceptable paleointensity estimates, the site–mean paleointensities range from 17.5 to 34.3 μT. The VDMs range from 4.3 to 7.6 x 10²² Am2. This corresponds to a mean value of 5.6 ± 1.4 x 10²² Am2, which is compatible to the average VDM value for the late Miocene (Goguitchaichvili et al., 2000). In general, our data suggest the existence of relatively high geomagnetic field strength undergoing some relatively low fluctuations. These results support Love's (2000) suggestion about inverse relationship between secular variation and local field strength as result of electromagnetic coupling between the solid inner core and liquid outer core, with the inner core tending to stabilize core convection, and hence the field, when intensity is high.
Directional analysis and absolute paleointensity of the geomagnetic field recorded by these TMVB basalt flows contributes to extend Time Averaged Field and PSV studies and constraints up to ~12 Ma.
Conclusions
We have carried out a comprehensive paleo–magnetic, rock magnetic, geochronologic, and paleointensity study on the Miocene volcanic rocks from the Guadalajara area of TMVB. Our conclusions can be summarized as follows:
1. Based on rock–magnetic and microscopy observations the magnetic mineralogy of all samples is determined to be primary and unaltered Ti–poor titanomagnetites, resulting from oxy–exsolution of original titanomagnetite during the initial flow cooling.
2. Our new radiometric dating results suggest that lava flows of Jesus Maria sequence were erupted within a short time interval from 11.1±0.8 to 10±0.8 Ma during C5n.2n normal polarity chron. The nearby Atotonilco section displays similar lithologic characteristics to Jesus Maria sequence, with the top 3 lava flows probably belong to C5n.lr. Our geochronologic results from the Funicular section indicate that these lavas were formed in relatively large time interval from 5.2±0.7 to 2.8±0.5 Ma.
3. The studied rocks preserve a magnetic memory of the late Miocene geomagnetic field and provide constraints for paleogeographic reconstructions. Stable components of magnetization are determined after detailed thermal and alternating–field demagnetization. Our new results combined with existing regional paleomagnetic data indicate that the sampled areas have not undergone significant N–S displacement and block rotations since at least last 11 Ma. These paleomagnetic data should help refine models for the tectonic evolution of the TMVB.
4. Our paleointensity data range from 17.5 to 34.3 mT, with virtual axial dipole moments (VDMs) of 4.3 to 7.6 x 10²² Am2. These data suggest the existence of both relatively high geomagnetic field strength undergoing some relatively low fluctuations in late Miocene.
Acknowledgements
Discussions with our many colleagues have been most stimulating and helpful. This work was sponsored by a UCMEXUS–CONACYT collaborative grant to AG and RSC, and partially supported by CONACiT No. 54957, National Science Foundation of China Grant 40974035, and U.S. National Science Fundation Grants EAR–0633891 and EAR–0911331. This article is contribution no. 509 of the Paleomagnetism Laboratory and Center for the Study of Imaging and Dynamics of the Earth (Institute of Geophysics and Planetary Physics, University of California, Santa Cruz).
Bibliography
Alaniz–Álvarez S., Nieto–Samaniego A., Moran–Zenteno D., Alba–Aldave J., 2002, Ryolitic volcanism in extenssion zone associated with strike–slip tectonics in the Taxco región, southern Mexico, J. Volcan. Geotherm. Res., 118, 1–14. [ Links ]
Allan J.F., 1986, Geology of the northern Colima and Zacoalco grabens, southwest Mexico: Late Cenozoic rifting in the Mexican volcanic belt. Geol. Soc. Am. Bull., 97, 473–485. [ Links ]
Alva–Valdivia L.M., Goguitchaichvili A., Ferrari L., Rosas–Elguera J., Urrutia–Fucugauchi J., Zamorano–Orozco J.J., 2000, Paleomagnetic data from the Trans–Mexican volcanic belt: implications for tectonics and volcanic stratigraphy, Earth Planets Space, 52, 467–478. [ Links ]
Alva–Valdivia L.M., Rosas–Elguera J., Bravo–Medina T., Urrutia–Fucugauchi J., Henry B., Caballero C., Rivas–Sanchez M.L., Goguitchaichvili A., López–Loera H., 2005, Paleomagnetic and magnetic fabric studies of the San Gaspar ignimbrite, western Mexicoâconstraints on emplacement mode and source vents. J. Vole. Geother. Res., 147, (1–2), 68–80. [ Links ]
Besse J., Courtillot V., 1991, Revised and synthetic apparent polar wander paths of the African, Eurasian, North American and Indian Plates, and true polar wander since 200 Ma, J. Geophys. Res., 96, 4029–4050. [ Links ]
Besse J., Courtillot V., 2002. Apparent and true polar wander and the Geometry of the magnetic Field in the last 200 Million Years, J. Geophys. Res., 107, B11, 2300, doi: 10.1029/2000JB000050. [ Links ]
Biggin A.J., Van Hinsbergen D.J.J., Langereis C.G., Straathof G.B., Deenen M.H.L., 2008, Geomagnetic secular variation in the Cretaceous Normal Superchron and in the Jurassic. Phys. Earth Planet. Inter., 169, 3–19, doi:10.1016/j.pepi.2008.07.004. [ Links ]
Cande S.C., Kent D.V., 1995, Revised calibration of the geomagnetic polarity timescale for the Late Cretaceous and Cenozoic. J. Geophys. Res., 100(B4), 6093–6095, doi: 10.1029/94JB03098. [ Links ]
Coe R.S., 1967a, Paleo–intensities of the earth's magnetic field determined from Tertiary and Quaternary rocks, J. Geophys. Res., 72, 3,247–3,272. [ Links ]
Coe R.S., 1967b, The determination of paleo–intensities of the earth's magnetic field with emphasis on mechanisms which could cause non–ideal behavior in Thelliers' method, J. Geomag. Geoelect., 19, 157–179. [ Links ]
Coe R.S., Grommé C.S., Mankinen E.A., 1978, Geomagnetic paleointensities by the Thelliers' method from radiocarbon dated lava flows on Hawaii: The Pacific non–dipole low, J. Geophys. Res., 83, 1740–1756. [ Links ]
Coe R.S., Grommé C.S., Mankinen E.A., 1984, Geomagnetic paleointensities of basalts from excursion sequences in lavas on Oahu, Hawaii, J. Geophys. Res., 89, 1,059–1,069. [ Links ]
Coe R.S., Globerman B.R., Plumley P.W., Thrupp G.A., 1985, Paleomagnetic results from Alaska and their tectonic implications, in Howell, D.G., ed., Tectonostratigraphic terranes of the Circum–Pacific region, Amer. Assoc. Petrol. Geol., Circum–Pacific Council for Energy and Mineral Resources Series, 1, 85–108. [ Links ]
Coe R.S., Globerman B.R., Thrupp G.A., 1988, Rotation of central and southern Alaska in the early Tertiary: Oroclinal bending by megakinking?, in Kissel, C, and C. Laj, eds., Paleomagnetic rotation and continental deformation: NATO Advanced Studies Institute Series, Reidel, Series C, 254, 327–342. [ Links ]
Coe R.S., Hongre L., Glatzmaier G.A., 2000, An examination of simulated geomagnetic reversals from a paleomagnetic perspective, Phil. Trans. Roy. Soc. London, Series A, 358, 1768, 1,141–11701. [ Links ]
Cox A., 1969, Confidence limits for the precision parameter k, Geophys. J. R. Astron. Soc, 18, 545–549. [ Links ]
Day R., Fuller M.D., Schmidt V.A., 1977, Hysteresis properties of titanomagnetites: grain size and composition dependence, Phys. Earth Planet. Int., 13, 260–266. [ Links ]
Demant A., 1978, Características del Eje Neovol–cánico Transmexicano y sus problemas de interpretación, Rev. Inst. Geología, 5, 217–222. [ Links ]
Demarest H.H., 1983, Error analysis for the determination of tectonic rotation from paleomagnetic data, J. Geophys. Res., 88, 4,321–4,328. [ Links ]
Dunlop J., 2002, Theory and application of the Day plot (Mrs/Ms versus Hcr/Hc). 1. Theoretical curves and tests using titanomagnetite data, J. Geophys. Res., 107, B3, doi: 10.1029/2001JB000486. EPM 4.1–4.22. [ Links ]
Dunlop D., Özdemir Ö., 1997, Rock–Magnetism, fundamentals and frontiers, Cambrige University Press, 573 pp. [ Links ]
Ferrari L., Garduño V.H., Innocenti F., Manetti P., Pasquarè G., Vaggelli G., 1994, A widespread mafic volcanic unit at the base of the Mexican Volcanic Belt between Guadalajara and Queretaro. Geofísica Internacional, 33, 107–124. [ Links ]
Ferrari L., López–Martínez M., Aguirre–Díaz G., Carrasco–Nuñez G., 1999. Space–time patterns of Cenozoic arc volcanism in central Mexico: from the Sierra Madre Occidental to the Mexican Volcanic Belt. Geology, 27, 303–306. [ Links ]
Ferrari L., Conticelli S., Vaggelli C., Petrone C., 2000, And Manetti P., Late Miocene mafic volcanism and intra–arc tectonics during the early development of the Trans–Mexican Volcanic Belt. Tectonophysics, 318 (1–4), pp. 161–185. [ Links ]
Ferrari, L., V.H. Garduño, F. Innocenti, P. Manetti, G. Pasquarè, and G. Vaggelli, 1994, A widespread mafic volcanic unit at the base of the Mexican Volcanic Belt between Guadalajara and Queretaro. Geofìsica Internacional, 33, 107–124. [ Links ]
Fisher R.A., Dispersion on a sphere, Proc. Roy. Soc. London, Ser. A, 217, 295–305. [ Links ]
Garduño V.H., Spinnler J., Ceragioli E., 1993. Geological and structural study of the Chapala Rift, state of Jalisco, Mexico. Geofísica Internacional, 32, 487–499, 1953. [ Links ]
Gilder S.A., Coe R.S., Wu H.R., Kuang G.D., Zhao X., Wu Q., 1995, Triassic paleomagnetic data south China and their bearing on the tectonic evolution of the western circum–Pacific region, Earth Planet. Sci. Lett, 131, 269–287. [ Links ]
Glatzmaier, G.A., Coe R.S., Hongre L., Roberts P.H., 1999. The role of the Earth's mantle in controlling the frequency of geomagnetic reversals, Nature, 401, 885–890. [ Links ]
Gradstein F.M., Ogg J.G., Smith A.G., Bleeker W., Lourens L.J., 2004, A new Geologic Time Scale, with special reference to Precambrian and Neogene. Episodes 27 (2), pp. 83–100. [ Links ]
Goguitchaichvili A., Prévot M., Camps P., 1999, No evidence for strong fields during the R3–N3 Icelandic geomagnetic reversals. Earth Planet. Sci. Lett, 167, 15–34. [ Links ]
Goguitchaichvili A., Chauvin A., Roperch P., Prévot M., Vergara M., Moreno H., 2000, Paleomagnetism of the Miocene Farelonnes Formation in Chile. Geoph. J. Int., 140, 2, 140, 357–374. [ Links ]
Goguitchaichvili A., Alva–Valdivia L.M., Rosas–Elguera J., Urrutia–Fucugauchi J., González J.A., Morales J., Solé J., 2002, An integrated paleomagnetic study of Rio Grande de Santiago volcanic succession (trans–Mexican volcanic belt): revisited, Phys. Earth Planet. Inter., 130, 175–194. [ Links ]
Goguitchaichvili A., Petronille M., Henry B., Alva–Valdivia L.M., Morales J., Urrutia–Fucugauchi J., 2007, Paleomagnetism of the Eastern Alkaline Province (Mexico): Contribution to the time–averaged field global database and geomagnetic instability time scale, Earth, Plan. Spa., 59, 7, 775–783. [ Links ]
Gómez–Tuena A., Orozco–Esquivel M.T., Ferrari L., 2007, Igneous petrogenesis of the Trans–Mexican Volcanic Belt, Geol. Soc. Am. Spec. Pap., 422, 129–181. [ Links ]
González Rangel J.A., 2009, Paleomagnetismo de la porcion occidental de la faja volcanica transmexicana: implicaciones tectónicas y estratigráficas, Master Thesis, Universidad Nacional Autónoma de Mexico, 115 pp. [ Links ]
Haggerty S.E., 1976, Oxidation of opaque mineral oxides in basalts. In: Oxide Minerals, Mineral. Soc. Amer., 3, 300 pp. [ Links ]
Heider F., Dunlop D.J., 1987, Two types of chemical remanent magnetization during oxidation of magnetite, Phys. Earth Planet. Int., 46, 24–45. [ Links ]
Johnson C.L., Constable C.G., Tauxe L., Barendregt R., Brown L.L., Coe R.S., Layer P., Mejia V., Opdyke N.D., Singer B.S., Staudigel H., Stone D.B., 2008, Recent investigations of the 0–5 Ma geomagnetic field recorded by lava flows, Geochem. Geophys. Geosyst., 9, Q04032, doi:10.1029/2007GC001696. [ Links ]
Juarez M.T., Tauxe L., Gee J.S., Pick T., 1998, The intensity of the Earth's magnetic field over the past 160 million years, Nature, 394, 878–881. [ Links ]
Kirschvink J.L., 1980, The least–square line and plane and the analysis of paleomagnetic data. Geophys. J. Roy. Astron. Soc, 62, 699–718. [ Links ]
Lawrence K.P., Constable C.G., Johnson C.L., 2006, Paleosecular variation and the average geomagnetic field at ±20° latitude, Geochem. Geophys. Geosyst., 7, Q07007, doi: 10.1029/2005GC001181. [ Links ]
Love J.J., 2000, Palaeomagnetic secular variation as a function of intensity. Philosophical Transactions of the Royal Society A: Math. Phys. Engin. Scien. 358 (1768), pp. 1,191–1,223. [ Links ]
McElhinny M.W., McFadden P.L., 1997, Palaeosecular variation over the past 5 Myr based on a new generalized database, Geophys. J. Int., 131, 240–252. [ Links ]
Márquez A., Oyarzun R., Doblas M., Verma S.P., 1999, Alkalic (OIB type) and calcalkalic volcanism in the Mexican Volcanic Belt: a case for plume–related magmatism and propagating rifting at an active margin? Geology, 27, 51–54. [ Links ]
McFadden P.L., McElhinny M.W., 1988, The combined analysis of remagnetization circles and direct observations in paleomagnetism, Earth Planet. Sci. Lett., 87, 161–172. [ Links ]
McFadden P.L., McElhinny M.W.,1990,Classification of the reversal test in Palaeomagnetism, Geophys. J. Int., 103, 725–729. [ Links ]
McFadden P.L., Merrill R.T., McElhinny M.W., 1988, Dipole/quadrupole family modeling of paleosecular variation, J. Geophys. Res., 93, 11,583–11,588. [ Links ]
McFadden P.L., Merrill R.T., McEllhinny M.W., Lee S., 1991, Reversals of the Earth's magnetic field and temporal variations of the dynamo families, J. Geophys. Res., 96, 3,923–3,933. [ Links ]
Merrill R.T., McElhinny M.W., McFadden P.L., 1996, The Magnetic Field of the Earth: Paleomagnetism, the Core, and the Deep Mantle. Academic Press, 527 p. [ Links ]
Moore G., Marone C., Carmichael I.S.E., Renne P., 1994, Basaltic volcanism and extension near the intersection of the Sierra Madre volcanic province and the Mexican Volcanic Belt. Geol. Soc. Am. Bulletin, 106, 383–394. [ Links ]
Nieto–Obregón J., Delgado–Argote L., Damon P.E., 1985, Geochronologic, petrologic and structural data related to large morphologic features between the Sierra Madre Occidental and the Mexican Volcanic Belt. Geofísica Internacional, 24, 623–663. [ Links ]
Nishitani T, Kono M., 1989, Effects of low–temperature oxidation on the remanence properties of titanomagnetites, J. Geomag. Geoelec, 41, 19–38. [ Links ]
Ortega–Gutiérrez F., Sedlock R.L., Speed R.C., 1994, Phanerozoic tectonic evolution of Mexico, en Speed, R.C. (ed.), Boulder, CO, Geological Society of America, DNAG Continent–Ocean Transec Series, 265–305. [ Links ]
Opdyke N.D., Kent D., Huang K., Foster D., Patel J.P., 2010, Equatorial paleomagnetic time–averaged field results from 0–5 Ma lavas and latitudinal variation of angular dispersion, Geochem. Geophys. Geosys., doi: 10.1029/2009GC002863. [ Links ]
Osete M.L., 2000, Southward Migration of Continental Volcanic Activity in the Sierra de Las Cruces, Mexico: Palaeomagnetic and Radiometric evidence, In press in Tectonophysics. [ Links ]
Özdemir Ö., 1987, Inversion of titanomaghemites, Phys. Earth Planet. Inter., 65, 125–136. [ Links ]
Özdemir Ö., Dunlop D.J., 1989, Chemico–viscous remanent magnetization in Fe3O4 – gFe2O3 system, Science, 243, 1,043–1,047. [ Links ]
Pasquaré G., Garduno V.H., Tibaldi A., Ferrari M., 1988, Stress pattern evolution in the central sector of the Mexican Volcanic Belt. Tectonophysics, 146 (1–4), pp. 353–364. [ Links ]
Pasquaré G., Ferrari L., Garduño V.H., Tibaldi A., Vezzoli L., 1991, Geology of the central sector of Mexican Volcanic Belt, States of Guanajuato and Michoacan. Geol. Soc. Am., Map and Chart series, MCH 072, 22 p. [ Links ]
Perrin M., Shcherbakov V.P., 1997, Paleointensity of the earth magnetic field for the past 400 My: evidence for a dipole structure during the Mesozoic low. J. Geomag. Geolectr., 49, 601–614. [ Links ]
Petronille M., Goguitchaichvili A., Henry B., Alva–Valdivia L.M., Rosas–Elguera J., Urrutia–Fucugauchi J., Rodríguez Cejá M., Calvo–Rathert M., 2005, Paleomagnetism of Ar–Ar dated lava flows from the Ceboruco–San Pedro volcanic field (western Mexico): Evidence for the Matuyama–Brunhes transition precursor and a fully reversed geomagnetic event in the Brunhes chron. J. Geophys. Res., 110, B08101, doi:10.1029/2004JB003321. [ Links ]
Prévot M., Mainkinen E.A., GromméS., Lecaille A., 1983, High paleointensity of the geomagnetic field from thermomagnetic studies on rift valley pillow basalts from the middle Atlantic ridge. J. Geoph. Res., 88, 2,316–2,326. [ Links ]
Prévot M., Mainkinen R.S., Coe R.S., Grommé S., 1985, The Steens Mountain (Oregon) geomagnetic polarity transition 2. Field intensity variations and discussion of reversal models, J. Geophys. Res., 90, 10,417–10,448. [ Links ]
Readman P.W., O'Reilly W., 1972, Magnetic properties of oxidized (cation–deficient) titanomagnetites, (Fe,Ti,?)O4. J. Geomag. Geoelec, 24, 69–90. [ Links ]
Righter K., Carmichael I.S.E., Becker T., 1995, Pliocene–Quaternary volcanism and faulting at the intersection of the Gulf of California and the Mexican Volcanic Belt. Geol. Soc. Am. Bull., 107, 612–626. [ Links ]
Rodríguez–Ceja M.R., Goguitchaichvili A., Calvo–Rathert M., Morales–Contreras J., Alva–Valdivia L., Elguera J.R., Urrutia–Fucugauchi J., Granados H.D., 2006, Paleomagnetism of the Pleistocene Tequila volcanic field (Western Mexico). Earth, Plan. Space, 58, 10, pp. 1,349–1,358. [ Links ]
Rosas–Elguera J., Urrutia–Fucugauchi J., 1998, Tectonic control on the volcano–sedimentary sequence of the Chapala graben, western Mexico. Int. Geolo. Rev., 40, 350–362. [ Links ]
Rosas–Elguera J., Alva–Valdivia L.M., Goguitchaichvili A., Urrutia–Fucugauchi J., Ortega–Rivera M.A., Salinas Prieto J.C., Lee J.K.W., 2003, Counterclockwise rotation of the Michoacan block: Implications for the tectonics of Western Mexico. Int. Geolo. Rev. 45, 9, pp. 814–826. [ Links ]
Ruiz–Martínez V.C., Urrutia–Fucugauchi J., Osete M.L., 2010, Palaeomagnetism of the western and central sectors of the Trans–Mexican volcanic belt – implications for tectonic rotations and palaeosecular variation in the past 11 Ma. Geophys. J. Int., 180 (2), pp. 577–595. [ Links ]
Solé J.E., 2001, P X–ray fluorescence analysis for the determination of potassium in small quantities of silicate minerals for K–Ar dating. Analytica Chimica Acta, 440:199–205. [ Links ]
Solé J., 2009, Determination of K–Ar ages in milligram samples using an infrared laser for argon extraction. Rapid Communications in Mass Spectrometry 23:3,579–3,590. [ Links ]
Steiger R.H., Jäger E., 1977, Subcommission on geochronology: convention on the use of decay constants in geo– and cosmochronology: Earth Planet. Sci. Lett., 36, 359–362. [ Links ]
Tanaka H., Kono M., Ushimura H., 1995, Some global features of paleointensity in geological time. Geoph. J. Int., 120, 97–102. [ Links ]
Thellier E., Thellier O., 1959, Sur l'intensité du champ magnétique terrestre dans le passé historique et géologique. Ann. Géophysique. 15, 285–376. [ Links ]
Torsvik T.H., Müller R.D.,Vander Voo R., Steinberger B., Gaina C., 2008, Global plate motion frames: Toward a unified model, Rev. Geophys., 46, RG3004, doi: 10.1029/2007RG000227. [ Links ]
Urrutia–Fucugauchi J., Rosas–Elguera J., 1994, Paleomagnetic study of the eastern sector of Chápala Lake and implications for the tectonics of west–central Mexico. Tectonophysics, 239, 61–71. [ Links ]
Valet, J.–P., Meynadier L., 1993, Geomagnetic field intensity and reversals during the past four million years. Nature 366, 234–238. [ Links ]
Vandamme D.A., 1994. New method to determine paleosecular variation, Phys. Earth Planet. Int., 85, 131–142. [ Links ]
Weiler P.D., Coe R.S., 1997, Paleomagnetic evidence for rapid vertical–axis rotations during thrusting in an active collision zone, northeastern Papua New Guinea, Tectonics, 16, 537–550. [ Links ]
Wells R.E., Coe R.S., 1985, Paleomagnetism and geology of Eocene volcanic rocks of SW Washington: implications for mechanisms of tectonic rotation, J. Geophys. Res., 90, 1,925–1,947. [ Links ]
Zhao X., Coe R.S., 1987, Paleomagnetic constraints on collision and rotation of North and South China, Nature, 327, 141–144. [ Links ]
Zhao X., Coe R.S., Gilder S.A., Frost G.M., 1996, Paleomagnetic constraints on the paleogeography China: implications for Gondwanaland, in Li, Z. and C. McA. Powell, eds., Breakup of Rodina and Gondwanaland and assembly of Asia, Austral. J. Earth Sci., 43, 643–672. [ Links ]

