1. Introduction
Corrosion of reinforced concrete structures (RCS) is reflected in the compressive strength loss of the material, as well as in the internal stress generated by steel corrosion products formation, which is unable to be supported by a limited concrete plastic deformation and leads to cracking (Taylor, 1990). Nowadays, concrete made with Portland cement is the manufactured material most extensively used by humans, and according to international tendencies, its future is increasingly more important and significant (O Reilly, 2007).
Regarding rebar concrete corrosion, it must be emphasized the materials quality, the aggregate proportions, the constructive practice, coating thickness, water/cement (w/c) ratio, that can improve or diminish the concrete protection degree against external agents. It has to be clarified that concrete mix manufactured with Portland cement provides an adequate corrosion protection to embedded metallic materials (Hostalet Alba, 1994). This is due to the high resistivity barrier effect protecting the rebar structure from aggressive external agents and the development of a passive film over the steel surface from concrete alkalinity, maintaining protection for an infinite time, in principle. Nevertheless, steel corrosion is the main damage cause and then early failure of rebar concrete.
In marine environments, the main cause of corrosion in concrete reinforcing steel (CRS) has been identified as the chloride ions attack, which induce depassivation of the steel. These ions, when combined with water and oxygen, induce localized attack that can reduce the cross-section of the working steel. At this point, not only the economic losses caused by corrosion must be taken into account, but also losses of human lives due to structure collapse and accidents caused by failures, when strain and stresses are no longer supported by them (Pech-Canul and Castro, 2002). Similarly, modifications in concrete and metallic elements through the use of polymeric materials and coatings have been investigated for the last four decades with mixed results (Dodson, 1990).
On the other hand, the exploitation of waste and refuse to obtain high value aggregate products constitute the road to a sustainable economy. At present in the area of bio-materials science, scientists are focused on the study of chitin and chitosan among others due to their high potential applications (Anandhavelu et. al., 2017; Pakdel and Peighambardoust, 2018). Chitin is a bio-polymer present in the exoskeletons of arthropods such as: lobsters, crabs, shrimps; insects and in cellular walls of diatoms and other algae and mushrooms acting as cell reinforcements. By itself, this material is not toxic and relatively easy to degrade, so its application is environmentally acceptable (Dima and Zaritzky, 2019). It is the second most important bio-polymer in our planet (only after cellulose) and is a polysaccharide containing acetamide functional groups. Commercial chitin is obtained mainly from crustaceous exoskeletons (Gacén and Gacén, 1996).
When these groups are eliminated from chitin by the process known as deacetylation, chitosan is obtained being also a bio-polymer with a regular distribution of amine groups (Hernández Cocoletzi et. al., 2009). Chitosan presents excellent properties such as: antifungal, antiviral, antimicrobial, bio-compatibility, bio-degradability, non-toxic, emulsifier, grease and metal contamination absorbent among others, and make it considered of great application in different fields (Dima and Zaritzky, 2019). From its interesting physico-chemical, structural and functional properties, it becomes an adequate candidate for the anti-corrosion coatings development in particular due to its character as the film, bonding capacity on metallic surfaces and the possibility to form chemical complexes (Anandhavelu et. al., 2017).
Chitosan, being a partially deacetylated product of chitin, is a linear copolymer of β-(1-4)-2-amido-2-deoxy-D-glucan (glucosamine) and β-(1-4)-2-acetamido-deoxy-D-glucan (N-acetylglucosamine) (Carneiro et. al., 2013; Carneiro et. al., 2015; Bezerra, 2016), presenting a three-dimensional helical configuration stabilized through hydrogen couples amongst formed monomers (Sousa Andrade et. al., 2003). Due to its functional characteristics (Knorr, 1991; Ashassi-Sorkhabi and Kazempour, 2020), chitin and chitosan are excellent candidates as aggregates in concrete mixtures and as a coating for reinforcing steel (RS) to avoid or diminish the corrosion and resulting products in the RC (Dodson and Hayden, 1989). Shrimp waste, which is generally responsible for an environmental problem, could become a solution for corrosion problems in structures (Martínez-Barrera et. al., 2005; Pacheco, 2010; Castelló et. al., 2019).
It has been searched the development of a method by which, improving the mechanical properties of concrete, it is possible to control and reduce the corrosion of RC, in comparison with conventional hydraulic concrete (Martínez-Barrera et. al., 2005).
In this work, the effectiveness and behavior of shrimp exoskeleton aggregate, chitin and chitosan as aggregates within the matrix were studied to evaluate the compressive strength of 5 cm x 5 cm x 5 cm mortar cubes. Chitosan coatings on encapsulated electrodes were evaluated to determine the optimal amount and the number of layers with the best performance in a solution with calcium hydroxide and calcium chloride. The best coating was applied on the steel rods embedded in concrete samples of 10 cm x 7 cm x 10 cm. The above, to analyze the electrochemical behavior of RC over time, exposed to a 3% sodium chloride solution.
2. Experimental procedure
2.1 Materials.
The concrete quality is highly dependent on the paste quality in a properly crafted concrete. For this research work the used materials for the elaboration of mixtures comply with the standard (ASTM C33, 2003). Ordinary Portland cement CPO 20R (Cemex), crushed stone sand (passes mesh # 4) and gravel from the region with a maximum size of 3/4" were used. The water/cement ratio was 0.5 both the mortar samples and the concrete samples. The steel formed by corrugated rods presented a diameter of 3/8 ", grade 42 with resistance of 4,200 kg/cm2.
In the case of aggregates, exoskeletons were collected from shrimp industry waste, which represents millions tons of garbage worldwide (Hernández Cocoletzi et. al., 2009). Chitin and chitosan were acquired at the Universidad Autónoma Metropolitana, and also from dried shrimp waste.
The meshes used in the materials classification are from GRUPO FIICSA. For the study, the entire shrimp exoskeleton retained in the mesh # 4, the ground exoskeleton retained in the mesh # 30, the fiber exoskeleton retained in the mesh # 8, the chitin retained in the mesh # 8, the reagent grade chitin retained on mesh # 100 and chitosan retained on mesh # 30 were used.
2.2 Processing and synthesis of the different aggregates.
2.2.1 Shrimp exoskeleton as a solid aggregate.
Once the shrimp exoskeleton was obtained to be used as an aggregate, it was previously washed with distilled water and dehydrated in an electric oven at 200° C for 30 min. The ground exoskeleton with the desired particle sizes was obtained in a mill from the dry aggregate. Likewise, the aggregate was cut in fibers form to analyze whether the geometry had any effect on the mechanical properties of the composite material. In this way, three different geometries were processed, entire, ground and fibers exoskeleton. Chitin, reagent grade chitin and chitosan were used in the same presentation in which they were purchased.
2.2.2 Synthesis of aggregates for coating.
Several procedures were carried out for the different coating’s extraction from the aggregate base material (shrimp exoskeleton, chitin and chitosan). The shrimp exoskeleton was tried to dissolve using acids, ketones and other products without any success, for which the use of the exoskeleton was discarded as an inhibitor or coating.
For the chitin and chitosan, the proposal reported in the literature was taken as a reference (Shrinivas Rao et. al., 2007). The percentage of soluble chitin was calculated by dissolving 0.1 g of chitin in 25 ml of a solution of N, N-dimethylacetamide (DMAc) with 5 % lithium chloride for 72 h, with constant stirring at room temperature and applying heat sporadically with a hot air gun (Shrinivas Rao et. al., 2007). In the case of chitin, the use of lithium chloride makes this coating unsuitable to be used, since a fundamental part of this work has been to generate products that are environmentally friendly, so the idea was discarded.
The soluble chitosan percentage was calculated by dissolving 0.1 g in 25 ml of a solution of glacial acetic acid AE2E3 (0.1M Sigma-Aldrich) for 72 h, with constant stirring at room temperature, then it was filtered with cellulose filter paper (0.45 microns) and the amount of soluble chitosan was determined by weight difference (Shrinivas Rao et. al., 2007). For chitosan, a more environmentally friendly solvent alternative was found. In this sense, the reagent grade acetic acid was replaced by apple vinegar, this to use a less aggressive solvent. Finally, it was decided to use chitosan dissolved in acetic acid and apple vinegar, varying the amount of chitosan from 0.1 g to 1g to demonstrate whether the amount of aggregate and solvent type contributed to a greater corrosion resistance.
2.3 Design and specimens fabricated procedure.
2.3.1 Specimens for mechanical tests.
The mortar specimens were fabricated according to the standards (ASTM C109, 2016; ASTM C192, 2014) with measurements of 5 cm x 5 cm x 5 cm. Table 1 shows the dosage and weight of all the materials for each cube of designed mortar.
Table 1 Materials dosage for each mortar sample.
| Materials | Quantity of materials per sample | Materials for 1 m3 | ||||||
|---|---|---|---|---|---|---|---|---|
| Control sample 1 | Samples with aggregates | |||||||
| 2 | 3 | 4 | 5 | 6 | 7 | |||
| Cement CPO 20R (kg) | 0.036 | 0.036 | 0.036 | 0.036 | 0.036 | 0.036 | 0.036 | 288 |
| Sand (kg) | 0.228 | 0.228 | 0.228 | 0.228 | 0.228 | 0.228 | 0.228 | 1824 |
| Water (l) | 0.018 | 0.018 | 0.018 | 0.018 | 0.018 | 0.018 | 0.018 | 144 |
| Fiber exoskeleton (kg) | - | 0.001 | - | - | - | - | - | 8 |
| Entire exoskeleton (kg) | - | - | 0.001 | - | - | - | - | 8 |
| Ground exoskeleton (kg) | - | - | - | 0.001 | - | - | - | 8 |
| Chitin (kg) | - | - | - | - | 0.001 | - | - | 8 |
| Chitosan (kg) | - | - | - | - | - | 0.001 | - | 8 |
| Reagent grade chitin (kg) | - | - | - | - | - | - | 0.001 | 8 |
Some considerations were considered for the fabrication of the specimens. The formwork was made of wood greased inside to guarantee adequate demolding of the cubes and to avoid breaking or fracture of the hardened mortar during this process. The cement-sand mixture was prepared, first mixing the solid materials and adding 1 g of each aggregates of entire exoskeleton, ground exoskeleton, fiber exoskeleton, chitin, reagent grade chitin and chitosan separately; finally, the water was added to the mixture. The paste was stirred for a few minutes until a homogeneous mixture was guaranteed and the mortar was poured into each mold. The entire process from preparation to pouring mortar mixture should not exceed 15 minutes. Specimens were identified and the surface of each mold was protected. The cubes were removed from the mold after 24 h and then cured for 28 days.
2.3.2 Metallic specimens for electrochemical tests.
Cylindrical specimens were fabricated to perform the electrochemical tests in calcium hydroxide solution (pH 13) with 3% calcium chloride. This to simulate the conditions and the behavior of chitosan coating on embedded steel in concrete, exposed to chloride ions. For the fabricated specimens, the 3/8” reinforcing rods were cut, to which a copper cable was soldered at one end to guarantee the electrical continuity of the steel and to be able to take potential and current readings. Subsequently, they were encapsulated with resin and a surface treatment was carried out on the surface of the steel with 600 sandpaper to improve the adhesion of coating. Then, the surface of the electrode was washed with distilled water, then with acetone and finally air dried. (Gholamhosseinzadeh et. al., 2019). These metallic specimens were evaluated electrochemically (with and without coating) exposed to the simulated solution.
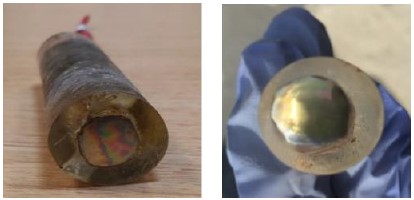
From the coatings obtained of chitosan in the acetic acid solvents of reagent grade, apple vinegar and white vinegar of sugarcane alcohol, the specimens were immersed (dip coating) in the previously synthesized solutions with chitosan. Once the coating is formed, the samples are dried for 15 min. This process was repeated two to four more times until the surface of exposed rod was covered with several layers. With this process, coatings between 2 and 3 μm thick were achieved. The surface of encapsulated coated steel is shown in Figure 1.
2.3.3 Concrete specimens for electrochemical tests.
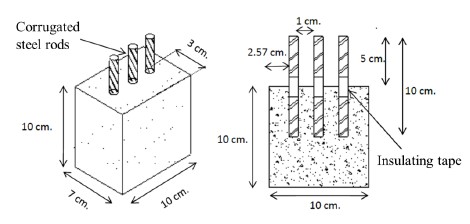
The concrete specimens were fabricated according to the standards (ASTM C31, 2012; ASTM C192, 2014) considering a design resistance of 200 kg/cm2 and a water/cement ratio of 0.5. Table 2 shows the dosage and weight of materials for each concrete sample. The dimensions of concrete samples were 10 cm x 7 cm x 10 cm, as represented in Figure 2.
Table 2 Materials dosage for each reinforced concrete sample.
| Materials | Quantity of materials per sample | Materials for 1 m3 | ||
|---|---|---|---|---|
| Control sample 1 | Samples with coating applied to reinforcing rods | |||
| 2 (0.5gVM) | 3 (0.5gAA) | |||
| Cement CPO 20R (kg) | 0.196 | 0.196 | 0.196 | 280 |
| Sand (kg) | 0.577 | 0.577 | 0.577 | 824 |
| Gravel (kg) | 0.662 | 0.662 | 0.662 | 946 |
| Water (l) | 0.098 | 0.098 | 0.098 | 140 |
The fabrication of the concrete specimens was very similar to the procedure described of mortar cubes for the mechanical tests. In this case, the difference in the procedure consisted in the placement of the three corrugated bars of RS. This process was carried out during the pouring process of the concrete into the wooden molds.
The rods were cleaned to avoid major oxidation, grease, dust, or scale on the surface. They were visually revised looking for no fractures, deformations or imperfections that would affect the strength or adhesion to concrete. The steel rods of 10 cm were wrapped in the middle with insulating tape, approximately 2 cm, to prevent surrounding solution ingress by capillary action. The area of the steel in contact with the concrete was 13.35 cm2 and two specimens were made for each coating used, as well as for the control sample.
2.4 Compressive strength test.
The compressive strength measurements of the mortars were performed to the seven cube-shaped working specimens of 5 x 5 x 5 cm, at the age of 28 days after their fabrication and curing. The specimens were placed in a hydraulic press ensuring vertical and horizontal alignment with respect to the axes of the equipment. Three specimens were tested for each aggregate incorporated into the mortar, as well as for the control sample. At the time of the sample failure due to the pressure of the press, the equipment stopped and gave a value represented as the maximum force of rupture. This value is divided by the cross-sectional area of the cube, in this way the compressive strength (f´c) was obtained. The f´c values of the samples with aggregates were compared with the design f´c of the control sample, according to the standard (ASTM C109, 2016). The compression and measurement equipment is a model 300DX, brand SATEC.
2.5 Electrochemical techniques measurement.
2.5.1 Polarization curves (PC).
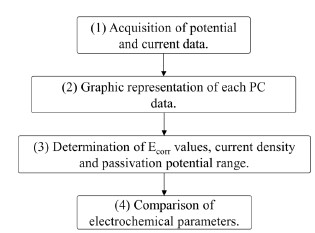
The acquisition and analysis of the electrochemical data obtained from the PC technique were carried out, as represented in Figure 3.
Application of the PC technique to obtain potential and current density data, according to the operating parameters established in the study.
Graphic representation with Origin Pro software of the data obtained for each PC.
Determination of the electrochemical parameters of each PC such as: corrosion potential (Ecorr), passivation current density, range of passivation potential and pitting potential.
Comparison of all the electrochemical parameters to determine the effect of the organic coating, according to the variables measured in the study.
For the PC measurements, a three-electrode arrangement was used, employing a Saturated Calomel Electrode (SCE) as a reference, a working electrode (encapsulated samples) and a graphite bar as a counter electrode. Operating parameters were the following: a potential sweep of -200 mV below Ecorr and up to +1000 mV, and a sweep rate of 100 mV/min. A 250 ml beaker was used as a container for the electrodes and the mock solution. The SCE and the graphite electrode were placed side by side and as close to the working electrode as possible within the simulated solution. Once all the electrodes were placed in the solution, a resting time of 30 min was allowed before starting the test so that the Ecorr value would stabilize (Gholamhosseinzadeh et. al., 2019). The experiments were carried out in triplicate for each amount of chitosan, type of solvent, number of layers, storage time, as well as for the control sample, as observed in Table 3.
Table 3 Number of samples for each variable measured by the PC technique.
| Number of samples of the specimens encapsulated for the measured variables of PC technique | ||||||||||
|---|---|---|---|---|---|---|---|---|---|---|
| Coating concentration | Solvents | Storage time | Number of layers | |||||||
| Apple vinegar | Acetic acid | White vinegar | Dec. 2015 | May. 2016 | Mar. 2017 | 1 | 2 | 3 | 4 | |
| 0 (Control) | 3 | 3 | ||||||||
| 0.1 | 3 | 3 | 3 | 3 | 3 | |||||
| 0.2 | 3 | 3 | ||||||||
| 0.3 | 3 | 3 | ||||||||
| 0.4 | 3 | 3 | ||||||||
| 0.5 | 3 | 3 | 3 | 3 | 3 | 3 | 3 | |||
| 0.6 | 3 | 3 | ||||||||
| 0.8 | 3 | 3 | ||||||||
| 1 | 3 | 3 | ||||||||
First, the coatings obtained in the solvents of acetic acid and apple vinegar were evaluated for the amount of chitosan from 0.1 g and up to 1 g. Then, the behavior for the coating concentration of 0.5 g obtained in apple vinegar was compared with the PC for the same coating concentration, obtained in white vinegar of sugarcane alcohol. In addition, chitosan coating of 0.1 g dissolved in apple vinegar and stored for one and two years was evaluated to analyze its performance as a function of time. Finally, the behavior of the coating concentration of 0.5 g was analyzed as a function of the number of layers applied to the metal surface.
2.5.2 Half-cell potential.
The HCP measurement was performed against a SCE and with a multimeter. A reading was taken from the three steel bars embedded in the concrete and the final value from the three measurements was the averaged of them. The first reading was made at the beginning of the curing process of the samples. It was considered in each measurement that the SCE was very close to the working electrode and within the aggressive solution, without touching the bottom of the container. According to the probability corrosion criteria for the Ecorr values in the standard (ASTM C876, 2015), the following intervals shown in Table 4 are described (Pérez-Quiroz et. al., 2008; Taji et. al., 2018; Díaz-Blanco et. al., 2019).
2.5.3 Linear Polarization Resistance (LPR).
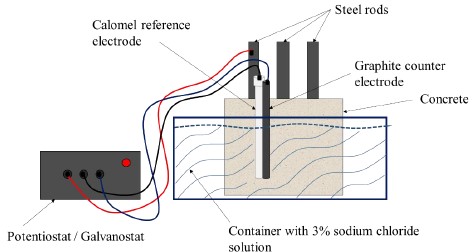
The LPR technique has been used in recent decades as a powerful tool for the analysis of CRS corrosion (Feliu et. al., 1989; Papavinasam, 2008; Zhou et. al., 2018). For the LRP measurement, an arrangement of three electrodes was used: a graphite counter electrode, the SCE as a reference electrode and the steel rods as working electrodes; with one measurement per sample according to the established test days. Both electrodes were placed as close as possible to the working electrode, next to the concrete block and inside the 3% NaCl solution, as shown in Figure 4. The LPR technique was measured according to the standard (ASTM G59, 2014), with operating parameters of ± 20 mV with respect to the Ecorr, at a scanning rate of 10 mV/min and it was plotted as a function of time. The measurement equipment used was a Potentiostat/Galvanostat/ZRA, Gamry Instruments, interface 1000, Gamry framework software. The polarization resistance (Rp) was determined as the slope of the PC around the Ecorr (Andrade and Alonso, 1996; Díaz Blanco et. al., 2019). Table 5 shows the intervals of current density (Icorr) and corrosion rate (CR), as well as the condition of steel bars according to the advance degree of corrosion (Andrade and Martínez, 2010).
2.5.4 Electrochemical noise (EN).
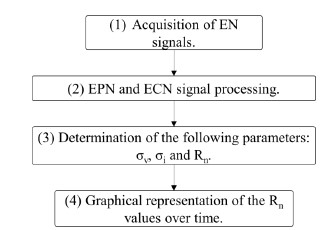
The acquisition and analysis of data obtained by the EN technique were carried out following the block diagram, represented in Figure 5.
Application of the EN technique for the acquisition of EN signals, from the established operating parameters.
Processing of electrochemical noise potential (EPN) and electrochemical noise current (ECN) signals using linear regression method.
Determination of electrochemical parameters such as: standard deviation of potential noise (σv), standard deviation of current noise (σi) and noise resistance (Rn); by means of the statistical method (SM).
Graphic representation and comparison of Rn data as a function of time between the different concrete samples.
For the EN measurement, the standard method of analysis of three electrodes (steel rods embedded in concrete) nominally "identical" was used (Genesca et. al., 2002), making a measurement for each concrete sample according to the designated test days. The equipment used was an automatic ZRA potentiostat from ACM Instruments. A sampling frequency of 1 data/s was used, and the readings recorded were 1024 data. Rn is one of the most widely used parameters for the study of noise signals. By analogy with Ohm's law, Rn was determined, and defined as the relationship between σv and σi (Sanchez-Amaya et. al., 2005). For the processing of data, a trend removal of the time series of potential and current was carried out by the linear regression method (Mansfeld et. al., 2001).
2.6 Surface characterization. Scanning Electron Microscope (SEM).
The samples were coated with a thin layer of gold to give them conductive properties. Steel rods samples with coatings elaborate from chitosan dissolved in apple vinegar were studied. The uncoated working specimen was also analyzed. The measuring equipment is LEO 1450 VP.
3. Results and discussion.
3.1 Compressive strength.
Figure 6 shows the results of the compressive strength test for the specimens with different proposed aggregates, with the aim of observing if there were improvements in the mechanical properties of mortar (Aydin and Saribiyik, 2010).
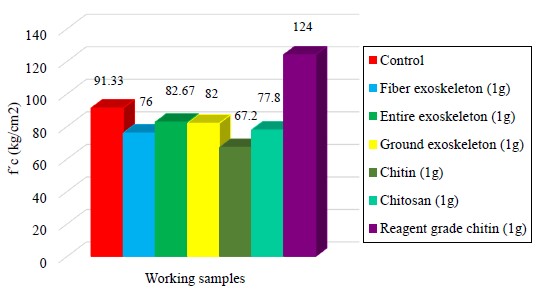
Figure 6 Compressive strength tests of the mortar specimens with different aggregates at 28 days of curing.
As can be seen, the compressive strength values with the use of the different aggregates (entire exoskeleton, fiber and ground) decrease between 9 and 17 % with respect to the control sample resistance. In the case of chitin and chitosan, the resistance values decrease by up to 26 %. Some authors report the retarding effect that chitosan has on the cement hydration, which acts as a viscosity modifying agent, possibly due to the interaction between the biopolymer and the cement compounds (Cano-Barrita and León-Martínez, 2016). In contrast, a resistance of 136 % was achieved for the sample containing reagent grade chitin, with particles retained at the 100 mesh (150 µm). According to Bezerra, chitin in cementitious mixtures can form polymeric networks that improve mechanical properties by incorporating the cement paste hydrates into their chains (Bezerra, 2016), consequently the resulting mortar cubes were possibly more compact. Certainly the shape and small size of the particles played a very important role (Page et. al., 1990), influencing the void content of the composite material, compaction and consequently in the compressive strength (Zhou et. al., 2019).
3.2 Electrochemical techniques.
3.2.1 Polarization curves.
Figure 7 shows the PC graphs for the encapsulated samples coated with different amounts of chitosan dissolved in acetic acid and apple vinegar, and immersed in a solution of calcium hydroxide with calcium chloride. Both graphs present a similar behavior, more noble Ecorr values are observed for the samples coated with low amounts of chitosan. On the contrary, Ecorr becomes more active for the control sample and the samples coated with the highest amount of dissolved chitosan, except for the sample with the 0.5 g coating in acetic acid that presents a more noble corrosion potential.
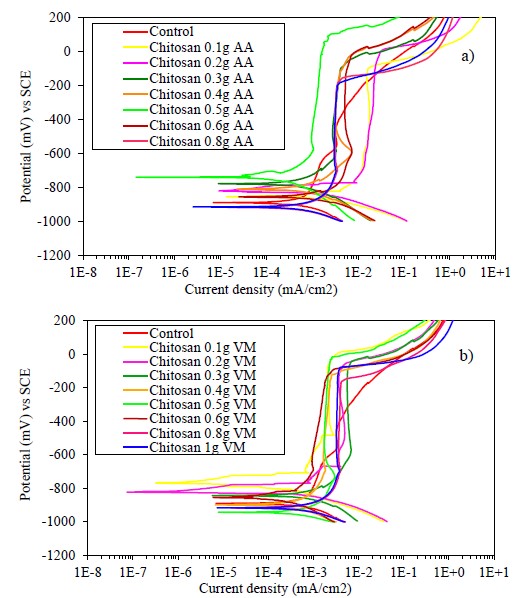
Figure 7 Polarization curves of samples coated with chitosan dissolved in a) acetic acid and b) apple vinegar, exposed to a solution of calcium hydroxide with calcium chloride.
All coated specimens have a region of passivity between -800 and -100 mV. The observed behavior suggests the metal oxidation with the subsequent formation of a more stable passive layer in the presence of the coating as a physical barrier. Chitosan as a polysaccharide is an organic polymer suitable as a coating due to its high adherence to metallic substrates (Carneiro et. al., 2015). This property is increased because chitosan and its derivatives have a notable ease of chemical functionalization (Ashassi-Sorkhabi and Kazempour, 2020). The passivation current densities are close to 1E-3 mA/cm2, whereas the control sample presents higher passivation current density values. The start of the passivation region for all samples is very similar, but the control sample shows a tendency to increase the current density, which means that the passive layer is not as stable.
The specimen with the coating of 0.5 g of chitosan has a greater passivation potential range (greater stability of the passive layer) than the other specimens, with a pitting potential close to +200 mV for the sample with coating dissolved in acetic acid (AA) and -10 mV for the coating dissolved in apple vinegar (VM). Therefore, the amount of 0.5 g of chitosan dissolved in apple vinegar was considered the best coating, which acts as a physical barrier against the entry of aggressive agents such as chloride ions (Carneiro et. al., 2013).
In Figure 8a, the PC graph of 0.5 g of chitosan dissolved in apple vinegar with respect to the white vinegar solvent of sugarcane alcohol can be seen. It is appreciated that the sample with a coating dissolved in white vinegar did not present a passivation zone, but a zone of formation of corrosion products. This confirms the use of apple vinegar as a better chitosan solvent, with the consequent formation of the best coating.
Being chitosan an organic biopolymer, a degradation of the compound as a function of time would be expected. In this sense, a concentration of 0.1 g of chitosan dissolved in apple vinegar was prepared and stored in a closed container for 17 months. The effect of the storage time and subsequent application on the metal surface was observed through the PC technique, as represented in Figure 8b.
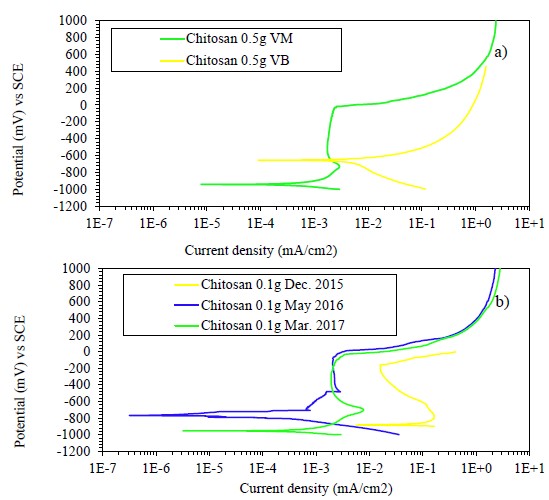
Figure 8 Polarization curves of samples with a) chitosan coating dissolved in white vinegar of cane alcohol and apple vinegar and b) chitosan coating stored and dissolved in apple vinegar; exposed to the simulated solution.
As can be seen, after 5 months of storage the chitosan coating improved its performance considerably. The passivation current decreased from the first application by more than three orders of magnitude. After 17 months of storage, the passivation potential range was wider between -1000 and 50 mV and the passivation current was two orders of magnitude lower with respect to the first application. The preservation for a long time, the favorable adhesion properties, the possible interactions of chemisorption and physisorption chitosan on the metal surface, and the availability of N and O heteroatoms of the coating are some of the characteristics that directly affect its anticorrosive behavior (Ashassi-Sorkhabi and Kazempour, 2020).
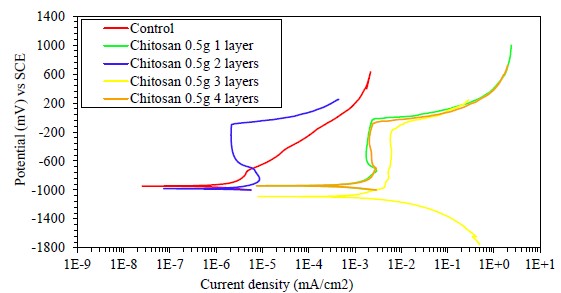
Figure 9 Polarization curves of samples with different layers (dip coating) of chitosan coating in apple vinegar, in solution of calcium hydroxide with calcium chloride.
Figure 9 shows the PC of the encapsulated samples, with and without coating of 0.5 g of chitosan dissolved in apple vinegar. One to four dips were made, forming a layer by each dipping.
In the graphs, Ecorr values around -950 mV for all samples are shown. The sample with two layers and the control sample have a lower passivation current density of 1E-6 mA/cm2, with values up to three orders of magnitude lower than the values reported for the coated specimens with one, three and four layers. This is possibly due to the fact that the specimens with the highest number of layers had poor adhesion at the metal edges (gap between the metal and the epoxy encapsulation). On the other hand, the sample with two coating layers presented a well-defined passivation zone, with a pitting potential close to -50 mV; whereas, in the anodic branch of the control sample, the behavior is different with a significant increase in current density associated with the formation of corrosion products on steel. Gebhardt et al. report a similar behavior of the anodic branch for the substrate, with and without a chitosan coating, demonstrating its favorable effect against corrosion (Gebhardt et. al., 2012). This suggests that the best coating is the two-layer one, the first one covers the metal and the second one seals the pores or defects present in the first layer.
3.2.2 Electrochemical parameters such as: Ecorr, Rn, Rp and Icorr.
Figure 10 shows the results of the Ecorr variation as a function of time for the SR embedded in the concrete coated with 0.5 g of chitosan, dissolved in apple vinegar (0.5 g VM) and in acetic acid (0.5 g AA).
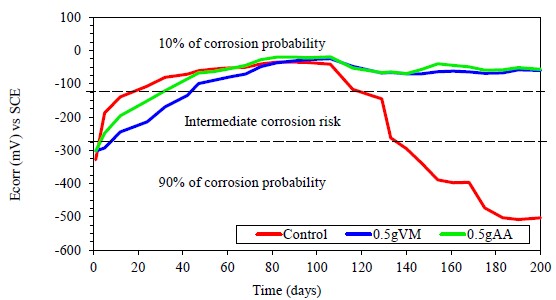
Figure 10 Variation of Ecorr over time for coated and uncoated steel embedded in concrete and exposed to a 3% NaCl solution.
At the beginning of the test period (concrete curing) the control sample quickly reached very noble Ecorr values, close to -100 mV at 28 days; steel under conditions of high alkalinity, presence of humidity and oxygen forms a passive layer of oxides that protects the metal when the aggressive ions are not present (Hansson, 1984). The coated specimens reached these Ecorr values between to 40 and 50 days of testing, possibly due to the presence of the coating that delayed the formation of the oxides passive layer. In the long term, it can be observed that both samples with coating dissolved in apple vinegar or acetic acid present a corrosion probability of 10 %, having a constant behavior from 100 to 200 days. On the other hand, Ecorr of the sample without coating begins to show a drastic fall after 100 days, reaching the range of corrosion probability of 90 % from 160 days till 200 days, according to the established criteria (Taji et. al., 2018).
Comparing both specimens with coating, the values of Ecorr are very similar and improve with the immersion time. This behavior is associated with the chitosan coating; possibly the high adherence (Carneiro et. al., 2015), absence of film defects (Hernández et. al., 2009), as well as the permanence of the physico-chemical characteristics of the coating (Ashassi-Sorkhabi and Kazempour, 2020), limits that chloride ions reach the steel and cause the breakdown of the passive layer (Alonso et. al., 2000). The favorable effect of chitosan coatings by increasing resistance against localized corrosion has been reported (Gebhardt et. al., 2012).
In Figure 11a and 11b the Rp and Rn values are presented for the concrete samples with steel coated with chitosan, dissolved in apple vinegar and acetic acid.
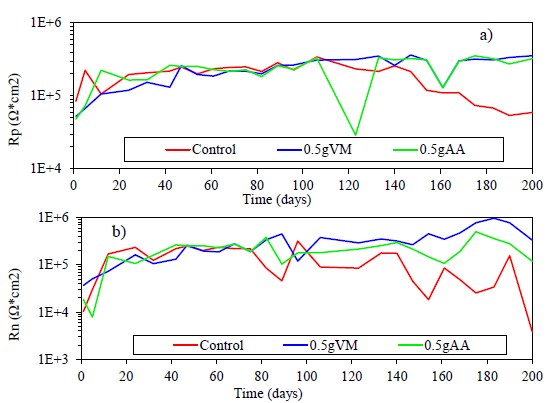
Figure 11 Variation of a) Rp and b) Rn for the reinforcing steel with and without coating embedded in the concrete, in 3% NaCl solution.
Both results show a similar trend with an increase in resistance values during the first months of testing. Between 80 and 110 days the control sample begins to decrease its Rp and Rn values, perhaps due to the breakdown of the passive layer suggesting attacks on its surface and increasing the corrosion rate.
From a linear regression between the Rp and Rn values, a mean value of correlation coefficient of 0.557 was obtained. Some authors propose by analogy with Ohm's law that the Rn and Rp can be considered equivalent for many systems (Aballe et. al., 2001; Girija et. al., 2007; Díaz Blanco et. al., 2019).
All samples show small variations in Rp values, but coated samples progressively increase their values up to 3E+5 Ω*cm2, after 200 days of testing. This behavior may be due to small defects in the coating, with possible rupture and repassivation of the passive layer. The difference between the Rp values of the control sample and the coated ones is approximately one order of magnitude at the end of the test (Hernández et. al., 2009). On the other hand, the Rn values, especially for the control sample, show large fluctuations after 110 days of testing, due to the sensitivity of this technique capable of detecting small changes in potential and current on the metal surface. Furthermore, the EN technique is sensitive to the localized corrosion type present in this system.
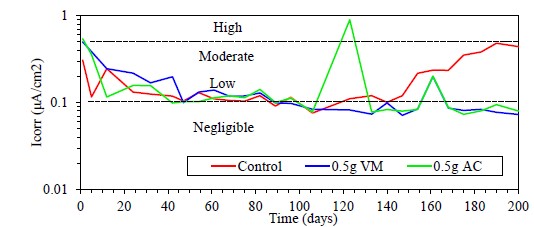
From Rp data, the corrosion rate was determined in terms of the Icorr using the Stern and Geary equation (Stern and Geary, 1957; Zhou et. al., 2018), as shown in Figure 12. Results at the beginning show, a high level of corrosion for the control sample, located in the moderate to high corrosion zone. The concrete samples that have coated rods are in the low to negligible corrosion zone according to the criteria established in the literature (Andrade and Martínez, 2010), which indicates that the coating with both solvents is effective as protection against chloride-induced corrosion.
3.3 Characterization.
3.3.1 SEM images.
Figure 13 shows the metal surface with the coating using 0.1 and 1g of chitosan with apple vinegar as solvent.

Figure 13 Comparative micrograph of coating film a) 0.1g of chitosan with VM and b) 1g of chitosan with VM c) thickness of coating film.
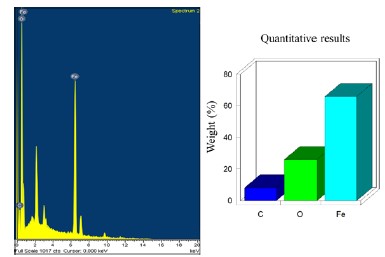
Figure 14 SEM elemental chemical analysis of the 0.5 g of chitosan coating with apple vinegar solvent.
In the first case (Figure 13a) the coating presents porosities while in the second case (Figure 13b) it is more homogeneous. In the micrograph (Figure 13c) and elemental chemical characterization (Figure 14) obtained by means of SEM, the thickness of the coating composed of 0.5g VM is observed, with a film thickness of 2.06 μm to 2.89 μm, this being a thin film. Elemental analysis presents only carbon from the coating, oxygen, and iron from the base metal.
3.3.2 Visual observation of the reinforcing rods.
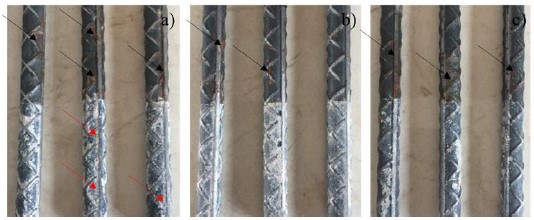
In Figure 15 the real state of the rods extracted from the concrete blocks can be observed, after 200 days of exposure to the aggressive medium of 3% NaCl.
The lower part represents the zone that was embedded in the concrete and the rods from the control sample present some corrosion products of tenuous orange, associated with the action of the aggressive medium (red arrows) which speaks of the good protection that concrete has alone. In the rods with chitosan coating, no rust products are observed, evidencing the good electrochemical behavior of the organic coating. Finally, in the upper part of the steel bars there are corrosion products caused by the action of the atmosphere, being very similar in all (black arrows).
4. Conclusions
Chitosan-based coatings and acetic acid or apple vinegar solvents showed little difference between them. The best amount of chitosan used was 0.5 g, presenting the best results with a larger passivation zone, a more noble pitting potential and a lower current density.
The coating does not show degradation with storage time and further improves its performance. With two immersions the best protective layer is obtained, according to the electrochemical tests of PC. The compressive strength showed an improvement in the presence of reagent grade chitin aggregates in the mixture, over the control sample.
Based on the results of the electrochemical techniques on CR samples, Icorr values are obtained in a corrosion range from negligible to low according to existing criteria. The presence of chitin as the aggregate of concrete and the chitosan coating shows a good behavior in RCS during the exposure time and could contribute to the improvement of the structural properties and the environment.


 texto em


