


 nueva página del texto (beta)
 Inglés (pdf)
 Artículo en XML
 Referencias del artículo
 Enviar artículo por email
 Citado por SciELO
  Similares en
SciELO
Similares en
SciELO 
 Permalink
Introduction
Plants respond to light in a variety of ways, including changes in development and morphology. Leaves and cotyledons become specialized, stem growth and elongation are restrained, chlorophyll is synthesized [1] , and chloroplasts with the ability to perform photosynthesize are developed [2]. During in vitro culture, light is one of the primary environmental factors to affect the development of plant tissues [3]. Light requirements include intensity, photoperiod, and quality of light. The intensity of light can be measured according to the number of photons emitted at a certain speed. On the other hand, the quality of light depends on the wavelength at which it is transmitted. Light is necessary to regulate certain morphogenic processes in in vitro culture. For instance, light is necessary for the formation of shoots [4], root initiation, and the initiation of photosynthesis as a result of the differentiation of chloroplasts. Indeed, light acts in conjunction with cytokinins to induce chloroplast development and chlorophyll synthesis in carrot cell suspensions [5, 6] and during the greening of etiolated Arabidopsis plantlets [7, 8]. Regarding light intensity, it has been observed that low intensities favor complex processes of cell differentiation such as embryogenesis and organogenesis, while darkness allows callus growth [9-13].
The intensity of light plays a critical role in plant physiology as it affects the synthesis of chloroplasts, which is a light-dependent process [14]. Moreover, light intensity controls the activity and composition of the thylakoid membrane. When plants are grown in the absence of light, a process called etiolation occurs, which is characterized by a reduction in photosynthetic and photoprotective pigments [14, 15]. In plants with a green phenotype, etiolation leads to a decrease in photosynthetic pigment content [1, 15]. Interestingly, when plants are grown in the shade, an adaptation process can be triggered, which involves the activation of the light sensor protein, phytochrome A (PHYA) [16]. Under shady conditions, PHYA initiates the chlorophyll production pathway. In phyA mutants, chlorophyll synthesis is decreased, and the genes that code for chlorophyll-degrading enzymes are activated, leading to the yellowing of green plants [16].
Aside from its visual effect on plant phenotype, light also plays a crucial role in regulating gene expression. DNA methylation is one of the mechanisms involved in this regulation [17-20]. The influence of light on DNA methylation has received little study [21,22]. Nevertheless, it is known that maize plants that have undergone the etiolation process have lower DNA methylation levels [23]. Until now, it has been observed that the enzymes involved in DNA methylation, such as DRM1 (DOMAINS REARRANGED METHYLTRANSFERASE1), MET1 (METHYLTRASFERASE1) and CMT3 (CHROMOMETHYLASE3) are expressed in the presence of light [24]. Using methylation-sensitive endonucleases, it was discovered in maize that DNA methylation can epigenetically regulate photosynthesis-related enzymes such as phosphoenopyruvate carboxylase (PEPC) and the major and minor subunits of RuBisCO [23,25]. Light has been shown in several studies to decrease methylation in the promoter region of the PEPC coding gene, indicating that its expression is driven by light [26].
Changes in global DNA methylation levels were discovered to be connected with the formation of somaclonal variations and were likely a result of the in vitro environment [20]. Additionally, low DNA methylation levels were associated with the albino phenotype of Agave angustifolia [20]. Consequently, if light can affect genes through DNA methylation, then albino plants exposed to low light intensities should experience changes in this epigenetic mechanism, leading to phenotypic changes. In order to investigate the phenotypic and epigenetic changes regulated by light, we exposed green (G), variegated (V), and albino (A) somaclonal variants of A. angustifolia Haw. to different light conditions.
Experimental
Plant material conditions
Seventy-five three-month-old plants each of the green (G), variegated (V), and albino (A) phenotypes were grown in Magenta boxes containing 50 mL of MS modified medium, supplemented with 0.11 µM 2,4-D and 22.2 µM of 6 BA and solidified with agar (0.2 %) and gel-rite (0.2 %). The plantlets were incubated in the culture room at 27 ± 2°C under three different light conditions: light (L) as control conditions, which represents a photoperiod of 12 hours of light (40 µmol m-2 s-1) and 12 hours of darkness per day. Darkness (D) represents a complete absence of light for 24 h/day, while S (semidarkness) represents 24 h/day of very low-intensity light (0.10 µmol m-2 s-1) conditions. The plantlets were placed in these three light conditions (L, S and D) for one month.
Phenotypic characterization
Height, fresh, and dry weight
At the beginning (T0) and at the end (1 month; 1M) of the experiment, the height, fresh weight (FW) and dry weight (DW) of five plantlets per phenotype (G, V and A) were measured for each of the three light conditions: L, S and D, described above. To obtain the DW of the plantlets, they were weighed before and after being incubated in an oven at 80 °C for 7 days. The total number of shoots obtained in each of the three phenotypes, G, V and A, were counted at the end of the experiment (1 month; T1M).
Chlorophyll and carotenoid quantification
The quantification of chlorophylls (a and b) and total carotenoids was carried out according to the protocol described by Duarte-Aké et al. [20]. Briefly, 200 mg of fresh weight of each phenotype, green (G), variegated (V) and albino (A), previously grown under the three light conditions [ light (L), semidarkness (S) and darkness (D)] at T0 and T1M was collected and mixed with 1.5 mL of 80 % acetone and macerated in a mortar. The extract was transferred to 2 mL microcentrifuge tubes and centrifuged at 10,000 rpm for 10 min at 4 °C. The pellet was washed with cold 80 % acetone until the green colouration was eliminated. The supernatant was collected in test tubes. The extract was diluted to 5 mL, and 1 mL was used for spectrophotometer analysis (Beckman coulter DU650). Measurements were taken at 663 nm (chlorophyll a), 646 nm (chlorophyll b) and 470 nm (carotenoids). The concentration of chlorophylls and carotenoids was calculated [27].
DNA methylation quantification
Genomic DNA was extracted from plantlets of phenotypes G, V and A, grown under the three light conditions (L, S and D) according to the protocol described by Echavarría-Machado et al. [28]. Briefly, 200 mg of T0 and T1M plantlets were collected and mixed with extraction buffer using 100 mM Tris-HCL (pH 8.0), 50 mM EDTA and 500 mM NaCl, supplemented with 20% SDS and 100 mM β-mercaptoethanol. Subsequently, the DNA was precipitated with the addition of 4 M sodium acetate. The supernatant was homogenized with 12 mg of silica dioxide (S5631-Sigma). The DNA was washed with 70 % ethanol and resuspended in ultrapure water (pH 7.5). The digestion of the DNA and the separation of the nucleosides were carried out according to De-la-Peña et al. [29]. The percentage of methylation in the DNA was obtained from reverse phase chromatograms using the area of the peaks to determine the concentration of 2´-deoxycytosine (dC) and 5-methyl-2´-deoxycytosine (5mdC) in the sample: (% 5mdC= C 5mdC)/ [C 5mdC + C dC] x 100, where C is the concentration. The entire analysis was performed with three replicates of different DNA extractions.
Results and discussion
Effect of light conditions on the phenotype of G, V, and A
In order to comprehend the effect of light on the green (G), variegated (V) and albino (A) Agave plantlets, we initially analyzed the variations in their phenotype (Figures 1 and 2), including their height (Fig. 2(A)), the number of leaves (Fig. 2(B)), their fresh weight (Fig. 2(C)) and dry weight (Fig. 2(D)) under three distinct light conditions - light (L), semidarkness (S) and darkness (D).
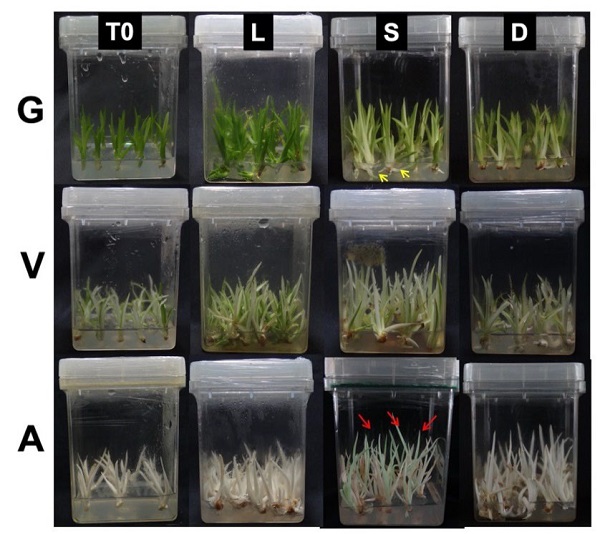
Fig. 1 Effect of different light conditions on green (G), variegated (V) and albino (A) phenotypes. The experiment was carried out in triplicate with 15 plantlets (T0) that were cultivated under three different light conditions: light (L) as control conditions, which represent a photoperiod of 12 hours of light (40 µmol m-2 s-1) and 12 hours of darkness per day. Darkness (D) represents a complete absence of light for 24 h/day, while S (semidarkness) represents 24 h/day of very low-intensity light (0.10 µmol m-2 s-1) conditions. The yellow arrows in indicate the etiolated new shoots in G and the red arrows indicate the greening observed in A plantlets that were incubated under conditions of semidarkness.
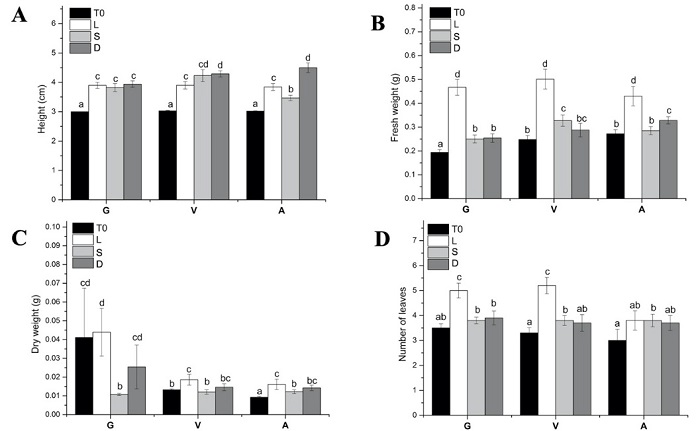
Fig. 2 Analysis of morphological changes observed between the three phenotypes, green (G), variegated (V) and albino (A), at T0 and after one month (T1M) under three different light conditions: light (L) as control conditions, which represent a photoperiod of 12 hours of light (40 µmol m-2 s-1) and 12 hours of darkness per day. Darkness (D) represents a complete absence of light for 24 h/day, while S (semidarkness) represents 24 h/day of very low-intensity light (0.10 µmol m-2 s-1) conditions. (A) Height of G, V and A. (B) Fresh weight of G, V and A. (C) Dry weight of G, V and A. (D) Number of leaves of G, V and A. The bars with the same letter do not present significant differences according to the Tukey test P < 0.05 (n=10).
It was observed that the G plantlets that were incubated under L conditions showed a morphology and colouration characteristic of Agave plantlets that are cultivated in vitro (Fig. 1). However, the G plantlets that were in conditions S and D showed phenotypic characteristics typical of the etiolation phenomenon. In particular, the plantlets that were cultivated in condition S showed a thinning of the leaves and a loss of colouration; this loss of colouration can be observed even in the shoots (Fig. 1, yellow arrows). Similarly, the conditions of D affected the phenotype of G plantlets: they showed a loss in colouration. In the case of the V plantlets that were cultivated in conditions S and D, they showed a thinning of the leaves, as well as a greater elongation than the L conditions. In contrast, the A plantlets presented significant changes (Fig. 1, red arrows). The plantlets that were cultivated in the S condition showed a pale green colouration, especially in the apical region of the leaves. Like G and V, the leaves of A showed very pronounced thinning and elongation of the leaves in both treatment S and treatment D. However, it is interesting to note that the greening found in A plantlet was only observed in the conditions of semidarkness (S) but not in the case of total darkness (D).
Lower light intensities have been shown to promote the greening of variegated mutants of Arabidopsis [30], and these conditions could inhibit the emergence of albino plants during the in vitro culture of Phleum pratense L. [31]. The immutant mutants have a variegated phenotype under 100 µmol m-2 s-1light conditions. However, when these mutants are incubated at 15 µmol m-2 s-1, the plants lose their variegation and become entirely green. This transition is accompanied by a rise in chlorophyll concentration [30].
According with our results, in addition to morphological changes, significant changes in chlorophyll a and b as well as total carotenoids were also observed (Table 1). In the green (G) phenotype, it was found that under the conditions of S there was an 80 % reduction in chlorophyll a, 64 % reduction in chlorophyll b and 76 % reduction in carotenoid content compared to the control (L conditions). Under the D condition, there was an 85 % reduction in the content of chlorophyll a, 73 % reduction of chlorophyll b and 83 % reduction of carotenoids compared to the L conditions. Regarding the Chl a/b ratio, a relationship of 2.14 ± 0.30 was observed in the plantlets that were in conditions L, 1.42 ± 0.05 in S and 1.08 ± 0.04 in D. In phenotype V, an even more severe reduction in pigment content could be observed. The plantlets in condition S presented an 86 % reduction in the content of chlorophyll a, 90 % reduction of chlorophyll b, and 88 % reduction of carotenoids with respect to the plantlets under the L condition. Under the D condition, the reduction in the content of pigments with respect to the L condition was more pronounced still: a 92 % reduction of chlorophyll a, 93 % reduction of chlorophyll b and 92 % reduction of carotenoids was observed compared to the control (L). Regarding the Chl a/b ratio, it was observed that the plantlets in condition L had a ratio of 0.83 ± 0.08, while in S it was 1.75 ± 0.49 and in D it was 0.73 ± 0.46 (Table 1).
Table 1 Quantification of pigments (μg g-1FW) in the three somaclonal variants: green (G), variegated (V) and albino (A), at the beginning of the experiment (T0) and after four weeks exposed to light conditions (L), low light intensity (S) and total darkness (D).
| Phenotype | Pigments | T0 | L | S | D |
| G | Chl a | 397.27± 86.35c | 501.54 ± 51.49d | 109.36 ± 12.57b | 75.38 ± 4.80a |
| Chl b | 209.78 ± 36.45c | 256.81 ± 43.55c | 76.10 ± 6.82b | 69.90 ± 4.33a | |
| Total Chl | 703.26 ± 89.63c | 758.362 ±89.94c | 185.46 ± 19.21b | 145.29 ± 8.71a | |
| Carotenoids | 309.36 ± 52.18c | 408.78 ± 92.89d | 89.44 ± 8.09b | 70.65 ± 4.19a | |
| Chl a/b | 2.09 ± 0.31c | 2.14 ± 0.30c | 1.42 ± 0.05b | 1.08 ± 0.04a | |
| V | Chl a | 266.15 ± 21.67c | 300.04 ± 22.22d | 43.98± 7.05b | 24.55 ± 7.37a |
| Chl b | 301.62 ± 38.56c | 382.14 ± 58.38d | 38.42 ±12.16b | 27.01 ± 8.20a | |
| Total Chl | 549.76 ± 77.25c | 682.18 ± 79.90d | 82.41 ± 19.10b | 51.57 ± 14.10a | |
| Carotenoids | 201 ± 97.25c | 310.27 ± 37.08d | 36.98 ± 8.57b | 23.51 ± 7.01a | |
| Chl a/b | 0.76 ± 0.54a | 0.83 ± 0.08a | 1.75 ± 0.49b | 0.73 ± 0.46a | |
| A | Chl a | 0.69 ± 0.46a | 0.78 ± 0.50a | 31.76 ± 9.71c | 25.85 ± 7.56b |
| Chl b | 2.9 ± 0.65a | 3.85 ± 1.07a | 29.61 ± 12.33c | 22.90 ± 8.98b | |
| Total Chl | 5 ± 0.35a | 4.64 ± 1.36a | 61.37 ± 21.78c | 48.75 ± 16.31b | |
| Carotenoids | 11.2 ± 5.3a | 16.80 ± 12.02b | 24.54 ± 9.32d | 17.39 ± 6.78c | |
| Chl a/b | 0.12 ± 0.09a | 0.166 ± 0.10b | 1.04 ± 0.32c | 1.26 ± 0.52d |
Values represent means ± SE based on three biological replicates of three independent experiments. The different letters in each column indicate the significant differences between the means with P < 0.05 according to the Tukey test.
The A plantlets presented very interesting results (Table 1). An increase in the content of Chl a and b was observed in both S and D conditions, compared to the control (L). In the S condition, it was possible to observe a 40-fold increase in the amount of Chl a, and seven-fold increase in Chl b compared to the L condition. On the other hand, in the D condition, there was a 33-fold increase in Chl a and a 5.9-fold increase in Chl b compared to the L condition. Regarding the Chl a/b ratio, a significant increase was observed between conditions, going from 0.166 ± 0.32 in plantlets exposed to the L condition, to 1.04 ± 0.32 and 1.26 ± 0.52 in plantlets exposed to conditions S and D, respectively (Table 1). Reduced light intensity can promote greening in albino plants, although the mechanism behind this phenomenon is not fully understood. One possibility, as in Arabidopsis, is that a block in chloroplast differentiation occurs, and low light intensity can stimulate and reactivate chloroplast biogenesis [30]. Under normal light conditions, the lack of photosynthetic pigments leads to oxidative stress, but the low light intensity may activate chloroplast biogenesis without damaging plastids in formation. Additionally, studies have shown that in phyA mutants grown under darkened conditions, chlorophyll synthesis is reduced and chlorophyll-degrading enzymes are activated, resulting in yellowing of green plants [16]. In A. angustifolia, it is possible that PHYA captures low light intensities, favouring pigment biosynthesis and aiding in the greening of albino plants.
The most visually evident change was the height of the shoots. The plantlets with phenotypes V and A showed a significant increase in height in the D condition compared to L (Fig. 2). The V and A plantlets in the D condition had a height of 4.29 ± 0.10 cm and 4.5 ± 0.16 cm, respectively, compared to V and A plantlets in the L condition; these had a height of 3.9 ± 0.12 cm and 3.84 ± 0.11 cm, respectively. However, in the S conditions, plantlets with phenotype V had a slight increase in height (4.23 ± 0.20 cm) compared to plantlets grown in the L condition (3.9 ± 0.12 cm). It is interesting to note that the A plantlets in low-intensity light (S) showed much lower height (3.47 ± 0.08 cm) than the A plantlets grown in the L condition (3.84 ± 0.11 cm). Although the plantlets grew considerably in the D condition, the FW (Fig. 2(B)) and DW (Fig. 2(C)) were also affected by the different light conditions. Under light (L) conditions, plantlets of the G, V, and A phenotypes showed a greater gain in fresh weight from T0 to T1M compared to other treatments. However, there was no significant gain in FW observed for any of the three phenotypes when cultivated under semidarkness (S) and darkness (D) conditions compared to T0. Although plantlets of the V and A phenotypes exhibited an increase in height due to elongation (Figures 1, and 2(A)), there was no significant gain in FW observed (Fig. 2(B)). These results suggest that L conditions are more favourable for the growth of the G, V and A phenotypes in terms of fresh weight gain.
To investigate the reason behind the differences in FW between plantlets grown under different light conditions, we analyzed their dry weight (DW). Surprisingly, we found that the DW of plantlets from all phenotypes (G, V, and A) grown under S and D conditions was similar to those grown under L conditions (Fig. 2(C)), despite the significantly higher FW gain in the latter (Fig. 2(B)). This suggests that the difference in FW between treatments was due to the accumulation of water rather than an increase in dry matter. We also examined the number of leaves on each plantlet (Fig. 2(D)) and found that plantlets of the G and V phenotypes grown under L conditions had more leaves than those grown under S or D conditions. This increased leaf area may have provided more space for water accumulation, contributing to the higher FW observed in these plantlets.
Effect of light intensity conditions on methylation levels in the DNA of phenotypes G, V and A
To investigate the possible relationship between changes in coloration (Fig. 1) and pigment content (Table 1) observed in the semidarkness treatment (S) and DNA methylation levels, we analyzed the methylation levels in each of the evaluated treatments. In the green (G) phenotype, the S and darkness (D) conditions caused a reduction in global DNA methylation levels (Fig. 3). Under the L condition, the methylation of the G plantlets was 34.7 %. However, under the conditions of S and D, the DNA methylation was reduced to 29.7 % and 26.7 %, respectively. For phenotype V, there was a reduction in methylation in condition S (31.6 %), compared to L (34.10 %). Conversely, phenotype A showed an increase in global DNA methylation levels by about 3 % under the S condition (33.1 %) compared to L (30.5 %) and D (29.1 %) conditions (Fig. 3). Notably, the A phenotype cultivated in the S condition exhibited a significant increase in the accumulation of Chl a (Table 1) that could explain the greening observed in these plantlets exposed to the semidarkness (S) condition (Fig. 1). Therefore, the increase in DNA methylation seems to be related to the chlorophyll content [20] due to the change in colouration of the A phenotype in the S condition.
Fig. 3 Global DNA methylation percentage (% 5mdC) in the green (G), variegated (V) and albino (A) phenotypes at T0 and after 28 days under different light conditions (L, S and D). The statistical comparison was performed using analysis of variance (ANOVA) and significant differences (P< 0.05) are indicated by different letters at each data point.
The etiolation phenomenon is characterized by a decrease in photosynthetic pigments as chlorophyll degradation initiates in the absence of light [32]. Furthermore, the genes responsible for the synthesis and conjugation of auxins are activated, leading to fast apical elongation. DNA methylation has been observed to regulate auxin-responsive genes, ARFs [33, 34]. Interestingly, the albino phenotype exhibited a greener coloration under the S condition (Fig. 1) associated with an increase in DNA methylation (Fig. 3). In maize, it has been observed that the greening of etiolated plants correlates with an increase in DNA methylation [23]. These findings suggest that a partial lack of light causes an increase in DNA methylation, possibly leading to a decrease expression of genes responsible to block chlorophyll synthesis and auxin regulation.
Conclusions
Low light intensities promote greening in albino plantlets accompanied by an increase in DNA methylation, in contrast in green plantlets these light conditions decrease the chlorophyll content and the global DNA methylation levels, suggesting that a low light intensity is necessary to allow the development of immature chloroplasts (proplastids) and chlorophyll synthesis in A plantlets. This process could be regulated by DNA methylation.

