


Serviços Personalizados
Journal
Artigo
 texto em
  Inglês (pdf)
 Artigo em XML
 Referências do artigo
 Enviar este artigo por email
Indicadores
-
 Citado por SciELO
 -
 Acessos
Links relacionados
-
 Similares em
SciELO
Similares em
SciELO
Compartilhar

 Permalink
Agrociencia
versão On-line ISSN 2521-9766versão impressa ISSN 1405-3195
Agrociencia vol.52 no.4 Texcoco Mai./Jun. 2018
Crop Science
Relationship between productivity and integral bean quality in advanced selections of Robusta coffee (Coffea canephora) in Ecuador
1 Instituto Nacional de Investigaciones Agropecuarias. Estación Experimental Tropical Pichilingue. C.P.24 Mocache, Los Ríos, Ecuador. (fanny.zambrano@iniap.gob.ec)
2 Universidad Técnica de Manabí. Provincia de Manabí. Portoviejo Ecuador.
3 Universidad de Los Andes. Facultad de Ciencias Forestales y Ambientales. Instituto Investigaciones Agropecuarias. Mérida, Venezuela.
The international industry of instant (or soluble) coffee has had rapid growth and the demand for Robusta (Coffea canephora) coffee beans, an essential raw material for this market, has increased 3.58 % from 2001 to 2013. In Ecuador, efforts in genetic improvement led to identification of high-yielding genotypes. Nevertheless, information about physical, chemical and organoleptic characteristics of the fruits is scarce. The objective of this study was to group selections of Ecuadorian C. canephora by production variables and physical, chemical and organoleptic characteristics. The data used corresponds to 25 plants from five clones in production for three years. The experimental unit was 1 kg green coffee of each genotype. The results showed that the conversion rate from coffee cherry to green coffee was statistically similar among the individuals. One characteristic of commercial interest was the higher content of sucrose, relative to fructose and glucose in all the genotypes. The individuals with higher production of coffee cherries had more physical defects in the green coffee beans. The multivariate analysis showed that coffee cherry, moisture content, defects and percentage caffeine were the variables that contributed most to differentiation. Fourteen of the 25 individuals evaluated had high organoleptic quality and, therefore, are considered fine coffee.
Key words: conversion; density; organoleptic quality; soluble coffee
La industria internacional del café soluble ha crecido aceleradamente, por lo que la demanda de los granos de café Robusta (Coffea canephora), una materia prima esencial para este mercado, ha aumentado 3.58 % de 2001 a 2013. En Ecuador, los esfuerzos en el área de mejoramiento genético permitieron identificar genotipos con rendimientos altos, pero la información de las características físicas, químicas y organolépticas de sus frutos es escasa. El objetivo de este estudio fue agrupar selecciones ecuatorianas de C. canephora, mediante variables de producción y características físicas, químicas y organolépticas. Los datos corresponden a tres años de producción de 25 plantas de cinco clones. La unidad experimental fue 1 kg de café oro de cada genotipo. Los resultados mostraron que la tasa de conversión “café cereza - café oro” fue estadísticamente similar entre los individuos. Una característica de interés comercial fue el contenido mayor de sacarosa respecto a fructosa y glucosa en todos los genotipos. Los individuos con producción mayor de café cereza presentaron más defectos físicos en los granos de café oro. El análisis multivariable mostró rendimiento de café cereza, porcentaje de humedad, defectos y porcentaje de cafeína como variables con contribución mayor en la diferenciación. Catorce de los veinticinco individuos evaluados mostraron calidad organoléptica alta, lo que permite considerarlos cafés finos.
Palabras claves: conversión; densidad; calidad organoléptica; solubles
Introduction
Coffee (Coffea sp.) is cultivated in 56 countries of Asia, Africa and America (ICO, 2016) and is one of the most consumed beverages worldwide (Bicho et al., 2013; Jaramillo-Villanueva and Benítez-García, 2016). Of the 100 species of the genus Rubiaceae, only Coffea arabica L. (arabica coffee) and C. canephora Pierre ex A. Froehner (Robusta coffee) are cultivated commercially. World production in the last five years was 5 and 3.6 million t, respectively, and for the last 10 years, the industrial sector is interested in evaluating C. canephora cultivars to produce mixtures with C. arabica in order to obtain variations in aroma, fragrance and acidity.
In each country, C. canephora breeding programs have produced clones with different yields and disease resistance (Cilas et al., 2003; Cilas et al., 2011). In Ecuador, according to unofficial historical reports, C. canephora was introduced in 1943 in the Tropical Experimental Station Pichilingue (EETP) of the Instituto Nacional de Investigaciones Agropecuarias (INIAP) (Loor et al., 2015) and spread to regions with different climates and soil types, from regions of high precipitation, such as the Ecuadorian Amazon to semi-arid regions in the provinces of Guayas and Santa Elena. Information regarding C. canephora clone yields in Ecuador is scarce (Plaza et al., 2015), and regarding chemical characteristics, we found only one study that shows changes in sugars, oligosaccharides and their transport during seed maturation (Rogers et al., 1999). It is unknown whether the quality of the clones selected for high production is acceptable in the market, and thus, it is necessary to evaluate the physical-chemical characteristics of recently developed high-producing materials. The content of caffeine directly affects the quality of the drink, and it is of interest to determine how it varies among regions (Babova et al., 2016). The relationship of sugar contents among the clones and their quality should also be determined.
Therefore, the objectives of this study were to group 25 elite high-yielding C. canephora trees by physical, chemical and organoleptic characteristics of the coffee beans and production and to determine the most important chemical and organoleptic variables and their relationship with high production.
Materiales y Métodos
Study site and evaluated material
This study was conducted at the Robusta coffee germplasm bank of the EETP, Los Ríos Province, Ecuador (1º 4’ 33’’ S, 79º 29’ 15’’ W, altitude 80 m; average temperature 24 ºC and relative humidity 82 %). The subjects of the study were 25 elite trees, selected in a study for their agronomic characteristics of commercial interest, such as plant height, total number of productive branches, length of productive branches, total number and distance between nodes (Plaza et al., 2015).
Production data and determination of physical and chemical properties
During the harvest period (April to October) 2012, coffee cherries were collected every 15 d from the 25 trees. After each collection, the fruits were dry-processed, exposed to sunlight in a glass canopy. The fruits were distributed in layers 3 to 5 cm thick, turned three times a day until moisture was 10 to 12 % (“café bola seca”) and hulled.
Physical and chemical variables
In each sample, moisture, density and grain size were determined. Physical defects were evaluated according to the norm INEN-ISO 10470:2012 (INEN, 2012). Real loss of mass and sensorial impact were determined to estimate the value of the defects. Soluble solids (SS) were evaluated in 10 g ground coffee in 200 mL of water, which was placed in a heater-shaker for 15 min until boiling and the liquid extract was centrifuged 10 min. A sample of 10 mL of the supernatant was dried 3 h in an oven, it was kept in a desiccator for 5 to 10 min, weighed, and yield of soluble “dry extract” coffee was obtained. Percentages of caffeine, glucose, fructose and sucrose were determined by HPLC.
Organoleptic variables
In a cylindrical roaster, 100 g green coffee was roasted at 180 to 220 ºC for 8 to 12 min until it turned dark brown. The coffee beans were then reduced to small particles (500 µm) with and electric mill.
A tasting panel of technical workers of INIAP and of the firm Solubles Instantáneos S.A. (SICA) was formed. With each sample, five cups of coffee were prepared with 8.25 g roasted ground coffee in 150 mL boiling water. The tasters scored the sensorial parameters: fragrance-aroma, taste, aftertaste, salt-acidity balance, bitter-sweet balance, sensation in mouth, uniformity, balance, purity, and general score on a scale of 1 to 10; 1 was the lowest score.
Statistics
The principal components (PCA) and cluster analyses were performed with the production, physical, chemical and organoleptic variables using the software Infostat version 12.0 (Di Rienzo et al., 2014). Cluster analysis was based on Euclidian distance and, with the cluster hierarchy method, a similarity dendrogram was obtained.
Results and Discussion
Yield
The individuals with the highest average yields between 2010 and 2012 were COF004-p9, COF004-p15, COF003-p7 and COF003-p18 (Table 1), and nine individuals produced annual averages of coffee cherries of less than 10 kg per plant. Yield above this value is a criterion for selecting high-producing clones in Ecuador (Enríquez et al., 2014). The high standard errors indicate wide production variability due to the biannual pattern (high alternating with low annual production) in the first years of production (Cilas et al., 2011). Production of C. canephora cultivars can be high in one place and different in others (Montagnon et al., 2000). Also, in allogamous species, such as Theobroma cacao, it is essential to evaluate productive variables in each specific region in function of soil conditions and climatic variables of at least four years.
Table 1 Average yield, density (D), percentage moisture (%H), average bean size (TPG), conversion coffee cherry/green coffee (C c/o), soluble solids (SS), Defects (Def) of 25 Coffea canephora individuals. EET-Pichilingue, 2012.
| Individuo | Promedio (kg) café cereza - año¶ |
D (g L-1) | H (%) | TPG (mm) | C c/o | SS | Def† |
| COF001-p2 | 10.60 ± 5.79 | 792.00 | 10.85 | 7.25 | 4.76 | 25.02 | 1.86 |
| COF001-p10 | 11.42 ± 5.28 | 750.00 | 10.38 | 5.69 | 4.32 | 22.95 | 2.15 |
| COF003-p2 | 6.97 ± 4.95 | 765.50 | 10.60 | 5.68 | 4.62 | 25.71 | 1.98 |
| COF003-p5 | 6.59 ± 4.76 | 766.60 | 10.60 | 5.63 | 4.58 | 24.89 | 1.48 |
| COF003-p7 | 13.80 ± 4.48 | 750.63 | 11.09 | 7.25 | 4.40 | 24.21 | 19.30 |
| COF003-p8 | 11.59 ± 3.30 | 758.62 | 11.90 | 5.84 | 4.11 | 25.51 | 3.36 |
| COF003-p18 | 13.37 ± 5.80 | 765.82 | 10.85 | 5.67 | 4.41 | 25.82 | 11.49 |
| COF003-p19 | 10.64 ± 5.87 | 761.83 | 10.85 | 5.66 | 4.70 | 24.70 | 4.49 |
| COF004-p7 | 10.55 ± 5.02 | 768.93 | 10.72 | 5.62 | 4.73 | 25.15 | 2.65 |
| COF004-p9 | 13.09 ± 4.93 | 767.00 | 11.30 | 5.69 | 4.51 | 26.29 | 2.77 |
| COF004-p15 | 13.90 ± 5.88 | 757.27 | 11.09 | 7.44 | 4.22 | 23.09 | 10.29 |
| COF005-p6 | 10.18 ± 6.70 | 754.80 | 10.85 | 6.58 | 4.57 | 25.37 | 3.77 |
| COF005-p15 | 11.10 ± 6.78 | 752.60 | 10.38 | 6.34 | 4.89 | 26.25 | 5.09 |
| COF005-p16 | 12.20 ± 8.12 | 750.00 | 10.85 | 6.47 | 4.87 | 26.63 | 6.70 |
| COF005-p17 | 8.67 ± 5.66 | 755.00 | 10.38 | 6.53 | 4.53 | 25.89 | 4.73 |
| COF005-p19 | 9.73 ± 6.16 | 748.10 | 10.38 | 6.46 | 5.02 | 24.71 | 9.02 |
| NP3018-p8 | 11.01 ± 5.61 | 796.61 | 11.30 | 5.71 | 4.83 | 25.28 | 1.63 |
| NP3018-p19 | 10.17 ± 5.73 | 801.14 | 11.63 | 5.65 | 4.52 | 26.66 | 1.50 |
| NP2024-p7 | 9.78 ± 6.09 | 742.54 | 10.60 | 6.46 | 4.61 | 24.64 | 7.80 |
| NP2024-p10 | 9.64 ± 5.80 | 755.00 | 10.00 | 6.40 | 4.61 | 25.05 | 5.50 |
| NP2024-p15 | 10.32 ± 5.59 | 750.18 | 10.38 | 6.39 | 4.87 | 24.86 | 3.74 |
| NP2024-p17 | 11.84 ± 8.45 | 773.60 | 10.60 | 6.42 | 4.74 | 25.91 | 5.54 |
| NP2044-p6 | 8.15 ± 5.97 | 757.85 | 10.60 | 5.95 | 4.79 | 22.43 | 3.70 |
| NP2044-p16 | 9.35 ± 5.68 | 751.01 | 11.09 | 6.05 | 4.58 | 24.39 | 4.19 |
| NP2044-p17 | 7.95 ± 6.22 | 765.20 | 10.85 | 6.12 | 4.44 | 25.95 | 3.94 |
| Promedio | 10.50 ± 5.66 | 762.31 | 10.8 | 6.20 | 4.61 | 25.09 | 5.15 |
| Desviación | 1.95 ± 0.52 | 15.04 | 0.43 | 0.55 | 0.22 | 1.09 | 4.00 |
| CV | 18.56 ± 32.09 | 1.97 | 3.96 | 8.80 | 4.75 | 4.34 | 77.79 |
†Values according to INEN-ISO 10470: 2012. p: number of the selected plant of each clone of the germplasm bank. ¶Harvest period 2010-2012. Averages are of three years ± standard error.
Physical variables of coffee beans
Density of the coffee beans was 742 (individual NP2024-p7) to 801 g L-1 (individual NP3018-p19) and the coefficient of variation among individuals was 1.97 (Table 1). All the individuals were characterized as “high density” (>650 g L-1) (Duicela et al., 2004). The conversion rate from coffee cherry to green coffee was similar among the individuals (R2 = 0.21) (Table 1), with an average of 4.61 (Figure 1), indicating that high-yielding cultivars also produce a larger quantity of green coffee (Figure 2). Individual COF003-p8 had the lowest conversion rate (4.11), a valuable commercial characteristic. Bean size varied from 5.62 to 7.44 mm, and 11 individuals had beans 5 to 6 mm, while another 11 had 6 and 7 mm beans. Three individuals (COF001-p2, COF003-p7 and COF004-p15) had values above 7 mm required by the industry (Jiménez and Soto, 1995). In our study, the individual with large beans did not have a lower conversion rate from coffee cherry to green coffee, indicating that there is no direct relationship.
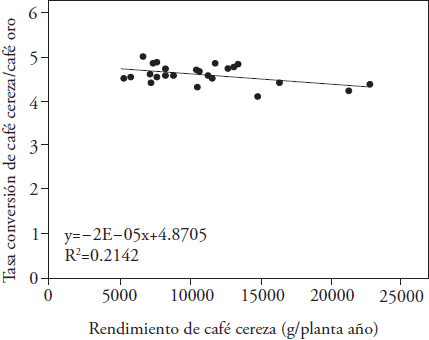
Figure 1 Relationship between coffee cherry yield and conversion rate of coffee cherry to Green coffee in C. canephora individuals. Each value is the conversion average. EET-Pichilingue, 2012.
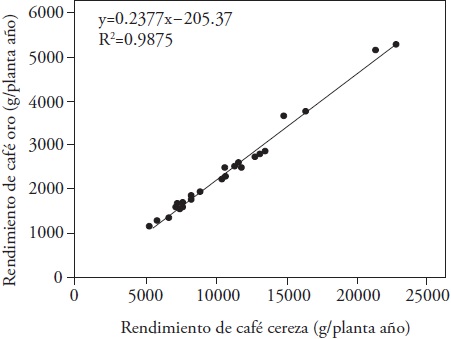
Figure 2 Relationship between coffee cherry and Green coffee of 25 C. canephora individuals. EET-Pichilingue, 2012.
Average SS was 25.09 % (Table 1), and individual NP3018-p19 had the highest percentage (26.66 %), and these values were higher than those reported by Castaño et al. (2000). According to norm INEN-ISO 10470:2012, individuals COF003-p5, COF003-p2, COF001-p2, COF001-p10, COF004-p7, COF004-p9, NP3018-p8 and NP3018-p9 had physical defects with a score of less than 3, showing little insect damage, deformities or extraneous material (stones, sticks, clods). The small amount of insect damage is considered intrinsic to each individual and could be used to select them as resistant to the coffee borer (Hypothenemos hampei). Moreover, these genotypes are of better quality because they have few perforated beans.
Chemical characteristics
Percentage of caffeine varied from 1.65 to 2.21 % (Table 2), which are similar to those obtained by Koshiro et al. (2006) in C. canephora. Caffeine concentrations of this species (1.9 %) are higher than in C. arabica (1 %). The values found in our study coincide with Mazzafera et al. (1991), whose study, however, did not show a direct relationship between percentage of caffeine and organoleptic score. Individuals COF001-p2, COF003-p2, COF003-p5, COF003-p19, COF004-p7, COF004-p9, NP2044-p6, and NP2044-p17 were outstanding for their higher values of caffeine.
Table 2 Chemical variables (%) in C. canephora. EET-Pichilingue, 2012.
| Individuo | Cafeína | Carbohidratos (%) | ||
| Glucosa | Fructosa | Sacarosa | ||
| COF001-p2 | 2.01 | 0.30 | 0.13 | 5.10 |
| COF001-p10 | 1.98 | 0.44 | 0.08 | 3.90 |
| COF003-p2 | 2.18 | 0.33 | 0.09 | 4.26 |
| COF003-p5 | 2.08 | 0.18 | 0.14 | 4.46 |
| COF003-p7 | 1.96 | 0.34 | 0.11 | 4.76 |
| COF003-p8 | 1.96 | 0.20 | 0.12 | 3.52 |
| COF003-p18 | 1.98 | 0.17 | 0.08 | 3.18 |
| COF003-p19 | 2.08 | 0.26 | 0.09 | 4.18 |
| COF004-p7 | 2.21 | 0.40 | 0.15 | 4.22 |
| COF004-p9 | 2.12 | 0.40 | 0.10 | 3.53 |
| COF004-p15 | 1.88 | 0.23 | 0.10 | 4.76 |
| COF005-p6 | 1.83 | 0.20 | 0.19 | 4.74 |
| COF005-p15 | 1.79 | 0.21 | 0.14 | 4.48 |
| COF005-p16 | 1.89 | 0.40 | 0.13 | 5.05 |
| COF005-p17 | 1.79 | 0.30 | 0.13 | 4.88 |
| COF005-p19 | 1.65 | 0.30 | 0.15 | 4.58 |
| NP3018-p8 | 1.88 | 0.34 | 0.16 | 4.77 |
| NP3018-p19 | 1.92 | 0.29 | 0.12 | 4.54 |
| NP2024-p7 | 1.78 | 0.37 | 0.17 | 5.02 |
| NP2024-p10 | 1.81 | 0.28 | 0.15 | 4.10 |
| NP2024-p15 | 1.79 | 0.29 | 0.15 | 3.83 |
| NP2024-p17 | 1.84 | 0.38 | 0.12 | 4.95 |
| NP2044-p6 | 2.05 | 0.16 | 0.15 | 4.68 |
| NP2044-p16 | 1.95 | 0.23 | 0.12 | 4.72 |
| NP2044-p17 | 2.04 | 0.16 | 0.11 | 5.10 |
| Promedio | 1.93 | 0.29 | 0.13 | 4.43 |
| Desviación | 0.14 | 0.08 | 0.03 | 0.53 |
| Coef. Var. | 7.15 | 28.94 | 22.17 | 12.02 |
The percentages of sucrose were several times higher (4.43 % average) than those of glucose and fructose (0.29 and 0.13 %) (Table 2), coinciding with that documented in C. canephora (Rogers et al., 1999) and with the content of sucrose in C. canephora from Hawaii (Koshiro et al., 2006), although values for fructose and glucose were higher than for sucrose.
Percentages of sugars in C. canephora clone coffee beans changes with provenance and parent material. In our study, all the C. canephora individuals were from the Ecuadorian Amazon region and show trends similar to other regions of Ecuador, which have been documented by Rogers et al. (1999), who confirmed that Ecuadorian C. canephora has higher concentrations of sucrose than of fructose and glucose. The values for sucrose in our study were lower than those of C. arabica reported by Rogers et al. (1999). Lower sucrose content has a negative effect on cup quality of C. canephora (Koshiro et al., 2006). However, individuals COF001-p1 and NP2044-p17 had higher concentrations of sucrose and, thus they were of high quality.
Organoleptic evaluation
Fourteen individuals had scores above 80 points (Table 3) and, according to ICO (2010) norms, they are fine coffees. Individuals COF005-p6 and COF003-p18 obtained higher total scores, and all of the characteristics had averages equal to higher than 8 (Figure 3). Moreover, both individuals were outstanding for their high yield. The type of diagram of these individuals was the result of the evaluations of the panel of tasters.
Table 3 Organoleptic characteristics of Robusta coffee beans from 25 C. canephora individuals. Scale from 1 (lowest value) to 9. EET-Pichilingue, 2012.
| Individuo | Fragancia/ Aroma |
Gusto | Regusto | Equilibrio Sal/acidez |
Equilibrio Amargo/dulce |
Sensación en la boca |
Uniformidad | Equilibrio | Limpieza | General | Puntuación total |
| COF001-p2 | 8.08 | 6.17 | 5.83 | 6.25 | 5.50 | 6.62 | 8.00 | 6.17 | 6.67 | 5.75 | 65.03 |
| COF001-p10 | 7.67 | 7.75 | 7.58 | 8.08 | 8.42 | 8.08 | 10.00 | 8.08 | 10.00 | 7.75 | 83.42 |
| COF003-p2 | 8.17 | 8.42 | 8.25 | 8.33 | 8.33 | 8.33 | 10.00 | 8.75 | 10.00 | 8.42 | 87.00 |
| COF003-p5 | 8.33 | 8.42 | 8.17 | 8.25 | 8.75 | 8.42 | 10.00 | 8.50 | 10.00 | 8.50 | 87.33 |
| COF003-p7 | 8.08 | 7.75 | 7.25 | 7.08 | 6.33 | 7.33 | 8.00 | 7.17 | 8.00 | 7.17 | 74.17 |
| COF003-p8 | 8.00 | 7.25 | 6.33 | 6.67 | 6.67 | 7.00 | 10.00 | 6.83 | 7.50 | 7.00 | 73.25 |
| COF003-p18 | 8.33 | 8.50 | 8.42 | 8.25 | 8.50 | 8.75 | 10.00 | 8.50 | 10.00 | 8.42 | 87.67 |
| COF003-p19 | 8.33 | 8.42 | 8.42 | 8.25 | 8.17 | 8.58 | 10.00 | 8.50 | 10.00 | 8.50 | 87.17 |
| COF004-p7 | 8.33 | 8.08 | 8.00 | 7.83 | 7.83 | 8.33 | 10.00 | 7.83 | 10.00 | 7.92 | 84.17 |
| COF004-p9 | 7.75 | 8.33 | 7.67 | 7.50 | 7.33 | 8.00 | 10.00 | 7.67 | 10.00 | 7.67 | 81.92 |
| COF004-p15 | 7.83 | 7.75 | 7.08 | 7.25 | 7.17 | 7.25 | 10.00 | 7.25 | 10.00 | 7.25 | 78.83 |
| COF005-p6 | 8.58 | 8.75 | 8.50 | 8.25 | 7.83 | 8.50 | 10.00 | 8.67 | 10.00 | 9.08 | 88.17 |
| COF005-p15 | 7.00 | 7.83 | 7.58 | 7.83 | 7.67 | 7.58 | 8.00 | 7.50 | 8.00 | 7.42 | 76.42 |
| COF005-p16 | 7.58 | 8.00 | 7.50 | 7.42 | 7.50 | 8.17 | 9.33 | 7.83 | 8.00 | 8.00 | 79.33 |
| COF005-p17 | 8.08 | 8.08 | 7.42 | 6.92 | 6.83 | 7.25 | 10.00 | 7.33 | 10.00 | 7.08 | 79.00 |
| COF005-p19 | 8.25 | 8.08 | 7.83 | 7.58 | 7.83 | 8.17 | 10.00 | 8.08 | 10.00 | 8.17 | 84.00 |
| NP3018-p8 | 7.75 | 7.50 | 7.17 | 7.00 | 7.33 | 7.42 | 10.00 | 7.50 | 10.00 | 7.25 | 78.92 |
| NP3018-p19 | 8.25 | 8.17 | 7.83 | 7.92 | 7.92 | 7.83 | 10.00 | 7.83 | 10.00 | 7.67 | 83.42 |
| NP2024-p7 | 8.33 | 8.58 | 8.08 | 8.17 | 8.50 | 8.25 | 10.00 | 8.50 | 10.00 | 8.67 | 87.08 |
| NP2024-p10 | 8.08 | 8.33 | 7.83 | 7.67 | 7.67 | 7.83 | 10.00 | 8.08 | 10.00 | 7.92 | 83.42 |
| NP2024-p15 | 8.50 | 8.67 | 8.50 | 8.50 | 8.17 | 8.33 | 10.00 | 8.50 | 10.00 | 8.33 | 87.50 |
| NP2024-p17 | 8.25 | 8.50 | 8.50 | 8.17 | 8.33 | 8.67 | 10.00 | 8.42 | 10.00 | 8.58 | 87.42 |
| NP2044-p6 | 7.17 | 7.42 | 6.75 | 7.08 | 6.42 | 7.00 | 8.00 | 7.17 | 8.00 | 6.42 | 71.42 |
| NP2044-p16 | 6.75 | 6.92 | 6.50 | 6.50 | 6.50 | 7.00 | 8.00 | 7.00 | 8.00 | 6.33 | 69.50 |
| NP2044-p17 | 7.58 | 7.33 | 6.92 | 6.58 | 7.17 | 6.67 | 8.00 | 7.17 | 8.00 | 6.08 | 71.50 |
| Promedio | 7.96 | 7.96 | 7.60 | 7.57 | 7.55 | 7.81 | 9.49 | 7.79 | 9.29 | 7.65 | 80.68 |
| Desviación | 0.47 | 0.61 | 0.73 | 0.66 | 0.82 | 0.65 | 0.87 | 0.67 | 1.09 | 0.87 | 6.70 |
| Coef. Var. | 5.86 | 7.67 | 9.62 | 8.76 | 10.87 | 8.34 | 9.13 | 8.64 | 11.76 | 11.40 | 8.31 |
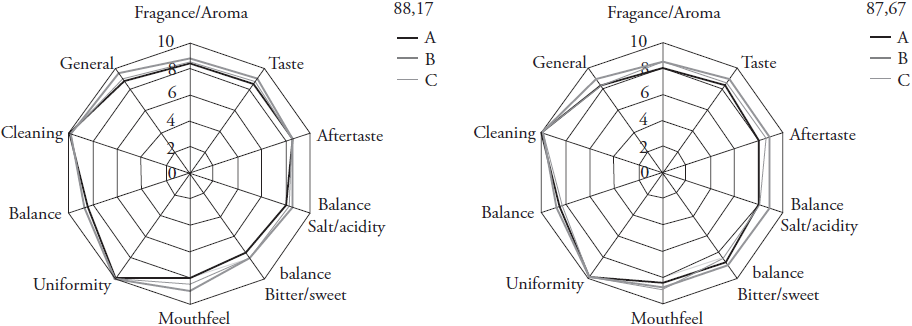
Figure 3 Diagrams of cup quality profiles of two individuals with the highest total scores in the organoleptic evaluation. EET-Pichilingue (2012).
The correlation between coffee cherry yield and defects in green coffee was significant and positive (0.55). Between chemical and sensorial variables, the correlations were not high; the highest correlations were between sensorial variables (Table 4), which showed similar quality evaluations by the members of the panel.
Table 4 Correlation of physical, chemical and organoleptic variables of 25 individuals of Ecuadorian Robusta (Coffea canephora). EET-Pichilingue, 2012.
| R-ce | D g/l | %H | TPG | C C/O | SS | Def | %C | %G | %F | %S | F/A | Gu | R | E S/A | E A/D | SB | U | E | L | G | |
| R-ce | 1 | ||||||||||||||||||||
| D g/l | -0.02 | 1 | |||||||||||||||||||
| %H | 0.36 | 0.45 | 1 | ||||||||||||||||||
| TPG | 0.33 | -0.24 | -0.15 | 1 | |||||||||||||||||
| C C/O | -0.27 | 0.05 | -0.47 | -2.90E-04 | 1 | ||||||||||||||||
| SS | 0.01 | 0.33 | 0.21 | -0.21 | 0.16 | 1 | |||||||||||||||
| Def | 0.55 | -0.43 | -0.03 | 0.55 | -0.18 | -0.19 | 1 | ||||||||||||||
| %C | -0.14 | 0.31 | 0.28 | -0.48 | -0.27 | -0.05 | -0.29 | 1 | |||||||||||||
| %G | 0.30 | 0.03 | -0.10 | 2.10E-03 | 0.18 | 0.09 | -0.01 | 0.02 | 1 | ||||||||||||
| %F | -0.31 | -0.07 | -0.21 | 0.19 | 0.49 | 0.02 | -0.16 | -0.46 | -0.08 | 1 | |||||||||||
| %S | -0.26 | 0.08 | -0.12 | 0.53 | 0.32 | -0.04 | 0.06 | -0.26 | 0.05 | 0.39 | 1 | ||||||||||
| F/A | -0.03 | -0.12 | -0.3 | -0.34 | 0.11 | 0.17 | -0.03 | -0.10 | 0.24 | 0.05 | -0.35 | 1 | |||||||||
| Gu | 0.01 | 0.14 | -0.07 | 0.03 | -0.04 | 0.18 | 0.08 | -0.05 | 0.16 | 0.14 | -0.19 | 0.67 | 1 | ||||||||
| R | -0.01 | -0.26 | -0.32 | -0.25 | 0.10 | 0.24 | 0.11 | -0.16 | 0.16 | 0.11 | -0.30 | 0.94 | 0.58 | 1 | |||||||
| E S/A | -0.04 | -0.16 | -0.39 | -0.30 | 0.22 | 0.24 | 0.05 | -0.10 | 0.18 | 0.06 | -0.28 | 0.96 | 0.60 | 0.95 | 1 | ||||||
| E A/D | -0.04 | -0.16 | -0.38 | -0.33 | 0.18 | 0.09 | -0.04 | -0.04 | 0.18 | 0.02 | -0.36 | 0.93 | 0.54 | 0.88 | 0.94 | 1 | |||||
| SB | -0.13 | -0.13 | -0.33 | -0.48 | 0.10 | 0.17 | -0.12 | -0.05 | 0.16 | -0.04 | -0.32 | 0.92 | 0.45 | 0.82 | 0.88 | 0.91 | 1 | ||||
| U | 0.07 | -0.14 | -0.30 | -0.35 | 0.24 | 0.21 | 0.02 | -0.02 | 0.30 | 0.01 | -0.36 | 0.94 | 0.59 | 0.86 | 0.93 | 0.92 | 0.87 | 1 | |||
| E | 0.08 | 0.06 | -0.01 | -0.33 | -0.13 | 0.16 | -0.19 | -0.11 | 0.32 | 0.01 | -0.42 | 0.81 | 0.67 | 0.68 | 0.63 | 0.60 | 0.67 | 0.67 | 1 | ||
| L | -0.16 | -0.21 | -0.39 | -0.37 | 0.19 | 0.14 | -0.03 | -0.07 | 0.16 | 0.06 | -0.28 | 0.96 | 0.55 | 0.91 | 0.96 | 0.94 | 0.92 | 0.93 | 0.65 | 1 | |
| G | -0.04 | 0.01 | -0.26 | -0.32 | 0.02 | 0.02 | -0.08 | -0.11 | 0.27 | 0.02 | -0.29 | 0.88 | 0.55 | 0.80 | 0.79 | 0.72 | 0.76 | 0.72 | 0.83 | 0.77 | 1 |
R-ce: coffee cherry yield, Dg/l: density, %H: moisture, TPG(mm): average bean size, C c/o: conversion coffee cherry/green coffee, Def: defects, SS: soluble solids, %C: caffeine, %G: glucose, %F: fructose, %S: sucrose and C-org: organoleptic score: F/A: fragrance/aroma, Gu: taste, R: aftertaste, E S/A: salt/acidity balance, E A/D: bitter/sweet balance, SB: sensation in mouth, U: uniformity, E: balance, L: purity and G: general
Identification of groups based on multi-variate analysis
The principal components analysis explained variability in physical, chemical and organoleptic traits. Eleven principal components (PC) explained 99 % of the variation. PC1 and PC2 explained 23 and 20 % of the total variation (Table 5). The PCA showed that the variables that most contributed to discrimination of the individuals in PC1 were percentage of moisture, average bean size, percentage of caffeine, percentage of fructose and percentage of sucrose. In PC2 the important variables were coffee cherry yield, conversion coffee cherry/green coffee, bean size and defects.
Table 5 Proportion of individual and accumulated variance in 12 principal components for physical, chemical and organoleptic variables of C. canephora individuals. EET-Pichilingue, 2012.
| Lambda | Valor | Proporción | Prop. Acum |
Valores propios de las variables | |||||||||||
| R-ce | Dg/l | %H | TPG | C c/o | SS | Def | %C | %G | %F | %S | C-org | ||||
| 1 | 2.76 | 0.23 | 0.23 | 0.03 | 0.3 | 0.34 | -0.43 | -0.28 | 0.14 | -0.25 | 0.44 | -0.01 | -0.35 | -0.36 | 0.04 |
| 2 | 2.40 | 0.20 | 0.43 | 0.50 | -0.18 | 0.22 | 0.31 | -0.41 | -0.18 | 0.48 | -0.03 | 2.90E-03 | -0.32 | -0.11 | -0.16 |
| 3 | 1.75 | 0.15 | 0.58 | 0.09 | -0.38 | -0.38 | -0.23 | 0.04 | -0.03 | 0.12 | -0.07 | 0.25 | -0.12 | -0.44 | 0.59 |
| 4 | 1.49 | 0.12 | 0.70 | 0.41 | 0.34 | 0.21 | 0.09 | 0.23 | 0.53 | 0.05 | -0.21 | 0.49 | 0.08 | 0.08 | 0.18 |
| 5 | 1.02 | 0.08 | 0.79 | -0.01 | 0.06 | -0.23 | 0.07 | 0.15 | -0.40 | -0.09 | 0.41 | 0.64 | -0.27 | 0.27 | -0.17 |
| 6 | 0.65 | 0.05 | 0.84 | -0.22 | -0.07 | -0.34 | 0.10 | 0.11 | 0.58 | 0.26 | 0.15 | -0.18 | -0.55 | 0.18 | -0.10 |
| 7 | 0.53 | 0.04 | 0.88 | 0.33 | 0.12 | -0.11 | -0.11 | 0.67 | -0.13 | 0.09 | 0.04 | -0.23 | -0.04 | -0.42 | -0.38 |
| 8 | 0.47 | 0.04 | 0.92 | 0.01 | 0.60 | -0.10 | 0.12 | 0.07 | -0.30 | 0.30 | 0.12 | -0.30 | -0.08 | 0.16 | 0.53 |
| 9 | 0.41 | 0.03 | 0.96 | -0.05 | -0.31 | 0.33 | -0.21 | 0.21 | 0.09 | 0.48 | 0.54 | 0.01 | 0.37 | 0.18 | 0.10 |
| 10 | 0.27 | 0.02 | 0.98 | 0.15 | 0.06 | -0.32 | 0.53 | -0.19 | 0.22 | -0.18 | 0.48 | -0.05 | 0.38 | -0.30 | 0.01 |
| 11 | 0.16 | 0.01 | 0.99 | -0.34 | 0.36 | -0.24 | -0.22 | -0.27 | 0.04 | 0.50 | -0.13 | 0.27 | 0.25 | -0.27 | -0.31 |
| 12 | 0.10 | 0.01 | 1.00 | 0.53 | 0.02 | -0.43 | -0.50 | -0.26 | 0.06 | -0.05 | 0.05 | -0.16 | 0.16 | 0.39 | -0.11 |
R-ce: coffee cherry yield, Dg/l: density, %H: moisture, TPG(mm): average bean size, C c/o: conversion coffee cherry/green coffee, Def: defects, SS: soluble solids, %C: caffeine, %G: glucose, %F: fructose, %S: sucrose and C-org: organoleptic score.
The dual graph of principal components shows separation of individuals with high yield, abundant defects and larger beans (positive quadrant of PC2) separated from those placed in the positive quadrant of PC1 and PC2, which included those with high production and few defects (Figure 4).
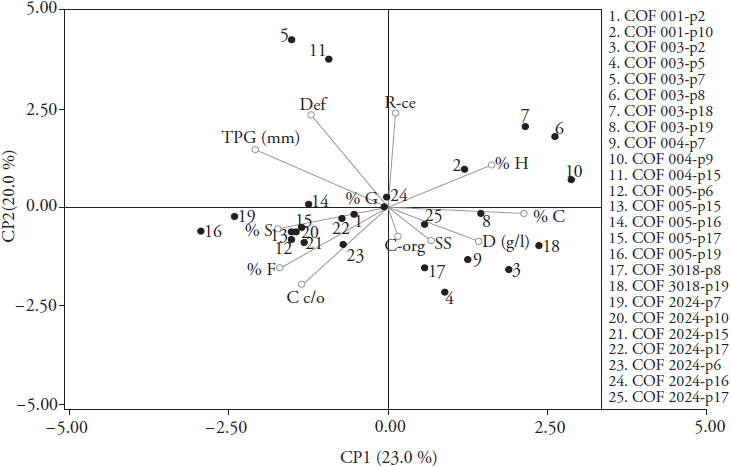
Figure 4 Principal components analysis of physical, chemical and sensorial variables of 25 Coffea canephora genotypes. EET-Pichilingue, 2012.
The cluster analysis revealed five groups (Figure 5). In the first group (G1) were COF004-p15 and COF003-p7, with higher yield, high percentage of defects and bean size larger than 7mm. The second group (G2) was COF003-p8 with high yield and few defects. The third group (G3) included NP2044-p17, NP2044-p6, NP2044-p16 and COF001-p2, which had low organoleptic scores. The fourth group (G4) was COF003p-18 with high organoleptic score and high green coffee yield. There were 17 individuals in group (G5) with medium size beans and few defects. Grouping the individuals with similar characteristics can contribute to selection of materials for industrial use. The first group had the two highest-yielding individuals, but they also had the largest quantity of defects. This last variable should be evaluated to differentiate defects caused by insects from those caused mechanically.

Implications for selection programs
The results of this study give added value to previous selections, which were based exclusively on yield. The data on quality identified two individuals that will contribute to improving quality and yield of C. canephora in Ecuador. Studies that combine productivity and quality should be conducted and validated in other regions.
Conclusions
Productive, physical, chemical and organoleptic variables are appropriate for selecting high-yielding clones. Individuals that have high production of coffee cherry also produce larger quantities of green coffee because the conversion rates are similar among them.
Ecuadorian Coffea canephora coffee beans tend to contain more sucrose than fructose and glucose, a characteristic that distinguishes them from beans from other regions. A higher percentage of sucrose has an influence in better quality, relative to other C. canephora materials from other countries. Of the individuals studied, 56 % are of good quality and should be considered fine coffee for the industry.
Literatura Citada
Babova, O., A. Occhipinti, and M. Maffei, 2016. Chemical partitioning and antioxidant capacity of green coffee (Coffea arabica and Coffea canephora) of different geographical origin. Rev. Phytochem. 123: 33-39. [ Links ]
Bicho, N., F. Lidon, J. Ramalho, and A. Leitao, 2013 Quality assessment of Arabica and Robusta green and roasted coffees - A review. Emirates J. Food 25: 945-950. [ Links ]
Castaño, C., J. Quintero, y R. Vargas, 2000. Caracterización del rendimiento de extracción y del contenido de sólidos solubles de la bebida de café. Cenicafe 51: 185-195. [ Links ]
Cilas, C., P. Bouharmont, and A. Bar-Hen, 2003 Yield stability in Coffea canephora from diallel mating designs monitored for 14 years. Heredity 91: 528-532. [ Links ]
Cilas, C., C. Montagnon, and A. Bar-Hen, 2011 Yield stability in clones of Coffea canephora in the short and medium term: longitudinal data analyses and measures of stability over time. Tree Genet. Genomes 7:421-429. [ Links ]
Di Rienzo, J., F. Casanoves, M. Balzarini, L. González, M. Tablada, and C. Robledo-. InfoStat versión 2014. Grupo InfoStat, FCA, Universidad Nacional de Córdoba, Argentina. http://www.infostat.com.ar (Consulta: abril 2016). [ Links ]
Duicela, L., R. Corral, D. Farfán, L. Cedeño, R. Palma, J. Sánchez, y J. Villacís, 2004. Caracterización física y organoléptica de cafés arábigos en los principales agro-ecosistemas del Ecuador. 1ra. (Ed.), COFENAC-ULTRAMARES, EL CAFÉ, NESTLE, PROMSA. Manta - Manabí - Ecuador. pp: 155-181. [ Links ]
Enríquez, G., L. Duicela, y W. Chilán, 2014. Germoplasma de café Robusta In: Guía técnica para la producción y postcosecha de café Robusta. 1ra. (Ed.), COFENAC. Manta, Ecuador. pp: 27-42. [ Links ]
ICO (Organización Internacional del Café). 2010. Protocolo de calidad de café robusta. Londres, Inglaterra. http://dev.ico.org/documents/pscb-123-e-robusta.pdf (Consulta: diciembre 2012). [ Links ]
ICO (Organización Internacional del Café). 2016. Historical Data on the Global Coffee Trade. http://www.ico.org/new_historical.asp (Consulta: junio 2016). [ Links ]
INEN (Instituto Ecuatoriano de Normalización). 2012. Norma Técnica del Ecuador INEN-ISO 10470:2012. Café verde. Tabla de referencia de defectos: Clasificación y requisitos. 1ra. ed. COFENAC. Quito, Ecuador. pp: 1-11. [ Links ]
Jaramillo-Villanueva, J. L., y E. Benítez-García. 2016. Transmisión de precios en el mercado mexicano e internacional de café (Coffea arabica L.): un análisis de cointegración. Agrociencia 50: 931-944. [ Links ]
Jiménez, R., y C. Soto, 1995. Secuencia de operaciones en la preparación de café oro y su influencia en el desempeño de los clasificadores electrónicos. Agron. Costarricense 19:7-13. [ Links ]
Koshiro, Y., X. Zheng, M. Wang, C. Nagai, and H. Ashihara, 2006. Changes in content and biosynthetic activity of caffeine and trigonelline during growth and ripening of Coffea arabica and Coffea canephora fruits. Plant Sci. 171: 242-250. [ Links ]
Loor, R., L. Plaza, H. Guerrero, y F. Zambrano, 2015. Desarrollo de una variedad policlonal de café robusta (Coffea canephora P.) para Quevedo y otras zonas agroclimáticas similares de la costa ecuatoriana. Boletín técnico N° 167. 1ra. (Ed.), INIAP. Quevedo-Ecuador. [ Links ]
Mazzafera, P., A. Crozier, and A. Magalhães, 1991. Caffeine metabolism in Coffea arabica and other species of coffee. Phytochemistry 30: 3913-3916. [ Links ]
Montagnon, C., C. Cilas, T. Leroy, A. Yapo, and P. Chamertann, 2000. Genotype-location interactions for Coffea canephora yield in the Ivory Coast. Agronomie 20: 101-109. [ Links ]
Plaza, L., R. Loor, H. Guerrero, y L. Duicela, 2015. Caracterización fenotípica del germoplasma de Coffea canephora Pierre base para su mejoramiento en Ecuador. Espamciencia 6:7-13. [ Links ]
Rogers, W., S. Michaux, M. Bastin, and P. Bucheli, 1999. Changes to the content of sugars, sugar alcohols, myo-inositol, carboxylic acids and inorganic anions in developing grains from different varieties of Robusta (Coffea canephora) and Arabica (C. arabica). Plant Sci. 149:115-123. [ Links ]
Received: March 2017; Accepted: April 2017
 Este es un artículo publicado en acceso abierto bajo una licencia
Creative Commons
Este es un artículo publicado en acceso abierto bajo una licencia
Creative Commons
