INTRODUCTION
Agar is one of the three main commercial seaweed extracts, and the most expensive in the hydrocolloids market with a price ranging from 35 to 45 USD kg−1 (Callaway, 2015). The world agar industry is based on the red algae Gelidium, Gelidiella, Gracilaria and Pterocladia (Armisén & Galatas, 1987; McHugh, 2003); nevertheless, the main agar source worldwide (65%) is extracted from Gracilaria species (McHugh, 2002).
Ten species of Gracilaria have been recorded from the Tropical Mexican Pacific (TMP) but studies on these species are mainly floristic assessments (e.g., Mendoza-González & Mateo-Cid, 1999; León-Tejera & González-González, 2000; Mateo-Cid & Mendoza-González, 2012). In the coastal lagoons along the TMP, the invasive species Gracilaria parvispora I. A. Abbott has been recorded with abundant biomass (Dreckmann, 1999); however, reports about the physical and/or chemical properties of its native agar for the area or another Tropical region are non-existent.
Agar is a complex water-soluble polysaccharide composed of repeating agarobiose units of alternating 1,3-linked D-galactose and 1,4-linked 3,6-anhydro-L-galactose residues (Lahaye & Yaphe, 1988). In order to identify the polysaccharide structures and the location of sulfate groups in agar samples, the infrared (IR) spectroscopy technique has been widely applied. In particular, Fourier-transform infrared spectroscopy with attenuated total reflectance (FTIR-ATR) is a technique that provides information from a few milligrams of dried and ground algal material (Murano, 1995; Freile-Pelegrín & Murano, 2005; Gómez-Ordóñez & Rupérez, 2011).
In general, the chemical and physical properties of agar vary with the species and with environmental factors such as light, nutrients, salinity, and temperature (Oyieke, 1993; Armisén, 1995). Vergara-Rodarte et al. (2010) found that native agar properties of G. parvispora (as G. vermiculophylla), inhabiting a Temperate-Tropical region showed seasonal variations, where the highest values for agar yield, gel strength, melting temperature and gelling temperature occurred in summer. In that research, the agar properties were improved by an alkali treatment (Vergara-Rodarte et al., 2010).
In particular, for Gracilaria species distributed in Tropical regions, the agar yield and gel strength are higher during the dry season in comparison with the rainy season, and this is associated with high salinity and high seawater temperature (John & Asare, 1975; Marinho-Soriano et al., 2001; Buriyo & Kivaisi, 2003; Orduña-Rojas et al., 2008). Also, higher 3,6-anhydrogalactose (3,6-AG) and sulfate contents occurs in dry season with positive correlations to sea surface water temperature; as well as a negative correlation between 3,6-AG and sulfate content (Oyieke, 1993; Buriyo & Kivaisi, 2003; Freile-Pelegrín & Murano, 2005; Orduña-Rojas et al., 2008).
The aim of this study was to determine spatial and seasonal trends in the physical and chemical properties of G. parvispora native agar, from three coastal lagoons located in the TMP, and their correlation with salinity and temperature.
MATERIAL AND METHODS
Study areas. G. parvispora was collected in three points located in three localities in the states of Oaxaca and Chiapas: Ballenato in Chantuto-Panzacola Lagoon, Chiapas (August 5, 2015 and April 13, 2016) (15.1661° N, 92.8596° W to 15.1652° N, 92.8609° W); Paredón in Mar Muerto Lagoon, Oaxaca-Chiapas (August 6, 2015 and April 14, 2016) (16.0405° N, 93.8712° W to 16.0523° N, 93.8713° W) ; and San Vicente, in the Superior Lagoon, Oaxaca (August 7, 2015 and April 15, 2016) (16.3692° N, 94.9597° W to 16.3675° N, 94.9598° W). In the region, the rainy season occurs from May to November, and the dry season occurs from December to April (Contreras et al., 1997; Tapia-García et al., 2011) (Fig. 1).
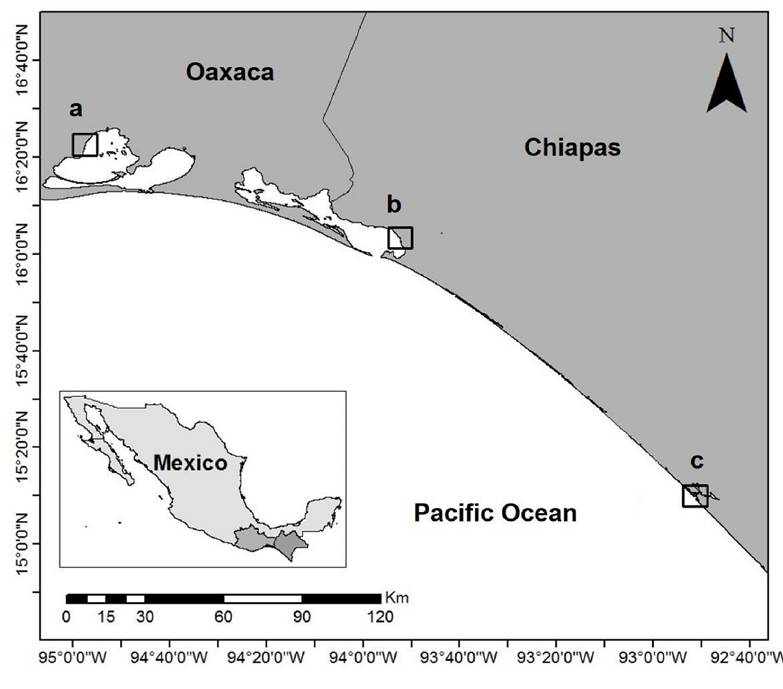
Figure 1 Study area. Sampling sites in coastal lagoons in the Tropical Mexican Pacific: a) San Vicente, b) Paredón, and c) Ballenato.
Sampling. G. parvispora thalli were collected along three transects (100 m× 5 m) from August 5-7, 2015 (rainy season) and April 13-15, 2016 (dry season). The collect was carried out only once for each sampling site per season. Transects were placed parallel to the sandy bar, separated from each other by 30 m, and at a maximum depth of 1.5 m. At six points along each transect, environmental parameters (temperature and salinity only) were recorded using a CTD profiler (CastAwayTM-CTD). The collected seaweeds were sun-dried on the beach and later transported to the laboratory, where they were ground to 0.8 mm and stored in plastic bags at room temperature. Species identification was carried out considering morphological and reproductive characteristics (Abbott, 1985; Dreckmann, 1999; García-Rodríguez et al., 2013).
Agar extraction. The extraction was carried out in triplicate and according to the method of Arvizu-Higuera et al. (2008). Fifteen grams of dry seaweed were placed in 800 mL of hot distilled water; when the solution reached 80°C, the pH was adjusted to 6.2-6.5 with 10% phosphoric acid. The seaweeds were boiled for 1.5 h, and the extract obtained was mixed with diatomaceous earth and filtered under vacuum pressure. The clarified filtrate was allowed to gel at room temperature on plastic trays and then frozen overnight and subsequently thawed at room temperature. The agar was dehydrated with 96% ethanol and dried in an oven at 55°C for 24 h. The agar yield was calculated as the percentage of dry matter.
Physical properties. In order to measure the gel strength, melting and gelling temperatures, a 1.5% solution (w/v) of each native agar sample was prepared. The solution was stored in plastic containers (8 × 3.5 × 3 cm) and allowed to gel at room temperature (22°C) overnight. Gel strength was measured using a texture analyzer (TA.XT plus, Stable Micro Systems, Godalming, Surrey, UK) and Exponent 32® software (Camacho & Hernández-Carmona, 2012). To measure melting temperature, agar solution was poured into a test tube (1.7 cm diameter, 15 cm height) and allowed to gel. Later on, an iron ball (7 mm diameter) was placed on the gel surface. The test tube was clamped in a water bath, and the temperature gradually increased. The melting temperature was recorded with a thermocouple thermometer (Digi-Sense 8528-20, Cole-Parmer Instrument Co., Niles, IL, USA) when the gel started to melt, and the ball sank into the solution. Gelling temperature was measured using the same solution that was allowed to cool down while continuously moving the tube vertically and horizontally. The probe of the thermocouple thermometer was inserted into the solution, and when it ceased flowing, the gelling temperature was recorded. Hysteresis was calculated as the difference between the melting and gelling temperatures (Arvizu-Higuera et al., 2008).
Chemical properties. The 3,6-AG content was determined by the resorcinol-acetal method (Yaphe & Arsenault, 1965), using D-fructose as standard. Absorbance was measured at 555 nm. The concentration of sulfates was determined by the rhodizonate method (Terho & Hartiala, 1971), using sodium sulfate as standard. Absorbance was measured at 520 nm.
Statistical analysis. Data were computed to obtain the average and standard error (±1 SE). Comparisons of physical and chemical properties of native agar samples, both between localities and seasons, were tested with a two-way multivariate analysis of variance (MANOVA), at α = 0.05. MANOVA assumptions were evaluated through a residual analysis for the linear model test (Dobson, 2002). When significant differences in the MANOVA test were obtained (p < 0.05), a posteriori ANOVA on the significant variables was carried out, and a Tukey test was applied to evaluate levels, factors, and interactions effects (Hair et al., 1999). Also, the Parsons coefficient was computed between agar properties and salinity and temperature values, as well as between agar properties (Statistica v.8 Software, StatSoft 2008). For the variables measured as percentages, in order to accomplish normality assumptions, they were arcsine-transformed (Zar, 2010).
FTIR-ATR spectroscopy analysis. FTIR spectra were acquired with a Perkin Elmer spectrophotometer model TWO with ATR. Each spectrum was obtained by adding 18 scans at a resolution of 4 cm−1 in the spectral range of 500-4000 cm−1. The spectra were made with Spectragryph v1.2.10 software (Menges, 2020).
RESULTS
Agar. Significant differences (p < 0.05) were obtained for all the assessed variables (Table 1), except for the gelling temperature that was not affected by the locality, season, or locality/season interaction effect (p > 0.05). The significant differences were associated with locality and/or season or their interaction. The locality factor affected agar yield, gel strength, melting temperature and gel hysteresis (Table 2). The season factor was significant for 3,6-AG and sulfate concentration and agar yield. The interaction effect was obtained for agar yield, gel strength, melting temperature and hysteresis (Table 2).
Table 1 Two-way MANOVA of physical and chemical properties of native agar extracted from Gracilaria parvispora, and for the measured environmental parameters.
| Effect | λ Wilks | F | DF effect | DF error | p |
|---|---|---|---|---|---|
| Physical and chemical agar properties | |||||
| Locality | 0.024 | 6.370 | 12 | 14 | < 0.001* |
| Season | 0.053 | 20.667 | 6 | 7 | < 0.001* |
| Locality/season interaction | 0.040 | 4.694 | 12 | 14 | 0.003* |
| Environmental parameters | |||||
| Locality | 0.001 | 153.77 | 4 | 22 | < 0.001* |
| Season | 0.011 | 472.847 | 2 | 11 | < 0.001* |
| Locality/season interaction | 0.020 | 35.7 | 4 | 22 | < 0.001* |
DF = Degrees of freedom; F = Proportion of variance; p = Probability values; *significant value (p < 0.05).
Table 2 A posteriori test of physical and chemical properties of native agar extracted from Gracilaria parvispora, and of the measured environmental parameters.
| Source of variation | DF | SS | MS | F | P |
|---|---|---|---|---|---|
| Agar yield | |||||
| Season | 1 | 20.67 | 20.67 | 16.139 | 0.001* |
| Locality | 2 | 23.68 | 11.84 | 9.247 | 0.003* |
| Interaction | 2 | 30.37 | 15.19 | 11.858 | 0.001* |
| Error | 12 | 15.37 | 1.28 | ||
| Gel strength | |||||
| Season | 1 | 1874 | 1874 | 1.549 | 0.237 |
| Locality | 2 | 109162 | 54581 | 45.112 | 0.000* |
| Interaction | 2 | 44504 | 22252 | 18.391 | 0.000* |
| Error | 12 | 14519 | 1210 | ||
| Melting temperature | |||||
| Season | 1 | 9 | 9 | 0.718 | 0.413 |
| Locality | 2 | 285.6 | 142.8 | 11.360 | 0.001* |
| Interaction | 2 | 665.2 | 332.6 | 26.460 | 0.000* |
| Error | 12 | 150.8 | 12.6 | ||
| Gelling temperature | |||||
| Season | 1 | 8.24 | 8.24 | 0.743 | 0.405 |
| Locality | 2 | 67.28 | 33.64 | 3.036 | 0.086 |
| Interaction | 2 | 47.09 | 23.54 | 2.125 | 0.162 |
| Error | 12 | 132.98 | 11.08 | ||
| Hysteresis | |||||
| Season | 1 | 34.51 | 34.51 | 1.209 | 0.293 |
| Locality | 2 | 370.78 | 185.39 | 6.495 | 0.012* |
| Interaction | 2 | 859.43 | 429.72 | 15.055 | 0.000* |
| Error | 12 | 342.51 | 28.54 | ||
| 3,6-AG | |||||
| Season | 1 | 50.34 | 50.34 | 10.914 | 0.006* |
| Locality | 2 | 1.32 | 0.66 | 0.143 | 0.868 |
| Interaction | 2 | 22.5 | 11.28 | 2.445 | 0.129 |
| Error | 12 | 55.35 | 4.61 | ||
| Sulfates | |||||
| Season | 1 | 308.62 | 308.62 | 49.808 | 0.000* |
| Locality | 2 | 34.36 | 17.178 | 2.772 | 0.102 |
| Interaction | 2 | 30.47 | 15.238 | 2.459 | 0.127 |
| Error | 12 | 74.354 | 6.196 | ||
| Salinity | |||||
| Season | 1 | 73.91 | 73.91 | 1016.036 | 0.000* |
| Locality | 2 | 78.55 | 39.27 | 539.926 | 0.000* |
| Interaction | 2 | 33.82 | 16.91 | 232.472 | 0.000* |
| Error | 12 | 0.87 | 0.07 | ||
| Surface water temperature | |||||
| Season | 1 | 0.39 | 0.39 | 2.399 | 0.147 |
| Locality | 2 | 22.80 | 11.40 | 70.725 | 0.000* |
| Interaction | 2 | 12.99 | 6.49 | 40.285 | 0.000* |
| Error | 12 | 1.93 | 0.16 |
DF = Degrees of freedom; SS = Sum of squares; MS = Mean squares; F = Proportion of variance; p = Probability values; *significant value (p < 0.05).
The agar yield during the study period was 18.5 ± 0.01%. The highest agar yield was recorded from Paredón (20.6 ± 0.01%), and it was significantly different from the other localities; also, a significantly higher value was obtained in the dry season (19.9 ± 0.004%) in comparison with the rainy season (17 ± 0.004%) (Fig. 2). For the interaction effect, the agar yield values for Ballenato (19.8 ± 0.01%) and Paredón (23.7 ± 0.01%) during the dry season were significantly higher, while no significant differences were detected between seasons for San Vicente (Fig. 2).
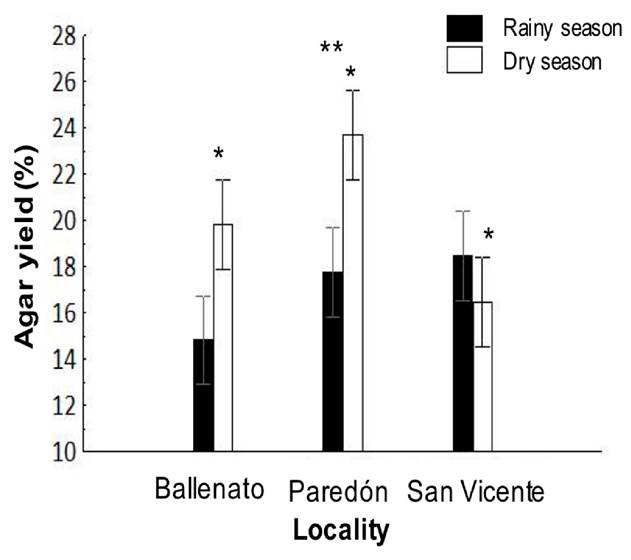
Figure 2 Interaction, locality, or season effects on native agar yield obtained from Gracilaria parvispora collected in three localities in the Tropical Mexican Pacific, n = 3. The asterisk (*) over the dry season bar indicates the presence of single seasonal effect, the agar yield was significantly higher for dry season. Two asterisks (**) indicate the presence of single locality effect, and they are placed over the bars corresponding to the locality that was significantly different.
The values obtained for gel strength, melting temperature, and hysteresis for the study period were 259.2 ± 20.1 g cm−2, 74.6 ± 2.0°C, and 38.1 ± 3.1°C, respectively. The gel strength (367.3 ± 14.2 g cm−2) and melting temperature (80.2 ± 1.4°C) for Ballenato were significantly different to those for the other two localities. A significant difference for hysteresis was found only between Ballenato (44.3 ± 2.2°C) and San Vicente (33.5 ± 2.2°C). Gel strength, melting temperature and hysteresis of agar gels from the Ballenato sample showed higher values (Fig. 3 a-c). Regarding the locality/season interaction effect, for Paredón during the rainy season, gel strength (267.3 ± 20.1 g cm−2), melting temperature (78.5 ± 2.0°C) and hysteresis (43.5 ± 3.1°C) were significantly higher, while for San Vicente during the dry season, melting temperature (79.7 ± 2.0°C) and hysteresis (43.3 ± 2.0°C) were also significantly higher. For Ballenato, no significant difference was detected between seasons (Fig. 3 a-c).
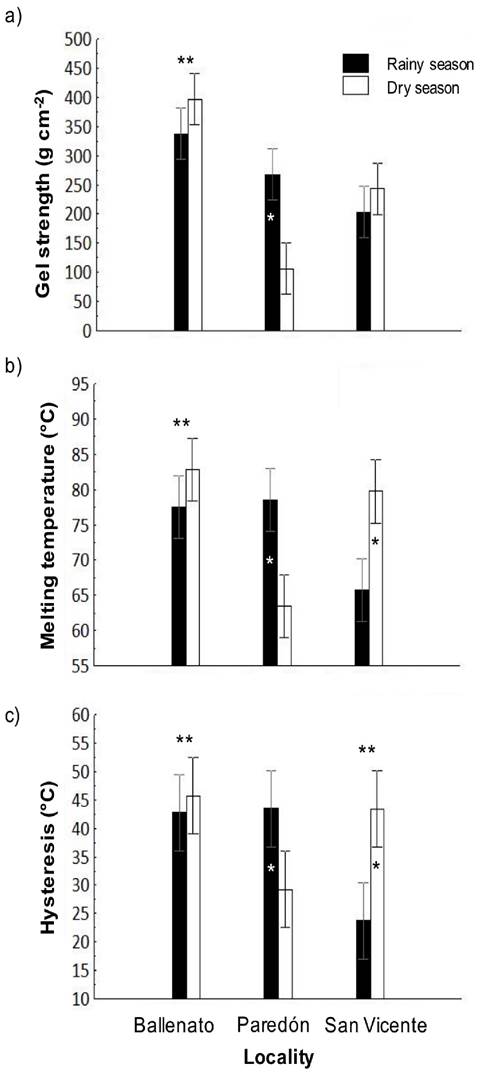
Figure 3 a-c. Interaction, locality, or season effects on gel strength (a), melting temperature (b) and hysteresis (c) of native agar obtained from Gracilaria parvispora collected in three localities in the Tropical Mexican Pacific, n = 3. One asterisk (*) indicates the presence of locality/season interaction effect, the asterisk is placed over the bar season corresponding to the highest values obtained for each locality. Two asterisks (**) indicate the presence of single locality effect, they are placed over the locality bars that presented significant differences. For hysteresis, Ballenato and San Vicente samples were significantly different each other.
The gelling temperature did not show significant differences between seasons and/or localities or interaction effects. For the study period, the gelling temperature was 35.6 ± 3.9°C; the higher values were obtained for San Vicente during the rainy season, while the lower values were obtained for Paredón during the dry season (Fig. 4).
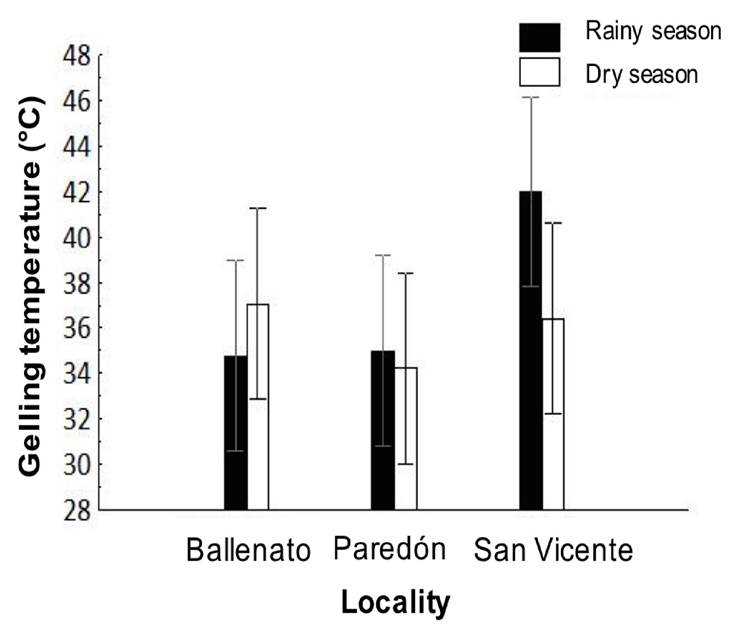
Figure 4 Spatial and seasonal variations in gelling temperature of native agar obtained from Gracilaria parvispora collected in three localities in the Tropical Mexican Pacific, n = 3. No significant differences were detected.
The 3,6-AG and sulfate content in agar samples obtained in the study period was 33.5 ± 4.5%, and 8.9 ± 4.7%, respectively. The 3,6-AG content was higher in the dry season (36.2 ± 0.02%) than in the rainy season (30.7 ± 0.02%) (Fig. 5a), while the sulfate content was significantly higher in the rainy season (12.69 ± 0.21%) than in the dry season (4.75 ± 0.15%) (Fig. 5b).
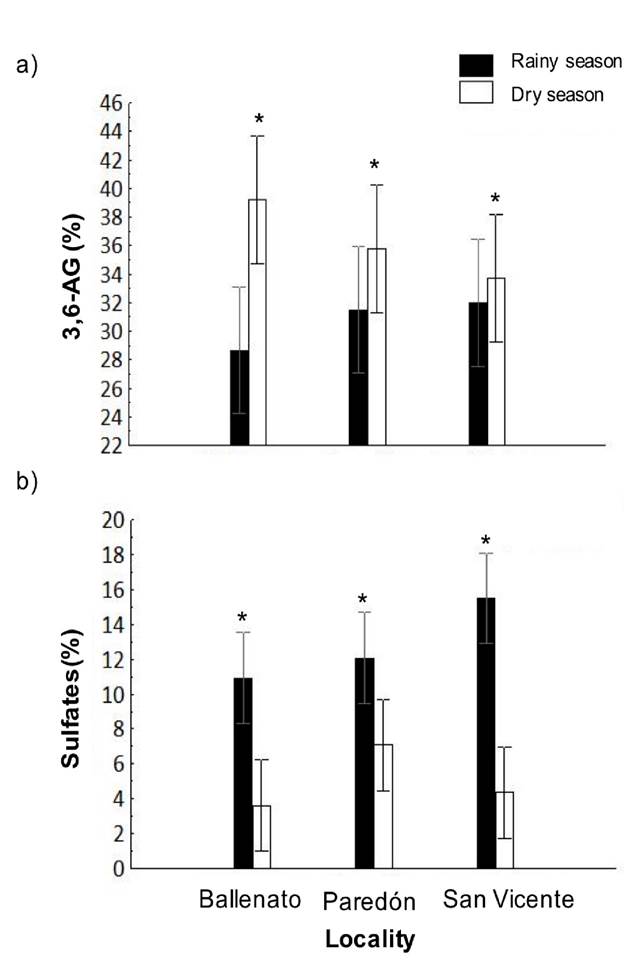
Figure 5 a-b. Interaction, locality, or season effects on 3,6-AG (a) and sulfate content (b) of native agar obtained from Gracilaria parvispora collected in three localities in the Tropical Mexican Pacific, n = 3. Asterisk (*) indicates the presence of single season effects, the asterisk is placed over the season bar corresponding to the highest obtained values for agar properties.
Agar properties were correlated with each other in different ways. For example, agar yield showed a negative correlation with gel strength and melting temperature, but a positive correlation with 3,6-AG content. Moreover, gel strength was positively correlated with melting temperature and hysteresis. Melting temperature showed a positive correlation with hysteresis. Finally, hysteresis was negatively correlated with gelling temperature, while sulfate content was negatively correlated with 3,6-AG content (Table 3).
Table 3 Correlations between physical and chemical properties of extracted agar from Gracilaria parvispora, and those versus environmental parameters.
| Agar properties and environmental parameters | Y | GS | MT | GT | H | 3,6AG | SO4C | S | SWT |
|---|---|---|---|---|---|---|---|---|---|
| Agar yield: Y | - | −0.52* | −0.48* | 0.06 | −0.42 | 0.48* | −0.10 | −0.01 | 0.00 |
| Gel strength: GS | - | 0.79* | 0.04 | 0.64* | 0.09 | −0.31 | −0.25 | −0.11 | |
| Melting temperature: MT | - | −0.23 | 0.92* | −0.00 | −0.37 | 0.14 | 0.17 | ||
| Gelling temperature: GT | - | −0.59* | 0.21 | 0.27 | 0.02 | −0.51* | |||
| Hysteresis: H | - | −0.09 | −0.42 | 0.10 | 0.34 | ||||
| 3,6-AG content: 3,6AG | - | −0.61* | 0.21 | −0.21 | |||||
| Sulfate content: SO4C | - | −0.49* | 0.07 | ||||||
| Salinity: S | - | −0.10 | |||||||
| - |
*Significant correlations (p < 0.05).
Environmental parameters. Average salinity values were significantly different (p < 0.05) among the effects given by locality, season, and for the locality/season interaction (Tables 1 and 2). For the locality effect, the highest salinity was recorded in San Vicente (39.5 ± 0.1), followed by Paredón (32.5 ± 0.1) and Ballenato (30.8 ± 0.1), while a seasonal effect was significant, with higher values during the dry season (38.7 ± 0.1) than during the rainy season (34.6 ± 0.1) (Fig. 6). The salinity was significantly (p < 0.05) different for all the localities between seasons.
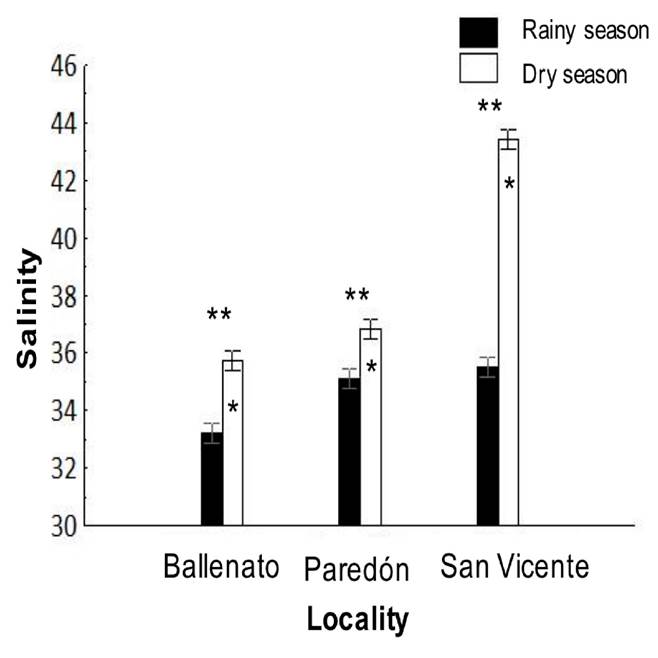
Figure 6 Interaction, locality, or season effects on salinity from the sampled locations, and during the rainy (August 2015) and dry seasons (April 2016). One asterisk (*) indicates the presence of single seasonal effect, and single asterisks are placed over the de bars season corresponding to the highest values obtained for salinity. Two asterisks (**) indicate the presence of single locality effect, and these are placed over the localities bars that presented significant differences between each other for salinity.
The surface water temperature was significantly different (p < 0.05) between localities and for the locality/season interaction effects (Tables 1 and 2). The highest surface water temperature was in Paredón (32.5 ± 0.2°C), followed by Ballenato (30.8 ± 0.2°C) and San Vicente (29.8 ± 0.2°C), while significantly different values were obtained for all the localities between seasons (Fig. 7).
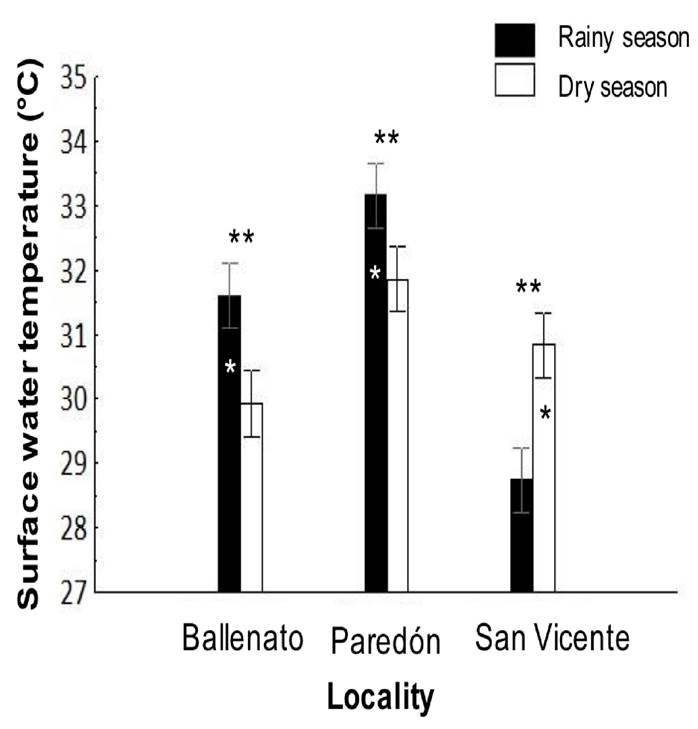
Figure 7 Interaction, locality, or season effects on the surface water temperature from sampled locations, and during rainy (August 2015) and dry seasons (April 2016). One asterisk (*) indicates the presence of single seasonal effect, the asterisk is placed over the bar season corresponding to the highest values obtained for temperature for each locality. Two asterisks (**) indicate the presence of single locality effect, and they are placed over the localities bar with significant differences. All the temperatures were significant different among localities.
The relation between salinity and surface water temperature with agar properties showed a negative correlation between gelling temperature and surface water temperature (r = −0.55), and a negative correlation between sulfate content and salinity (r = −0.49) (Table 3).
FTIR-ATR spectroscopy analysis. The FTIR-ATR spectrum of native agar samples extracted from G. parvispora (Figs. 8 and 9) showed a pattern of absorption bands at 1240-1260, 1040, 930, 890, 868, 850 and 820-805 cm−1 which correspond to a sulfated polysaccharide agar type (Matsuhiro, 1996; Pereira et al., 2013).
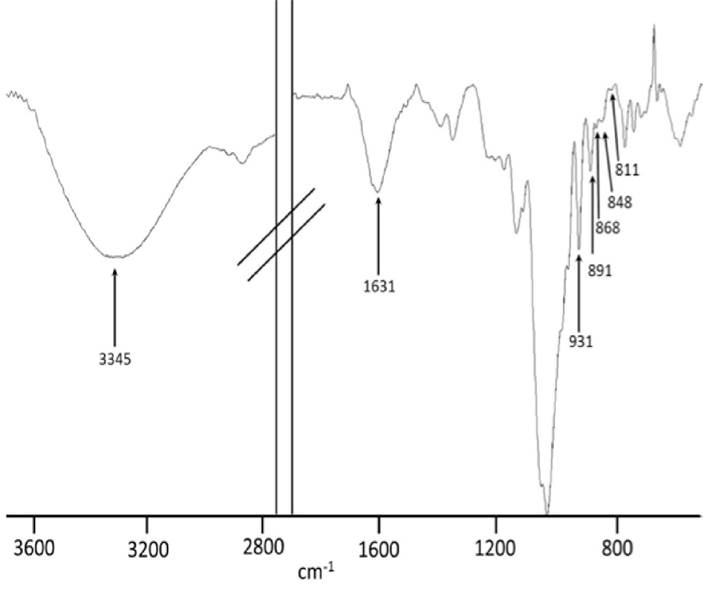
Figure 8 FTIR-ATR spectrum of a native agar sample obtained from Gracilaria parvispora representative of the dry season (Paredón locality).
DISCUSSION
This research is the first one about the physical and chemical properties of native agar obtained from G. parvispora inhabiting Tropical regions. Overall, the agar properties had significant differences among locations and seasons. There were no significant correlations between agar properties and environmental parameters, except for the gelling temperature vs surface water temperature, and sulfate content vs salinity (Table 3). The lack of correlations could be associated with the prevalence of high salinity and temperature values on the sampling periods, where variations were not biologically significant.
According to the environmental characteristics for the region, the samplings were done at the end of the dry season (April) and in the middle of the rainy season (August) (rainy season from May to November, and the dry season from December to April, Contreras et al., 1997; Tapia-García et al., 2011). Thus, the obtained results in this study are a guide to know how the agar properties are for G. parvispora inhabiting in Tropical Mexican Pacific concerning the seasons and localities; however, a continuous sampling would support a complete understanding of the seasonal variation of agar properties.
For G. parvispora but inhabiting a Temperate-Tropical region, Vergara-Rodarte et al. (2010) determined seasonal effects on yield, gelling temperature, gel strength, and melting temperature in native and alkali-treated agar. Their described patterns agree with the obtained results in the present study, except for gelling temperature. Regarding the obtained values for native agar properties, the results by Vergara-Rodarte et al. (2010) are also similar to those of the present study, except for agar yield and gel strength that were higher and lower than those we have obtained, respectively.
In particular, the mean agar yield obtained were 18.5 ± 3.1 %, with a range from 14.8 ± 0.01 % for Ballenato in rainy season to 23.7 ± 0.01 % for Paredón in dry season, respectively. This range was near to those of other invasive species of the Gracilarieae tribe (Gurgel et al., 2018) in Temperate-Tropical regions, e.g., G. parvispora (15-34.6%) (Arvizu-Higuera et al., 2008; Krueger-Hadfield et al., 2016, as G. vermiculophylla), and Agarophyton vermiculophyllum (Ohmi) Gurgel, J. N. Norris et Fredericq (15-33%) (Villanueva et al., 2010b, as G. vermiculophylla). The agar yield showed seasonal differences, with lower values during the rainy season, and lower salinity (Figs. 2 and 6). The obtained results agree with previous studies on other Gracilarieae tribe species in Tropical or Temperate-Tropical regions, where a low agar yield was obtained in the rainy season when both, a lower salinity and water temperature occur. This has been explained as an effect by rainwater leach to the coast that impacts the physiological performance of the seaweed (e.g., ionic balance, cellular exudation) (John & Asare, 1975; Buriyo & Kivaisi, 2003; Orduña-Rojas et al., 2008). In contrast, high agar yields have been reported for the rainy season and as the result of the agar deposition between the cell walls to increase structural support in low-salinity waters (Bird, 1988; Sornalakshmi, 2017).
Regarding the gel strength of G. parvispora native agar, this was higher (e.g., Ballenato 367.3 ± 14.2 g cm−2) than other reports from Tropical Gracilarieae tribe species, such as G. cervicornis (Turner) J. Agardh (< 50 g cm−2) (Freile-Pelegrín & Murano, 2005), G. parvispora (170 g cm−2) (Vergara-Rodarte et al., 2010, as G. vermiculophylla), and Hydropuntia edulis (S. G. Gmelin) Gurgel & Fredericq (78.05-166.66 g cm−2) (Lee et al., 2016; as G. edulis). The negative correlation that was detected between gel strength and agar yield (r = −0.52, Table 3) has been described for other Gracilarieae tribe species such as Crassiphycus crassissimus (P. Crouan & H. Crouan) Gurgel, J. N. Norris & Fredericq (Freile-Pelegrín & Murano, 2005; as G. crassissima) in a Tropical region, and G. parvispora in a Temperate-Tropical region (Arvizu-Higuera et al., 2008; Krueger-Hadfield et al. 2016; as G. vermiculophylla). Interspecific differences also have been reported for gel strength and attributed to structural differences among agar molecules that define the gelling properties of agar (substitution patterns, molecular weight, and distribution) (Oyieke, 1993; Marinho-Soriano et al., 2001; Lee et al., 2016)
Regarding the gelling temperature of native agar from G. parvispora, the obtained values were in accordance with standard values (32°C to 39°C), while hysteresis and melting temperature were lower than the standard values (hysteresis > 45°C, melting temperature ≥ 85°C) (Murano, 1995; Armisén & Galatas, 2000). However, the hysteresis obtained for Ballenato gels was close to the required standards. In general, the gelling temperature is influenced by the presence of methyl groups on the agar molecular structure, the melting temperature depends on the molecular weight (higher molecular weight results in higher melting temperature), and high hysteresis derives from high agarose content (Murano, 1995; Armisén & Galatas, 2000).
The mean 3,6-AG content obtained for G. parvispora agar was 33.5 ± 4.5 %, which ranged from 28.6 ± 4.4 % to 39.2 ± 4.5 %. This range agree with those obtained for other Gracilarieae tribe species (from Temperate to Tropical regions) (25.4-40.3%), including G. tenuistipitata var. liui Zhang & M. Xia (25.3%) from Temperate-Tropical regions, and Hydropuntia edulis (as G. edulis) (37.5%) and G. gracilis (Stackhouse) Steentoft, L. M. Irvine & Farnham (40.3%) from Tropical regions (Rebello et al., 1997). The sulfate content obtained for G. parvispora in the dry season (4.75 ± 0.15%) falls in the range of values cited for the genus Gracilaria (< 10%) (Murano, 1995), while the sulfate content obtained in the rainy season is higher than those values (12.69 ± 0.21%). The negative correlation found between 3,6-AG and sulfate content (r = −0.52, Table 3) has also been described previously for Gracilarieae tribe species (Freile-Pelegrín & Robledo, 1997b). Finally, the seasonal variation of 3,6-AG and sulfate content observed agrees with the values reported for several Gracilaria species (Murano, 1995; Hung et al., 2000; Buriyo & Kivaisi, 2003).
For the FTIR-ATR spectroscopy analysis, the spectra show absorption bands at 3330 cm−1 assigned to OH groups, and a weak signal at 2943 cm−1 assigned to CH2 groups. The band at 2896 cm−1 is attributed to CH3 groups; the highest intensity of this band with respect to that for CH2 suggests the presence of methyl esters (O-CH3). The signals observed in the range of 1380-1200 cm−1 are related to the vibrational modes of sulfate groups, mainly the bands around 1245 cm−1. This band is related to the presence of α-L-galactose-6-sulfate, a precursor of 3,6-AG which gives a strong signal at 930 cm−1 corresponding to the vibrational modes of the C-O-C bridge present in this monomer. Weak signals observed at 868 cm−1 correspond to L-galactose-6-sulfate; the bands at 850 and 820 cm−1 are attributed to vibrations of the sulfate group of D-galactose-4-sulfate (Figs. 8 and 9) (Praiboon et al., 2006; Villanueva et al., 2010a; Barros et al., 2013; Guerrero et al., 2014).
In sulfated polysaccharides such as agar, the position of the sulfate groups can be determined by the absorption bands in the range of 800-880 cm−1. In the literature, the bands at 845 cm−1 and a small shoulder at 830 cm−1 are attributed to vibrations of the 4-O-sulfate and 2-O-sulfate bonds of D-galactose; the signals at 820 and 805 cm−1 are attributed to substitutions in the C6 and C2 carbons of L-galactose and 3,6-AG, respectively. The presence of sulfates in carbon 4 of L-galactose is related to gel strength, a parameter of agar quality (Tako, 2015). This signal decreases with alkaline treatment (Fig. 9), and the gel strength increases; other bands that are affected and that are representative of the presence of sulfates are those in the range of 1380-1200 cm−1, specifically those around 1245 cm−1. When L-galactose-6 sulfate loses sulfate due to alkaline treatment, this band decreases in intensity; L-galactose-6 sulfate gives way to 3,6-AG, and the band at 930 cm−1 increases and, with this, the gel strength (Mazumder et al., 2002; Viana et al., 2004; Heydari et al., 2014).
The native agar of G. parvispora shows a pattern of substitution of sulfate groups similar to those obtained from other sources previously reported (Praiboon et al., 2006). Moreover, it does not show considerable differences between either samples collected in a different area or at different times.
In conclusion, the properties of native agar from G. parvispora are similar to those for other Gracilarieae tribe species distributed in Tropical and Temperate-Tropical regions. The agar yield was relatively low, but it is in the range previously cited for G. parvispora and for other Gracilaria species. The gel strength of G. parvispora native agar from TMP is higher than reported for other Gracilarieae tribe species; however, the gel strength does not comply with the standards required for commercial use. Melting temperature and hysteresis values were low and close to the characteristic values of agar gels. The gelling temperature was lower than those established for the genus. The mean values for 3,6-AG and sulfate content are in the range reported for other Gracilarieae tribe species. In particular, the best native agar properties of G. parvispora were found for gels obtained from Ballenato samples and during the dry season. The gel strength and melting temperature were close to standard values. Moreover, in order to improve gel properties, it may be necessary to carry out an alkaline treatment as proposed by Freile-Pelegrín and Robledo (1997a) and Arvizu-Higuera et al. (2008). Finally, a longer sampling period is suggested to follow the continuous agar variations along the time.


 nueva página del texto (beta)


