


Serviços Personalizados
Journal
Artigo
 texto em
  Inglês (pdf)
 Artigo em XML
 Referências do artigo
 Enviar este artigo por email
Indicadores
-
 Citado por SciELO
 -
 Acessos
Links relacionados
-
 Similares em
SciELO
Similares em
SciELO
Compartilhar

 Permalink
Agrociencia
versão On-line ISSN 2521-9766versão impressa ISSN 1405-3195
Agrociencia vol.51 no.6 Texcoco Ago./Set. 2017
Crop Science
SUNFLOWER (Helianthus annuus L.) GROWTH DEPENDING ON IRRIGATION WITH SALINE WATER AND NITROGEN FERTILIZATION
1Universidade Federal de Campina Grande, UFCG, Centro de Tecnologia e Recursos Naturais, Campina Grande, Paraíba. (agrosantos@hotmail.com).
2Faculdade Maurício de Nassau, Campina Grande. (cruzmarcen@gmail.com).
3Universidade Federal de Campina Grande. (cazevedo@deag.ufcg.edu.br).
4Universidade Federal do Recôncavo da Bahia. (hans@pq.cnpq.br).
5PNPD/CAPES, UFCG. (geovanisoareslima@gmail.com).
6Universidade Federal do Rio Grande do Norte, Natal, RN, Brasil.
Water is a resource for agriculture, urban and industrial activities. It is insufficient in the arid climate areas in the north east of Brazil. Saline water is as an alternative to the expansion of agricultural irrigation areas. Our objective was to assess the effect of irrigation with saline water and nitrogen fertilization on sunflower (Helianthus annuus L.) cv. EMBRAPA 122-V2000 growth. This study was carried out in a greenhouse at the Campina Grande Federal University, Paraiba, Brazil, between April and July 2012. The experimental design was completely random with three replications in a 5×5 factorial arrangement; salinity levels in irrigation water, with electrical conductivity (ECa) of 0.7, 1.7, 2.7, 3.7 and 4.7 dS m-1 (25 °C) and N doses of 50, 75, 100, 125 and 150 mg kg-1 as factors, in 75 experimental units. The variables evaluated during the growth cycle were: plant height, stem diameter, number of leaves, leaf area, flowering onset, maximum inflorescence opening, inner and external flower diameter, and chlorophyll content. The results with ECa of 0.7 dS m-1 linearly decreased. The salinity of the irrigation water and nitrogen fertilization interaction was not significant in the evaluated variables, except for the plant height 15 d after sowing. The flowering variables were delayed as the salinity of the irrigation water increased and chlorophyll content decreased, but increased with N.
Key words: saline water; salt stress; nitrogen dosage
El agua es un recurso para la agricultura, urbano e industrial y es insuficiente en zonas con clima semiárido en el nordeste de Brasil. El agua salina debe considerarse una alternativa para la expansión de las zonas agricolas con riego. El objetivo de este estudio fue evaluar el efecto del riego con agua salina y fertilización nitrogenada en el crecimiento del girasol (Helianthus annuus L.) cv. EMBRAPA 122-V2000. El estudio se desarrolló en un invernadero de la Universidad Federal de Campina Grande, Paraiba, Brasil, entre abril y julio de 2012. El diseño experimental fue totalmente al azar con tres repeticiones, en arreglo factorial 5×5; niveles de salinidad del agua de riego con conductividad eléctrica (ECa) de 0.7, 1.7, 2.7, 3.7 y 4.7 dS m-1 (25 °C) y dosis de N de 50, 75, 100, 125 y 150 mg kg-1, en 75 unidades experimentales. Las variables evaluadas durante el ciclo de crecimiento fueron: altura de la planta, diámetro del tallo, número de hojas, área foliar, inicio de floración, apertura máxima de la inflorescencia, diámetro interno y externo del capítulo floral, y contenido de clorofila. Los resultados con ECa de 0.7 dS m-1 decrecieron linealmente. La interacción salinidad del agua del riego y fertilización nitrogenada no fue significativa en las variables, excepto en la altura de la planta 15 d después de la siembra. Las variables de la floración se retardaron con el aumento de la salinidad del agua de riego y el contenido de clorofila disminuyó, pero aumentó con el N.
Palabras clave: agua salina; estrés salino; dosis de nitrógeno
Introduction
Sunflower (Helianthus annuus L.) is used for human and animal nutrition. For this reason, government organisms are interested in this oleaginous plant and the possibility of using it for oil production. Sunflower can also be used for biofuel production, which is an income alternative in the Brazilian agriculture in semiarid since sunflowers show certain tolerance to heat and drought (Silva et al., 2007).
The study of plant structures allows detecting the variability of each species populations and the relationship between this variability and the environmental factors, complementing the techniques for the improvement of genetic programs (Macedo et al., 2009). Plant growth analysis is a feasible technique to explore the physiological bases of production; it highlights the influences of the environmental, genetic and agronomic interactions. This technique describes the morphophysiological conditions of the plant throughout time; the methods for its use have been documented (Peixoto et al., 2008; Cruz et al., 2010).
The sunflower crop in Brazil requires studying to obtain information for breeding programs and to increase productivity. Growth and agronomic yield indicators depend on the morphology and the change in hydric stage, membranes integrity, inorganic solutes concentrations, and the nutrients allocation. Likewise, the synthesis of organic compounds can be used as physiological and biochemical markers (Taiz and Zeiger, 2009).
In northeastern Brazil, excess salts in soil and water has adverse effects on plants, such as osmotic disorders, that make water absorption through the roots difficult, ions toxicity and nutritional imbalance (Torres et al., 2004). High salinity levels limit agricultural production, since they cause morphological, structural and metabolic modifications in plants (Conus et al., 2009). The effects of salinity on the irrigation water on sunflower production have been evaluated (Nobre et al., 2011; Santos Júnior et al., 2011). From salt stress indicators related to grain yield and oil quality, sunflower is considered as a species with a moderate drought and salinity tolerance (Caterina et al., 2007). The aim of this study was to evaluate growth variables in sunflower cv. EMBRAPA 122-V2000 as a function salinity of under irrigation water and nitrogenized fertilization under greenhouse conditions.
Materials and Methods
The study was conducted from April to July 2012, in a greenhouse at the Center of Technology and Natural Resources (CTRN), Universidad Federal de Campina Grande, Brasil. The greenhouse is located in the central-east portion of the Borborema Plateau, Paraiba State (7° 13’ 11” S, 35° 53’ 31” W and 550 m of altitude). According to Köppen’s climatic classification, the climate in the area is A mesothermal semi-humid Csa type, with hot and dry summer (4-5 months) and the rainy season from autumn to winter (Coelho and Soncin, 1982).
Treatments resulted from the combination of the electrical conductivity (Eca) factors from the irrigation water (0.7, 1.7, 2.7, 3.7 and 4.7 dS m-1 at 25 °C) and N doses (50, 75, 100, 125 and 150 mg of ground kg-1). The expected ECa was achieved by NaCl addition. The N dose in the soil, which Novais et al. (1991) recommends to be of 100 mg kg-1. The statistical design was completely randomized with a factorial arrangement of 5×5, with three replications and 75 experimental units.
Ten seeds were sown at a 2 cm depth, on plastic containers (adapted as drainage lysimeters) with 120 kg of soil. Germination began 4 d after sowing (DAS) and continued until the 13th day; 15 DAS the three hardiest plants per vessel were left. The first measurement of the variables was made on these plants. At the beginning of the experimental phase, in soil samples at 0.20 m deep, fertility chemical analysis and salinity were carried out (Table 1), according to the methods proposed by EMBRAPA (1997).
Table 1 Initial analysis of the soil at 20 cm depth.

MO: organic matter, CIC: cationic exchange capacity=[SB+(H++Al3+)], SB: sum of bases (Ca2++Mg2++K++Na+), V: bases saturation=(SB/CIC)×100, ECes: electrical conductivity of the saturation extract, PSI: percentage of intercambiable sodium=(Na+×100/CIC).
Irrigation was done manually, soil field capacity was maintained before the start of planting. Irrigation was managed according to the water balance and a 2 d interval. Water sheet was calculated with the water volume applied and the previous irrigation drain plus a 10 % leaching sheet.
Before sowing, inorganic phosphate and potassium fertilizers were applied to the pots, according to the nourishing needs of the plant and following the methodology recommended by Novais et al. (1991) for greenhouses. Fertilization at the base consisted on 300 kg-1 of P2O5 and 4 mg kg-1 of B with simple superphosphate and boric acid, each. Nitrogen in the form of urea fertilizer was applied according to the treatments. Potassium fertilization at a level of 150 mg of K2O kg-1 came from KCl. Fertilization with N and K was done with a third at planting and two-thirds in coverage in equal parts at 20 and 40 DAS.
The assessment of plant height (Ph), the stem diameter (Sd), the number of leaves (Nl) and leaf area (LA), were carried out at 15, 30, 45, 60 and 75 DAS. The plant height was measured with a measuring tape (cm), from the beginning of the stem to the end of the terminal bud. The stem diameter was measured 3 cm from the ground, with an electronic digital caliper. The number of leaves per plant included those of 4 cm or greater. The FA per plant was determined with the measurement of the distance from the apex of the midrib at the base of the leaf, according to the method proposed by Maldener et al. (2009) and equation 1.
 ()1
()1
where
FA: total leaf area (cm2).
L: midrib length (cm).
In addition, the days for inflorescence exposure (R4), the total inflorescence opening (R5) and the bloom length were recorded. In this case, according to Schneiter and Miller (1981) it terminates at the end of the anthesis; the inner diameter (IDC) and external (EDC) of the flower were recorded with a millimeter rule. The IDC measure included the flower only and for the EDC the ligulate flowers was measured. CC was evaluated at 30 and 45 DAS with a portable chlorophyll monitor (Minolta, Japan, model SPAD-502) and expressed as mg m-2. This content corresponds to the difference in the optical density between two wavelengths from different crops as an indicator of the nutritional state of the leaf blade (Rodrigues, 2004). The measurements were made between 9:00 and 12:00 h. CC was the average of the measurements on three leaves per plant. Due to the direct relationship between the contents of N and chlorophyll, one of the uses of the SPAD-502 was also to estimate the content of N the leaves (Marenco and Lopes, 2007).
The results were assessed with an ANOVA. Because the results are quantitative factors, to determine the regression by orthogonal polynomials the SISVAR-ESAL software (Ferreira, 2011) was used. In those cases in which there were significant differences the regression coefficients were calculated.
Results and Discussion
The salinity of irrigation water significantly affected the Ph, Nl and LA from 15 to 75 DAS, and the stem diameter 30 DAS. The effect due to nitrogen fertilization or interaction water salinity×N dosage was not significant on these variables (Table 2).
Table 2 F test and linear regression of variables of sunflower cv. EMBRAPA 122-V2000 during growth as a function of irrigation water salinity and nitrogen fertilization.

DF: degrees of freedom; CV: coefficient of variation; **: p≤0.01; ns: not significant.
With the regression equation, we verified that the plant height adjusted to a linear model, and for each increase unit in ACEa reduction occurred approximately 8.74, 12.49, 12.74, 10.75 and 10.04 % at 15, 30, 45, 60 and 75 DAS (Figure 1A). Flowers (2004) reported that the reduction of plant growth under salt stress is due excess of certain ions accumulation in the plant tissues, reduction in the osmotic potential of soil solution, possible toxicity of ionic and nutritional instability. Nobre et al. (2010) observed that the sunflower plant height was linearly and negatively affected by the water salinity of the irrigation from 0.5 dS m-1.
Every unit increase in the ECa the stem diameter decreased 8.62, 9.52, 11.02 and 11.03 % at 30, 45, 60 and 75 DAS (Figure 1B). Plants in high salts concentration environments are stressed by the limited soil water availability, decrease in osmotic potential in the root area and the high concentrations of specific ions effect (Gheyi et al., 2010). Depending on the salinity, plants may not absorb water and may even lose it, with which growth slows (Dias et al., 2003). Stem diameter linearly decreased from 0.15 to 0.62 mm in sunflower cv. EMBRAPA122-V2000 plants when ECa increased from 1 to 5 dS m-1 (Travassos et al., 2009).

Figure 1 Plant height (A) and stem diameter (B) of sunflowers cv. EMBRAPA 122-V2000 as a function of water of irrigation salinity (ECa) at 30, 45, 60 and 75 d after sowing.
The number of leaves (Figure 2A) also linearly dropped, 6.20, 6.37, 7.09, and 4.09 % at 15, 30, 45 and 60 DAS, for every increase unit in the ECa. According to Travassos et al. (2009), with ECa varying from 1 to 5 dS m-1 the initial growth of the sunflower cv. EMBRAPA 122-V2000 linearly reduced the number of leaves at 28 DAS and it was water salinity dependent. Oliveira et al. (2010) reported similar results in sunflowers.
With the LA regression equations the variable adjustment was verified to a decreasing linear model, with 14.85, 14.88, 16.92, 17.07 and 16.7 % reductions at 15, 30, 45, 60, 75 DAS, for each ECa unit increase (Figure 2B). Oliveira et al. (2010) found that sunflower LA decreased (101.37 LA cm2 per salinity unit increase) linearly with the increase in water irrigation salinity. Silva et al. (2009) verified that the increase in the ECa of the nutrient solution significantly reduced the total dry biomass accumulation in ornamental sunflower, which affected LA. According to Tester and Davenport (2003), the decrease in plants LA in saline conditions may be related to the mechanisms of plants to salt stress adaptation, with a the decrease on the breathable surface. During growth, LA was more affected by ECa increase. 60 DAS the number of leaves decreased 17.07 % and 4.09 %.

Figure 2 Number of leaves (A) and leaf area (B) of sunflowers cv. EMBRAPA 122-V2000, as a function of water of irrigation salinity at 15, 30, 45, 60 and 75 d after sowing.
The salinity of the irrigation water significantly affected the days for the phenological stages of the inflorescence R4, R5, CID and CED (Table 3). Fertilization with N and the salinity of the water×N dosage interaction did not exert a significant effect on these variables. Cc showed that salinity has a significant effect 45 DAS, and the nitrogen fertilization at 30 and 45 DAS. The salinity of the water of irrigation x nitrogen dosage interaction had no significant effect on the referred variable.
The variables in R4 (inflorescence initial opening) and R5 (complete inflorescence opening) (Figures 3A and 3B) showed linear and growing behavior as ECa increase took place, in such a way that for the lower saline level (0.7 dS m-1) R4 occurred at 50 DAS, and the highest (4.7 dS m-1) R4 happened 55 DAS. This increase in the days, represents an 10.99 % increase between the smallest and largest ECa. In a similar manner, the 0.7 dS m-1 salinity of the R5 occurred 55 DAS, and the 4.7 dS m-1 salinity came to pass 60 DAS. This increase in the days is 10.17 % between the smallest and largest ECa.
The difference in days between both variables was around 5 d. This happened because the sunflower phenological phases happen simultaneously. According to Escalante-Estrada et al. (2007) on sunflowers with nitrogen fertilization in Mexico, anthesis took place 58 DAS. Thus, the results in our study coincide with those authors. Also, Olalde-Gutiérrez et al. (2000) observed that R4 occurred at 54 DAS in sunflower.
Table 3 F test and linear regression of the initial inflorescence opening (R4), total inflorescence opening (R5), flower inner diameter (CID), flower outer diameter (COD) and chlorophyll content in sunflower cv. EMBRAPA 122-V2000, as a function of salinity of irrigation water and nitrogen fertilization.

GL: Degree of freedom; CV: coefficient of variation; **: p≤0.01; *: p≤0.05; ns: not significant.
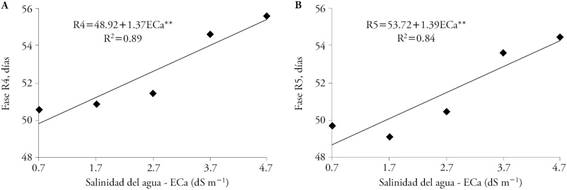
Figure 3 Initial inflorescence opening, phase R4 (A) and complete inflorescence opening, phase R5 (B), of sunflower cv. EMBRAPA 122-V2000, days after sowing, as a function of salinity of the irrigation water.
The regression equations of internal and external diameters of the flower verified that these adjusted to a decreasing linear model (Figures 4A and 4B) with the increase of the salinity in the irrigation water. With 0.7 dS m-1 the CID was 11.03 cm and with 4.7 dS m-1 was 7.59 cm. This represents a reduction of 31.19 %, and is equivalent to the loss of 7.39 % for each unit increase in RCTs. The reduction of the CED was similar, with 0.7 dS m-1 was 25.72 cm and 4.7 dS m-1 was 20.20 cm; thus, it decrease 21.46 % or 5.17 % for each unit increase in the EC of the irrigation water. Nobre et al. (2010) evaluated the growth and flowering variables of sunflowers frowth under salinity stress and nitrogen fertilizer; they reported significant effects in CED and CID with a 4.1 and 7.6 % reduction for each unit of ECa increase (dS m-1).

Figure 4 Inner diameter of flower (A) and external diameter of flower (B) of sunflower cv. EMBRAPA 122-V2000 days after sowing, as a function of salinity of the irrigation water.
At 45 DAS the Cc inversely decreased with increasing salinity. With a salinity of 0.7 at dS m-1 Cc was 45.27 with 4.7 dS m-1 Cc was 42.83, which is a 5.39 % decrease. That is, the decrease was 1.33 % per unit of increase in ECa (Figure 5A). With age, leaves increase their capacity to produce photoassimilates until maturity (45 DAS), when photosynthesis rates begin to decrease, senescent leaves were yellowish, the reason for which they do not perform photosynthesis, their chlorophyll is degraded and their chloroplast loses functionality (Taiz and Zeiger, 2009).
Salt stress decreases growth parameters such as LA, due to the decrease in photosynthesis and chlorophyll degradation (Jamil et al., 2007). Santos (2004) noted that salt stress dramatically affected chlorophyll synthesis in sunflower leaves 45 DAS, since NaCl promotes the reduction of aminolevulinic acid, which is the precursor of proctoclorophyl.
The regression equation showed that the effect of the N on Cc was linear and increasing between 30 and 45 DAS. On the 50 mg kg-1 treatment, the Cc 30 DAS was 40.76 mg m-2 and with 150 mg kg-1 was 44.66 mg m-2; these was a 9.57 % increase, equivalent to 0.10 % per unit increase of N. Whit 50 mg kg-1 Cc at 45 DAS, it was 42.36 mg m-2 and with 150 mg kg-1 was 45.76 mg m-2; this is an increase of 8.03 % in Cc, or 0.08 % per N unit increase (Figure 5B). Azevedo et al. (2011) assessed the chlorophyll fluorescence, as a tool to evaluate sunflower tolerance to salinity. They concluded that salinity increased some fluorescence parameters, and the effect was greater in genotypes Helium-358, AG-960 and AG-967 (66, 75 and 82 %, respectively) and lower in AG-975 (32 %).

Figure 5 Chlorophyll content in sunflower leaves cv. EMBRAPA 122-V2000 as a function of salinity of irrigation water at 45 DAS (A) and nitrogen fertilization at 30 and 45 DAS (B).
Between Ph, DC, NF and LA, the latter showed the higher sensitivity to the salinity increase in the irrigation water. In addition, this increase delayed the time for the inflorescence total opening (R5 phase). With the exception of the chlorophyll content, increasing the levels of N do not mitigate the adverse effects of salt stress.
Conclusions
Ph, Sd, Nl and AF from the sunflower cv. EMBRAPA 122V2000 decreased with the increase in the salinity of irrigation water. The most affected variable was LA and Nl was the least affected. The salinity of irrigation water and N interaction had no effects on the growth variables, the exception was Ph at 15 DAS. The increase in the salinity of the irrigation water delayed the initial and total inflorescence opening and the internal and external floral diameters decreased. The chlorophyll content decreased with the increased salinity and increased with the N level
Literatura Citada
Azevedo N., A. D., P. P. A. Pereira, D. P. Costa, e A. C. C. Santos. 2011. Fluorescência da clorofila como uma ferramenta para seleção de tolerância ao estresse salino em girassol. Rev. Ciênc. Agron. 42: 893-897. [ Links ]
Caterina, R.D., M.M. Giuliani, T. Rotunno, A. de Caro, and Z. Flagella. 2007. Influence of salt stress on seed yield and oil quality of two sunflower hybrids. Ann. Appl. Biol. 151: 145-154. [ Links ]
Coelho, M. A. e N. B. Soncin. 1982. Geografia do Brasil. São Paulo: Moderna. 368 p. [ Links ]
Conus, L.A., P.C. Cardoso, L. dos R. Venturoso, e S. de P.Q. Scalon. 2009. Germinação de sementes e vigor de plântulas de milho submetidas ao estresse salino induzido por diferentes sais. Rev. Bras. Sementes 31: 67-74. [ Links ]
Cruz, T. V., C. P. Peixoto, e M. C. Martins. 2010. Crescimento e produtividade de soja em diferentes épocas de semeadura no Oeste da Bahia. Sci. Agrar. 11: 33-42. [ Links ]
Dias, N. S., H. R. Gheyi, e S. N. Duarte. 2003. Prevenção, manejo e recuperação dos solos afetados por sais. Departamento de Engenharia Rural. ESALQ/USP. Piracicaba. 118 p. [ Links ]
Empresa Brasileira de Pesquisa Agropecuária. 1997. Manual de Métodos de Análise de Solo. 2 ed. Centro Nacional de Pesquisa de Solos. Rio de Janeiro. 212 p. [ Links ]
Escalante-Estrada, L. E., Y. E. Escalante-Estrada, y C. Linzaga-Elizalde. 2007. La fertilización nitrogenada en el rendimiento del girasol en México. Agr. Costarr. 31: 95-100. [ Links ]
Ferreira, D. F. 2011. Sisvar: A computer statistical analysis system. Ciênc. Agrotec. 35: 1039-1042. [ Links ]
Flowers, T. J. 2004. Improving crop salt tolerance. J. Exp. Bot. 55: 307-319. [ Links ]
Gheyi, H.R., N.S.Dias, e C.F.Lacerda. 2010. Manejo da salinidade na agricultura: Estudos básicos e aplicados. Fortaleza: Instituto Nacional de Ciência e Tecnologia em Salinidade-INCT sal. 472 p. [ Links ]
Jamil, M.K., S.U.Rehman, K.J.Lee, J.M.Kim, H.S.Kim, and E.S.Rha. 2007. Salinity reduced growth PS2 photochemistry and chlorophyll content in radish. Sci. Agric. 64: 111-118. [ Links ]
Macedo, M.C., S.P.Q. Scalon, A.P. Sari, H. Scalon Filho , Y.B.C.J. Rosa, e A.D. Robaina. 2009. Biometria de frutos e sementes e germinação de Magonia pubescens ST,Hil Sapindaceae. Rev. Bras. Sementes 31: 202-211. [ Links ]
Maldener, I.C., A.B. Heldwein, L.H. Loose, D.D.P. Lucas, F.L. Guse, e M. P. Bortoluzzi. 2009. Modelos de determinação não destrutiva da área foliar em girassol. Ciênc. Rural 39: 1356-1361. [ Links ]
Marenco, R.A., N.F. Lopes. 2007. Fisiologia Vegetal: Fotossíntese, Respiração, Relações Hídricas e Nutrição Mineral. 2 ed. Editora UFV. Viçosa. 469 p. [ Links ]
Nobre, R. G., H.R. Gheyi , F.A.L. Soares, e J.A.F. Cardoso. 2011. Produção do girassol sob estresse salino e adubação nitrogenada. Rev. Bras. Ciênc. Solo 35: 929-937. [ Links ]
Nobre, R.G., H.R.Gheyi , K.G. Correia, F.A.L.Soares, e L.O. deAndrade. 2010. Crescimento e floração do girassol sob estresse salino e adubação nitrogenada. Rev. Ciênc. Agron. 41: 358-365. [ Links ]
Novais, R.F., J.C.L.E.Neves, e N.F.Barros. 1991. Ensaio em ambiente controlado. In: Oliveira, A. J. Métodos de pesquisa em fertilidade do solo. Brasília, EMBRAPA-SEA 189-253. [ Links ]
Olalde-Gutiérrez, V.M., J. A.Estrada-Escalante, P. S.García, L.T. Chávez, A.A. Lagunas-Mastache, y E.C. Román. 2000. Crecimiento y distribución de biomasa en girasol en función del nitrógeno y densidad de población en clima calido. Terra 18: 314-323. [ Links ]
Oliveira, F. A., F.R.A.Oliveira, M.S.Campos, M.K.T.Oliveira, J.F.Medeiros, e O.M.P.Silva. 2010. Interação entre salinidade e fontes de nitrogênio no desenvolvimento inicial da cultura do girassol. Rev. Bras. Ciênc. Agrár. 5: 479-484. [ Links ]
Peixoto, C.P., J.A.Gonçalves, M.F.S.P.Peixoto, e D.O.Carmo. 2008. Características agronômicas e produtividade de amendoim em diferentes espaçamentos e épocas de semeadura no Recôncavo Baiano. Bragantia 67: 563-568. [ Links ]
Rodrigues, M. A. 2004. Establishment of continuous critical levels for indices of plant and preside dress soil N status in the potato crop. Commun. Soil Sci. Plan. 35: 2067-2085. [ Links ]
Santos Júnior, J.A., H.R. Gheyi, D.H.GuedesFilho, N.S.Dias, e F.A.L.Soares. 2011. Cultivo de girassol em sistema hidropônico sob diferentes níveis de salinidade. Rev. Ciênc. Agron . 42: 842-849. [ Links ]
Santos, C.V. 2004. Regulation of chlorophyll biosynthesis and degradation by salt stress in sunflower leaves. Scientia Horticulturae 103: 93-99. [ Links ]
Schneiter, A.A., and J.F.Miller. 1981. Description of sunflower growth stages. Crop Sci. 21: 901-903. [ Links ]
Silva, M.L.O., M.A.F.Farias, A.R.Morais, G.P.Andrade, e E.M.C.Lima. 2007. Crescimento e produtividade do girassol cultivado na entressafra com diferentes lâminas de água. Rev. Bras. Eng. Agríc. Ambient. 11: 482-488. [ Links ]
Silva, T.G.F. da, S.Zolnier, J.A.SGrossi, J.G.Barbosa, C.R.W.Moura, e M.A.Muniz. 2009. Crescimento do girassol ornamental cultivado em ambiente protegido sob diferentes níveis de condutividade elétrica de fertirrigação. Ver. Ceres 56: 602-610. [ Links ]
Taiz, L., and E. Zeiger. 2009. Plant Physiology. 4 ed. Sunderland: Sinauer Associates Inc Publishers. 848 p. [ Links ]
Tester, M., and R. Davenport. 2003. Na+ tolerance and Na+ transport in higher plants. Ann. Bot. 91: 503-527. [ Links ]
Torres, A.N.L., P.R.G. Pereira, J.T. Tôrres, G.J.M. Gallotti, J.A. Pilati, J.A. Rebelo, e H. Henkels. 2004. A salinidade e suas implicações no cultivo de plantas. Florianópolis: Epagri, Epagri-Documentos 215. 54 p. [ Links ]
Travassos, K.D., D.R.S. Silva, A.K.S. do Nascimento, F.A.L. Soares, e H.R. Gheyi. 2009. Crescimento inicial do girassol sob estresse salino. In: Congresso Brasileiro de Engenharia Agrícola. Anais. Petrolina: SBEA. 4 p [ Links ]
Received: February 2016; Accepted: March 2016
 Este es un artículo publicado en acceso abierto bajo una licencia Creative Commons
