


Serviços Personalizados
Journal
Artigo
 texto em
  Inglês (pdf)
 Artigo em XML
 Referências do artigo
 Enviar este artigo por email
Indicadores
-
 Citado por SciELO
 -
 Acessos
Links relacionados
-
 Similares em
SciELO
Similares em
SciELO
Compartilhar

 Permalink
Agrociencia
versão On-line ISSN 2521-9766versão impressa ISSN 1405-3195
Agrociencia vol.51 no.6 Texcoco Ago./Set. 2017
Water-Soils-Climate
INTENSITY-DURATION-FREQUENCY CURVES OF SHORT-DURATION STORMS IN THE SEGURA RIVER BASIN, SPAIN
1Departamento de Ciencias Politécnicas, Escuela Universitaria Politécnica, UCAM Universidad Católica San Antonio de Murcia, Campus de los Jerónimos, no. 135, 30107 Murcia, España (jperez058@ucam.edu)
In semi-arid climates, the intensities of short-duration storms (less than 60 min) usually cause the largest floods and, therefore, they are important to design and calculate engineering works and hydrological planning. The objective of this study was to obtain Intensity-Duration-Frequency curves of storms in the Segura River Basin located in southeastern Spain, and to determine which probability distribution functions (FDP) best fit the data of the 60 precipitation stations in the basin. For each station, the annual maximum storm intensities were obtained in 15, 30, and 60 min intervals for a common period of 21 years. The FDP studied were Gumbel, TERC, Log Pearson Type III and GEV. The results were compared using the mean absolute deviation (DAM) and the standard error of the mean (EEM). The best fit was obtained with the Gumbel function (45 % of the stations), followed by the GEV (32 %). The analytical expressions of the Intensity-Duration-Frequency curves obtained for each station will provide for a given return period and duration the rain intensities at any point in the basin, through an inverse square relationship.
Key words: extreme events; probabilistic analysis; IDF curves
Las intensidades de tormentas de duración corta (inferiores a 60 min) en los climas semiáridos son importantes para el diseño y cálculo de obras de ingeniería y la planificación hidrológica porque suelen provocar las mayores crecientes en estas zonas. El objetivo de este estudio fue obtener curvas de Intensidad-Duración-Frecuencia de tormentas para la cuenca del río Segura, situada en el sureste de España, y determinar cuáles de las funciones de distribución de probabilidad (FDP) se ajustan mejor a los datos de las 60 estaciones pluviográficas en la cuenca. Para cada una de las estaciones se obtuvieron las intensidades máximas anuales de tormenta en los intervalos de tiempo de 15, 30 y 60 min para un período común de 21 años. Las FDP estudiadas fueron Gumbel, TERC, Log Pearson tipo III y GEV. La comparación de los resultados se realizó con la desviación absoluta media (DAM) y el error estándar medio (EEM). El mejor ajuste se obtuvo con la función de Gumbel para 45 % de las estaciones, seguida de la GEV para 32 %. Las expresiones analíticas de las curvas Intensidad-duración-Frecuencia obtenidas para cada estación permitirán obtener, para un período de retorno y una duración dados, las intensidades de lluvia en cualquier punto de la cuenca mediante relaciones inversas del cuadrado.
Palabras clave: eventos extremos; análisis probabilístico; curvas IDF
Introduction
Precipitation as a hydrological state variable can be characterized by its intensity, distribution in space and time, and occurrence frequency or probability. In order to achieve this, numerous observations extracted from pluviographic series are necessary, defining the behavior pattern in a given area and allowing a later analysis or use. The most frequently used methodology is related to the Intensity-Duration-Frequency curves (IDF) that are used in hydrological engineering for the proposal, design, and operation of hydraulic projects, and engineering works for protection against maximum flash floods (Koutsoyiannis et al., 1998).
In the early 1930s, Sherman (1931) and Bernard (1932) set out the first mathematical relationships. Svensson et al. (2007), Antigha and Ogarekpe (2013), and Elsebaie (2012) developed and specified mathematical expressions in Scotland, Nigeria, and Saudi Arabia, respectively. The results are graphically represented through maps of the rain intensity for different duration and return periods (Pereyra et al., 2004). The IDF curves are also one of the most frequently used tools to estimate design storms in sites where there is not enough information about flow rates and discharge flows (Vélez et al., 2002).
In order to develop the IDF curves, the maximum intensity values must be fitted to one FDP, which varies according to the zone modeled. In the Netherlands, Overeem et al. (2008) used the GEV function, because it has more conservative values for high return periods than the Gumbel distribution. In Saudi Arabia, Al-Anazi and El-Sebaie (2013) tested Gumbel, Log Pearson Type III,and Log Normal distributions, and they obtained good results in goodness-of-fit tests for all of them. Svensson and Jones (2010) studied the distribution functions used in the world and indicated that the most frequently used distribution function was the GEV. In Spain, the Gumbel function was frequently used until 20 years ago. Currently, the most recommended function used in official publications (Ministerio de Fomento, 1999) is the SQRT-ET max distribution, known in Mexico as TERC (square-root exponential type). For maximum precipitations, Salas and Fernández (2007) recommend the use of TERC instead of Gumbel, GEV, Log Pearson Type III, and Two-component extreme value distribution (TCEV) (Rossi et al., 1984).
In the case of the areas under study, the climatic conditions of the Segura River Basin which have very extensive and extremely low flow cause short-duration and high-intensity rains. Usually, these rains result in floods with overflows and maximum flows of the same nature as the greater known values in the world for basins with similar area (Pérez and Gil, 2012, Romero and Maurandi, 2000). Therefore, in this type of semi-arid regions, establishing IDF relationships is necessary to define short-duration storms (less than 60 minutes) for proper hydrological and hydraulic planning and management, as well as for the correct sizing of infrastructures (Jiang and Tung, 2013).
The objective of this study was to obtain the IDF curves for 15, 30, and 60 min intervals in the Segura River Basin, located in southeastern Spain, and to determine which of the FDPs studied fits better each one of the stations under consideration. In addition, the analytical expressions of the IDFs in the those stations will conform a source of information that will allow researchers to find out the intensity of rain required in any place of this basin, depending on the return period under consideration.
Materials and Methods
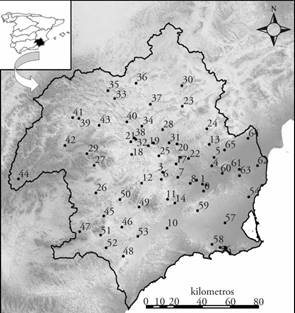
The Segura River Basin is located in the southeast of Spain (Figure 1) and it has an area of 18208 km². The height zoning results in the following distribution: 18 % of the area is located below 200 m altitude, 40 %, below 500 m, and 81 %, below 1000 m. Its streams transport small magnitude flows (65 Mm³ total) that are consumed locally, without providing significant returns to the Segura River. The meteorological station network managed by the organization of the Segura River Basin (Confederación Hidrográfica del Segura) is composed of 66 stations (Figure 1). The data provided by each pluviograph consist of rainfall records (every 5 min), from the hydrological 1992-1993 year to the 2012-2013 year. Of the 66 initial stations, stations number 2, 39, and 40 were discarded due to lack of records in several years. For each one of the remaining 63 stations, the maximum annual intensities were obtained in 15, 30 and 60 min intervals, since there are precedents of short rains of great intensity and high impact that caused serious material damages. All this has an impact on their relevance (Machado et al., 2011; Hooke and Mant, 2002). These storms determine the sizing of rainwater harvesting systems and storm tanks; therefore, information about rainfall with specific duration and frequency is necessary (Jiang and Tung, 2013).
In order to verify the independence and homogeneity of the recorded series, the Von Neumann test (WMO, 1971) and the Wald-Wolfowitz test (Bobée and Ashkar, 1991; Rao and Hamed, 2000) were applied. The calculation of the Neuman and Wald-Wolfowitz tests was carried out using the R Core Team climtrends and randtests packages (Mateus and Caeiro, 2014). The mean value obtained with the Neumann test at the stations under study was above 2.1, for the storm durations under study, with a standard deviation of less than 0.45. Only station number 31 showed a value lower than the critical: 5 % of 1.30 for n=20 (Bartels, 1982); therefore, we decided to discard it. Finally, after the Wald-Wolfowitz test was applied, stations 20 and 38 did not guarantee the independence of the series, leaving a total of 60 stations in which the study was carried out.
With the spatial distribution of the maximum intensities for 15, 30, and 60 min durations, an interpolation of mean values and typical deviations of the intensities was carried out for the durations in each station (Figure 2).
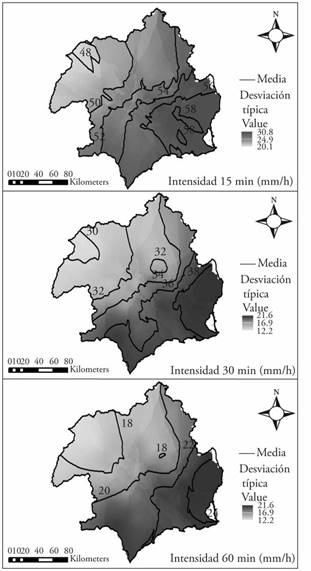
Figure 2 Spatial variation of the rain intensities statistics for 15, 30, and 60 min. in the Segura River Basin, Spain.
The interpolation was carried out with Arcmap 10.2, using an ordinary kriging with a spherical semivariogram. The intensities and their variability increase from northwest to southeast (Figure 2). For 15 min periods, approximately 54 mm h-1 mean intensities were recorded, versus 35 mm h-1 and 20 mm h-1 for 30 min and 60 min, respectively. The intensities’ standard deviations reach values higher than 30 mm h-1 for 15 min periods which means maximum intensities close to 80 mm h-1; however, if the time is extended to 30 or 60 min, these large deviations are reduced and stabilized at maximum values of 20 mm h-1.
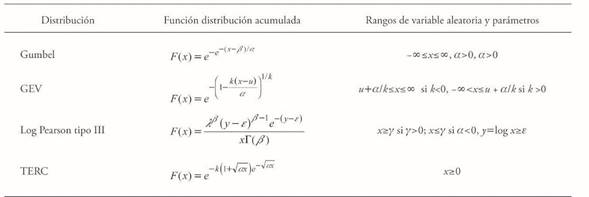
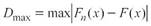
The FDPs used in this study were Gumbel, GEV, Log Pearson Type III (LPIII), and TERC (Table 1). All FDPs were adjusted using the method of moments (MO), except the GEV in which the L-moment (ML) method was used. The adjustments obtained in each station were evaluated using the Dmax (1) and Drms (2) versions of the Lilliefors test, (Hennemuth et al., 2013) and the standard error adjustment (3) (EEA) (Kite, 1977).
 ()1
()1
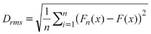 ()2
()2
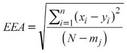 ()3
()3
where
F(x): theoretical value of the distribution function of extreme values;
F n(x): value of the empirical probability distribution function (FDP);
x i: past values of the sample;
y i: values obtained with the FDP;
n: sample size; m j:
number of parameters of the FDP.
Once the best adjusted function has been selected, the analytical expressions of the IDF curves are also obtained, using the Aparicio (1997) method, based on the following equation: I=K T m D -n (4), where T is the return period in years, D is the duration of the storm in minutes or hours, and I is the precipitation intensity in mm h-1. If logarithms are extracted from each side of the equation, the result is a multiple linear regression model of the log I=log k+m log T-n log D (5) type, where k, m, and n are the constants to be adjusted for each station. In order to verify the goodness-of-fit of the Aparicio equation (1997) in the real domain (Pandey and Nguyen, 1999), the mean absolute deviation (DAM) (6) and the standard error of the mean (EEM) (7) were used (Campos-Aranda, 2014).
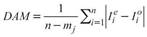 ()6
()6
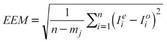 ()7
()7
where :
i i e : estimated intensity;
i i o : observed intensity
Results and Discussion
Out of 60 stations studied, 27 had the best adjustment with the Gumbel function representing 45 % of the basin, while the GEV and LPIII FDP were used in 19 and 12 stations, respectively. The TERC function only had the best adjustment in two stations. If the basic statistical parameters of the D max, D rms, and EEA values obtained for all stations are analyzed, the mean values for both D max and D rmsare very similar for all FDPs ranging from 0.15 to 0.13 for D max, and 0.07 to 0.06 for D rms. Therefore, taking into consideration only the Lilliefors test, any of the studied FDPs offers good adjustments for the Segura River Basin (Table 2). A similar behavior is observed in the coefficients of variation (CV), although they show a wider range and smaller oscillations, for the Gumbel and GEV functions.
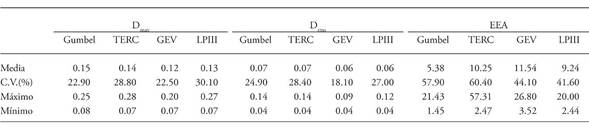
However, the major differences between the FDPs appear in the EEA. The Gumbel function has an average EEA value of 50 % less than the other functions. The maximum value of the TERC function is three times higher than other functions. The Gumbel function presents the lowest values in the basin. GEV and LPIII have an approximately 40 % variability, while the CV increases up to 60 %, for the Gumbel and TERC functions.
Table 3 includes a summary of the results obtained from the 60 stations analyzed. In addition to indicating which FDP fits better each one based on the results of the adjustment evaluation,the IDF equation (4) is set by means of the definition of the parameters on which k, m and, n depend.
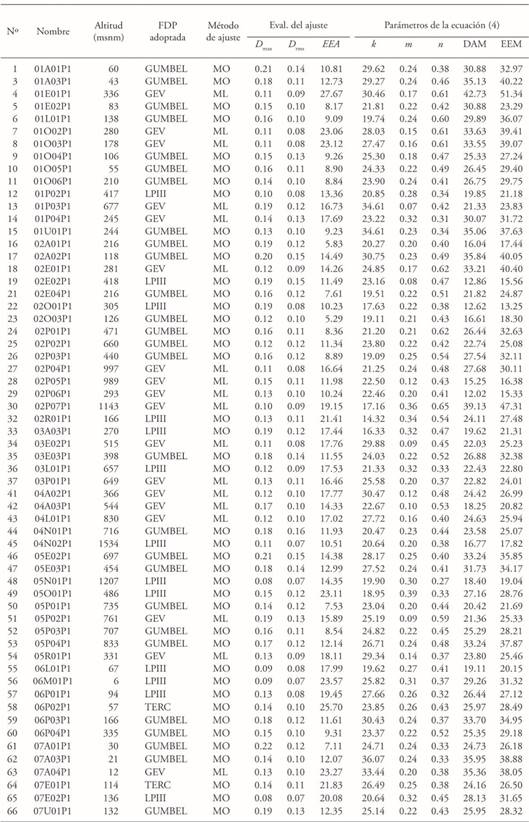
Taking into account the overall series, both DAM and EEM offer mean values around 25. with a 26 % and 28 % variability, respectively. If the goodness-of-fit is analyzed for 10+ years return periods, the values included in the table are reduced more than half in most of the cases ,because all the FDPs overestimate the intensities for less than 10 years return periods, but offer an optimal adjustment for 5-10+ return periods.
Once the parameters of each empirical equation were calculated for each one of the stations under consideration, the k, m, and n values of the equation (4) can be weighted for any locality in the Segura River Basin, Spain, based on the inverse square relationship, taking care to transport the information corresponding to the same altitudinal floor.
Conclusions
All the FDPs studied offered very similar values when the D max and D rms versions of the Lilliefors test were applied, requiring the calculation of the EEA, in order to effectively compare the FDPs and the selection of the best function for each one of the stations under consideration. The Gumbel function was better fitted to 45 % of the basin stations, the GEV in 32 %, the TERC only at two of the 60 stations. The widespread use of the TERC function in Spain requires a regionalized review and study, in order to justify or discard its use.
The analytical adjustment of the IDF curves using the linear regression method (Aparicio, 1997) showed overestimations for return periods of less than 10 years. However, the deviations for higher return periods regularly used to size hydraulic infrastructures were significantly reduced. This validates the use of expressions calculated at any point of the basin, based on the inverse square relationship of the calculated values.
Literatura Citada
Al-anazi, K.K. and I.H.El Sebaie. 2013. Development of intensity-duration-frequency relationships for Abha City in Saudi Arabia. Int. J. Comput. Eng. Res. 3: 58-65. [ Links ]
Antigha, R.E. and N.M. Ogarekpe. 2013. Development of intensity duration frequency curves for Calabar metropolis, south-south, Nigeria. Int. J. Eng. Sci. 2: 39-42. [ Links ]
Aparicio M., F.J. 1997. Fundamentos de Hidrología de Superficie. Limusa Grupo Noriega. México. 303 p. [ Links ]
Bernard, M. M. 1932. Formulas for rainfall intensities of long durations. Trans. ASCE 96: 592-624. [ Links ]
Bartels, R. 1982. The rank version of von Neumann’s ratio test for randomness. J. Am. Stat. Assoc. 77 (377): 40-46. [ Links ]
Bobée, B. and F. Ashkar . 1991. The Gamma Family and Derived Distributions Applied in Hydrology. Chapter 1: Data requirements for hydrologic frequency analysis (pp: 1-12). Littleton, Colorado, U.S.A.: Water Resources Publications. 203 p. [ Links ]
Campos-Aranda, D. F. 2014. Obtención de ecuaciones empíricas para estimación de crecientes de diseño en la Región Hidrológica No. 10 (Sinaloa) de México. Tecnología y Ciencias del Agua. 5: 125-143. [ Links ]
Elsebaie, I. H. 2012. Developing rainfall intensity-duration-frequency relationship for two regions in Saudi Arabia. J. of King Saud University-Engineering Sci. 24: 131-140. [ Links ]
Hennemuth, B. et al. 2013. Statistical methods for the analysis of simulated and observed climate data. Report 13 of the Climate Service Center. Germany. 138 p. [ Links ]
Hooke, J. M., and J. Mant. 2002. Floodwater use and management strategies in valleys of southeast Spain. Land Degrad. Dev. 13: 165-175. [ Links ]
Jiang, P., and Y.K. Tung. 2013. Establishing rainfall depth-duration-frequency relationships at daily raingauge stations in Hong Kong. J. Hydrol. 504: 80-93. [ Links ]
Kite, G. W. 1977. Frequency and Risk Analyses in Hydrology. Chapter 12: Comparison of frequency distributions. Colorado, USA: Water Resources Publications. 224 p. [ Links ]
Koutsoyiannis, D., D. Kozonis, and A. Manetas. 1998. A mathematical framework for studying rainfall intensity-duration-frequency relationships. J. Hydrol . 206: 118-135. [ Links ]
Machado, M.J., G. Benito, M. Barriendos, and F.S. Rodrigo. 2011. 500 years of rainfall variability and extreme hydrological events in southern Spain drylands. J. Arid Environ. 75: 1244-1253. [ Links ]
Mateus, A., and F. Caeiro. 2014. An R implementation of several Randomness Tests. Simos, T. E. Z. Kalogiratou, and T. Monovasilis (eds). AIP Conf. Proc. 1618: 531-534. [ Links ]
Ministerio de Fomento. 1999. Máximas lluvias en la España peninsular. http://www.fomento.gob.es/NR/rdonlyres/ABE22688-F967-4902-BA96-51FE8AB76145/55856/0610300.pdf 55 pp. (Consulta: marzo 2016). [ Links ]
Overeem, A., A. Buishand, and I. Holleman. 2008. Rainfall depth-duration-frequency curves and their uncertainties. J. Hydrol. 348: 124-134. [ Links ]
Pandey, G. R., and V. T. V. Nguyen. 1999. A comparative study of regression based methods in regional flood frequency analysis. J. Hydrol . 225: 92-101. [ Links ]
Pereyra D., D., J. A. A. Pérez S., y L. Gómez R. 2004. Ecuaciones que estiman las curvas intensidad-duración-periodo de retorno de la lluvia. Geos 24: 46-56. [ Links ]
Pérez M., A., y S. Gil G. 2012. La avenida de 22 de octubre de 1948 en la cuenca del Segura. Revisión y análisis. Estudios Geogr. 73: 163-187. [ Links ]
Rao, A. R., and K. H. Hamed. 2000. Flood Frequency Analysis. Theme 1.8: Tests on hydrologic data (pp: 12-21). Boca Raton, Florida, U.S.A.: CRC Press. 350 p. [ Links ]
Romero D., A., y A. Maurandi G., 2000. Las inundaciones en la cuenca del Segura en las dos últimas décadas del siglo XX. Actuaciones de prevención. Serie geográfica 9: 93-120. [ Links ]
Rossi, F., M. Fiorentino, and P. Versace. 1984. Two-component extreme value distribution for flood-frequency analysis. Wat. Resour. Res. 20 (7): 847-856. [ Links ]
Salas R., L., and J. A. Fernández Y. 2007. In-site regionalization to estimate an intensity-duration-frequency law: a solution to scarce spatial data in Spain. Hydrol. Process. 21: 3507-3513. [ Links ]
Sherman, C.W. 1931. Frequency and intensity of excessive rainfall at Boston, Massachusetts. T. Am. Soc. Civ. Eng. 95: 951-960. [ Links ]
Svensson, C., R.T. Clarke, and D.A. Jones. 2007. An experimental comparison of methods for estimating rainfall intensity-duration-frequency relations for fragmentary records. J. Hydrol . 341: 79-89. [ Links ]
Svensson, C., and D.A. Jones . 2010. Review of rainfall frequency estimation methods. Centre for ecology and hydrology. Wallingford. 33 p. [ Links ]
Vélez, J.I., G. Poveda, O. J. Mesa, L.F. Salazar, S. C. Viera, J. F. Mejía, C. D. Hoyos, y D. I. Quevedo. 2002. Aplicación de diferentes metodologías para estimación de curvas intensidad-frecuencia-duración en Colombia. In: Memorias XX Congreso Latinoamericano de Hidráulica. 1-5 octubre. Ciudad de La Habana, Cuba. [ Links ]
WMO. 1971. Annexed III: Standard tests of significance to be recommended in routine analysis of climatic fluctuations. Climatic Change. Technical Note No. 79. Geneva, Switzerland: Secretariat of the World Meteorological Organization. Reprinted. pp: 58-71. [ Links ]
Received: October 2016; Accepted: April 2017
 Este es un artículo publicado en acceso abierto bajo una licencia Creative Commons
