


Serviços Personalizados
Journal
Artigo
 texto em
  Inglês (pdf)
 Artigo em XML
 Referências do artigo
 Enviar este artigo por email
Indicadores
-
 Citado por SciELO
 -
 Acessos
Links relacionados
-
 Similares em
SciELO
Similares em
SciELO
Compartilhar

 Permalink
Agrociencia
versão On-line ISSN 2521-9766versão impressa ISSN 1405-3195
Agrociencia vol.51 no.4 Texcoco Mai./Jun. 2017
Water-soils-climate
Regulated deficit irrigation evaluation on kiwi (Actinidia deliciosa) production
1Water Research Center for Agriculture and Mining Chillán, Facultad de Ingeniería Agrícola, Universidad de Concepción. Vicente Méndez 595, Chillán, C.P. 537. Chile. (octaviolagos@udec.cl).
2Instituto de Investigación Agropecuaria, Chillán, Chile.
Controlled deficit irrigation (CDI) is a management strategy where water is applied according to the crop phenological stages. As a result, different irrigation management conditions can produce significant changes in production, fruit quality and the reduction in the applied total water volume. The objective of this research was to evaluate the effect of CDI on the production and quality of kiwi (Actinidia deliciosa) Hayward, in Chile. During the production cycles from 2009 to 2012 four water restriction periods were applied: 1) from 10 d to 30 d before flowering, 2) when fruits reached 60 % of their final weight, 3) when fruits reached more than 70 % of the final weight, and 4) when fruits reached more than 80 % of their final weight. The results of each restriction period were compared with a control treatment which had a 100 % evapotranspiration replacement. The experimental design was completely randomized in blocks with four replicates per treatment. The experimental unit was of three rows of seven plants each. Treatment means were compared by the Tukey test (p≤0.05). Throughout the study, soil moisture, water status of the plant, applied water volume, fruit development and uniformity were measured. The main results were the decrease of water volume and its associated costs of pumping between 24 and 60 % compared to the control treatment; the applied CDI showed significant differences (p≤0.05) on the size in the evaluated years. With CDI there was good uniformity in 24.2 % of the fruits without effects on productivity (p>0.05).
Keywords: water stress; quality; water production; water and energy saving
El riego deficitario controlado (RDC) es una estrategia de manejo donde se aplica agua según las etapas fenológicas del cultivo. Como consecuencia, condiciones diferentes del manejo del riego pueden producir cambios importantes en la producción, calidad de la fruta y una disminución del volumen de agua utilizado. El objetivo de esta investigación fue evaluar el efecto de RDC en la producción y calidad del kiwi (Actinidia deliciosa) Hayward, en Chile. Durante los ciclos de producción de 2009 al 2012 se aplicaron cuatro periodos de restricción hídrica: 1) desde 30 d y hasta 10 d antes de la floración, 2) cuando el fruto alcanzó más de 60 % del peso final, 3) cuando el fruto alcanzó más de 70 % del peso final y 4) cuando el fruto alcanzó más de 80 % del peso final. Los resultados de cada período de restricción fueron comparados con un tratamiento testigo con 100 % de reposición de la evapotranspiración. El diseño experimental fue de bloques completamente al azar con cuatro repeticiones por tratamiento y la unidad experimental fue de tres hileras de siete plantas cada una. Las medias de tratamientos se compararon con la prueba de Tukey (p≤0.05). Durante todo el estudio se midió humedad del suelo, estado hídrico de la planta, volúmenes de agua aplicados, desarrollo y uniformidad del fruto. Los resultados principales fueron: disminución del volumen de agua y costos asociados al bombeo entre 24 y 60 %, respecto al tratamiento testigo; el RDC aplicado mostró diferencias significativas (p≤0.05) en calibre para los distintos años de estudio. Con RDC hubo una buena uniformidad en 24.2 % de los frutos sin efectos en la productividad (p>0.05).
Palabras clave: estrés hídrico; calidad; agua-producción; ahorro agua y energía
Introduction
World production of kiwi (Actinidia deliciosa) is led by Italy, New Zealand, Chile and Greece, which account for 82 % of the world production. Chile has 10 569 ha planted with kiwi and is the third largest world exporter of this fruit. Its production has had a continuous increase in its export value. Between 2012 and 2013, these had similar exports volume, which increased 22.5 % (ODEPA, 2014). To increase the competitiveness of this fruit in the international market, it is necessary to minimize its costs production, mainly water and energy.
Water stress and irrigation management during the development of some fruits can produce significant changes in their yield and fruit quality (Reid et al., 1996). In grapevines (Vitis vinifera) the effect of water volumes and frequency of irrigation in the production and quality of fruit and wine were evaluated (Ambrosio et al., 2008; Collins et al., 2008; Chalmers et al., 2008). Bonany and Camps (1998), Leib et al. (2006) and O ‘Connell et al. (2008) showed that an applied water reduction decreased the apple (Malus communis) fruit size, but increased its firmness. Ferreyra et al. (1998) reported the effect of water deficit in kiwi, grapes, apple and peach (Prunus persica).
Proper water management in fruits during their development improves production, quality and size of the fruits, besides of its postharvest life, water use efficiency, efficient energy use and profitability. Thus, the use of new production processes and innovative technologies that improve crop water status offers new opportunities for water management in fruit (Ferreyra et al., 1998). In particular, controlled deficit irrigation (CDI) is a water management strategy in which water application is conditioned by the phenological stages of crop or fruit development.
The CDI can be useful when moderately performed during a specific period of fruit growth, because, due to the caused stress, favorable changes in the fruit quality may have happened (Miller et al., 1998). In some cases, the application of the CDI may reduce production compared to traditional irrigation, but can improve the quality of the end product (Zhang and Oweis, 1999). According to Currie et al. (2008), irrigation deficit applied to orchards of kiwi from the Hayward variety increases dry matter, hardens the fruit and helps to extend its postharvest life. Nevertheless, it could not ensure crop planning, as it promotes fruit early ripening, nor would it allow to estimate the fruit size, because the effect in the size would greatly depend on the phenological state in which the stress was applied. In young kiwi plants, rooted in a ditch with a removable polyethylene surface in order to strictly control their water supply, fruit growth, plant water potential and stomatal resistance was assessed throughout the season; there was great variability in the fruit size, but the harvested fruit was not affected by the water stress (Judd et al., 1989).
The CDI requires precise knowledge of the crop’s response to water stress, such as drought tolerance, which varies according to the genotype and phenological stage. To design successful CDI strategies, both from the developmental and optimization perspectives, it should be combined with agricultural productivity modeling and field research (Geerts and Raes, 2009).
Therefore, the objective of this research was to evaluate the effect on production and quality in kiwifruit, by applying different CDI strategies during the crop production and development. Our hypothesis was that an adequate irrigation management, through CDI strategies at the time of fruit ripening, improves quality and the postharvest life of kiwifruit.
Materials and Methods
The study was conducted in a kiwi plantation at Las Rosas, Maule Region, Chile (36° 00’ S and 71° 40’ W). The area has a temperate Mediterranean climate with six months of dry season. The mean temperature is 19 °C, with extreme high 30 °C in summer. In winter the mean minimum temperature is 7 °C (BCN, 2014). Rainfall is abundant during the invernal season, exceeding 500 mm between May and August (BCN, 2014).
In order to assess soil texture, field capacity (FC), wilting point (WP), soil bulk density and soil particle size analysis with the hydrometer method (Bouyoucos) were performed. Also, the air pressure method (5-15 bar Ceramic Plate Extractor, Soil Moisture Equipment Corp., Santa Barbara, CA, USA) and the lump method were performed. All analyses were carried out as proposed by Sandoval et al. (2012) at the Water Resources Laboratory of the Facultad de Ingeniería Agrícola, Universidad de Concepción. The upper soil profile (0-0.3 m) has a loam to clay loam texture, with a retention capacity average humidity of 60 mm, bulk density of 1.49 g cm-3, FC of 0.39 and WP of 0.19 m3 m-3. Regard depth (0.3-1.2 m), soil is a loam to sandy loam, with moisture retention capacity of 53 mm, bulk density of 1.5 g cm-3, FC of 0.32 m3 m-3 and WP 0.14 m3 m-3. The plantation was established in 2000, with a planting of 4 m by 4.5 m on and between rows, each, conducted in Spanish vine arbour. The used irrigation system was micro-irrigation, with an emitter (Modular model, brand DAN, Israel) of 47 L h-1 per plant and an approximate operation pressure of 13 m.c.a.
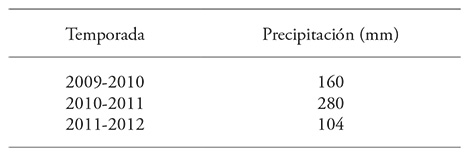
This research was conducted during three productive seasons (2009-2010, 2010-2011 and 2011-2012), the registered precipitations are shown in Table 1 (Davis Vantage Pro2, Davis Instruments Corporation, Hayward, CA, USA).
The experimental design was of complete randomized blocks with five treatments, a control (T0) and four corresponding strategies CDI (T1, T2, T3 and T4), four replicates and each experimental unit was composed of 21 plants (378 m2).
Irrigation was applied every week throughout the study. The water volumes applied to the treatments were determined based on the soil moisture control and water restriction scheduled for each treatment (CDI).
The control (T0) consisted of the replacement of a 100 % of the water demand calculated using the crop coefficient (Kc) and the reference evapotranspiration (ETr) obtained from an A type evaporation pan installed on the property, while for T1, T2, T3 and T4 four stress periods during the development of the fruits were considered. In T1 irrigation was suspended before flowering (October), under the assumption that the precipitation conditions and soil moisture allowed it; in T2 irrigation was suspended when the fruits were formed with more than 60 % of their expected final weight; in T3 water stress was caused when the fruits had a weight higher than 70 % of the expected final weight; in T4 irrigation was suspended in the final stage of fruit development, when the fruits had a weight higher than 80 % of their expected final weight.
In order to cause plant stress, irrigation was suspended until the soil moisture decreased to 50 % of the available moisture in the first 60 cm deep. For each experimental treatment, units were composed of three rows of seven plants each, a total of 84 plants per treatment, with 0.151 ha per treatment and 0.756 ha total.
The soil moisture content was measured with a neutron probe (model 4300, Troxler Inc, Triangle Park, North Caroline, USA), with an average frequency of 3 d. These measurements were performed through aluminum access tubes at four depths (0-0.3, 0.3-0.6, 0.6-0.9 and 0.9-1.2 m), and 60 tubes throughout the experiment. For each treatment, there were 12 tubes and three tubes for each experimental unit. All three tubes were placed around the experimental unit central plants and arranged at a distance of 0.8 m between rows (tube A) and at 1 and 2 along the row (tube B and tube C respectively), all over the windrow.
In order to evaluate the effect of the CDI in the water status of the plant, the stomatal conductance and xylem pressure were measured. On the plants, stomatal conductance was measured every 7 d between 12:00 and 14:00 (local time) with a porometer (AP4 model, DELTA-T Device, Cambridge, UK). The measurements were performed in 24 leaves exposed to sunlight. These were part of the fruit chargers for each treatment and distributed in six leaves by repetition. The measured leaves were taken in the same treatment where the soil moisture content was measured in order to correlate information. Similarly, the plant xylem pressure was measured every 7 d throughout the study using a pressure pump (Scholander type, Eijkelkamp, Glesbeeh, Netherlands). In each treatment, eight leaves were measured, these were distributed in two leaves per repetition. According to Sellés and Ferreyra (2002) recommendations, one hour before taking measurements (12:00 h), the selected leaves were covered with aluminum bags to block transpiration and solar radiation on the leave.
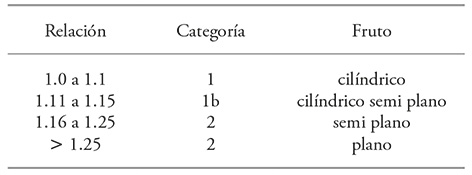
The fruit size was weekly measured using a vernier (foot meter). The polar and equatorial diameter of 40 randomly selected fruits in each treatment (10 fruits per repetition) was obtained. The fruits were selected weekly from the central plants of each experimental unit. Kiwifruit is a fruit of irregular shape, whereby the equatorial diameter was measured on both sides of the fruit. With the results, the export category was determined according to the homogeneity of the fruits (Table 2).
Table 2 Relationship between the largest and smaller equatorial diameter of the fruit, according to international markets standards.
Statistical analysis of data
For the data analysis (stomatal resistance, xylem pressure, fruit size and production) of the three seasons, the Shapiro-Wilk test was applied to assess the data normality and then the Bartlett test in order to corroborate the homogeneity of variance. The Box-Cox (Box and Cox, 1964) transformation of variables was then used to homogenize the variances and standardize data. A conjunct ANOVA was then made (Kuehl, 2001) when significance was found (F test), means were analyzed with the Tukey test (p≤0.05). Analyses of variance were performed using the R statistical software (version 3.1.0).
Results and Discussion
Soil moisture
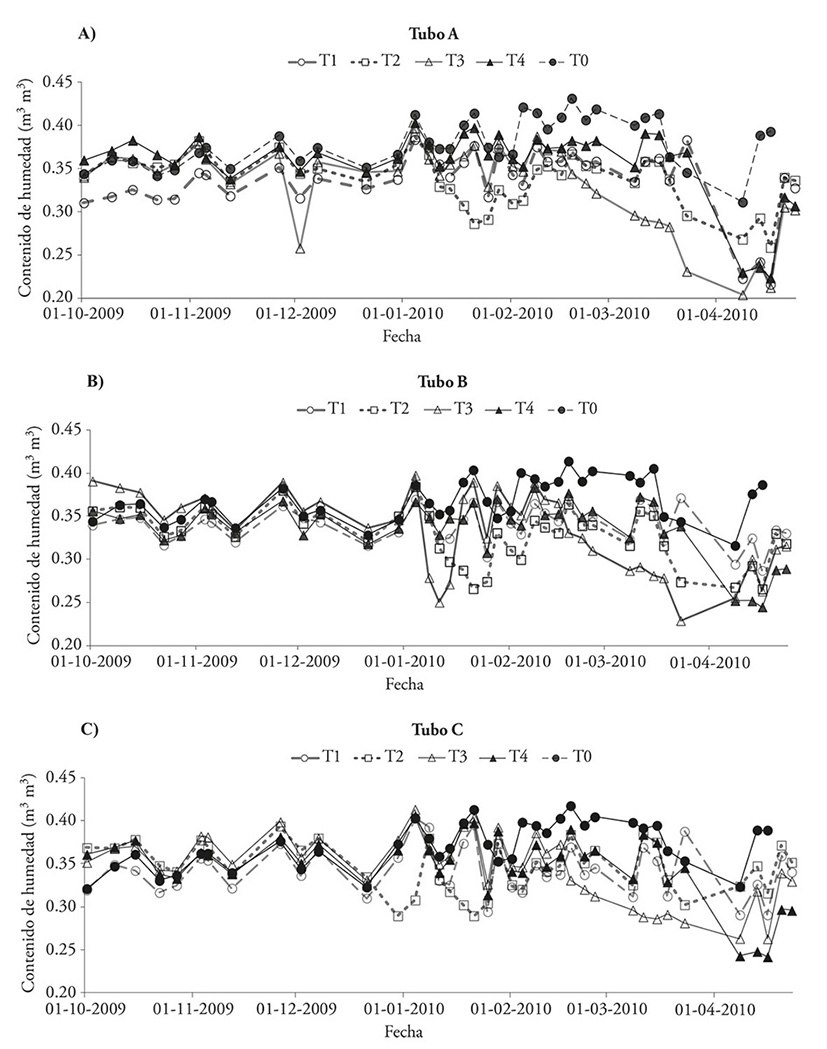
Between October and January (2009 to 2012) the soil moisture was consistent across the three monitoring points (Tubes A, B and C). The moisture content fluctuation increased from January to harvest, a period in which the application of the CDI scheduled at T1, T2, T3 and T4 were performed and the T0 irrigation frequency was increased. In Figure 1, the behavior of moisture content measured in the first 0.3 m deep in the soil profile (2009-2010 seasons) is shown.
Tube A (0.8 m from the plant) showed in all treatments (Figure 1A) greater sensitivity to changes in the moisture content than B and C tubes, indicating that the radical water extraction activity was higher at that monitoring point. In tube B (1 m from the plant) and tube C (2 m from the plant), water withdrawal was not higher than that obtained in tube A (Figure 1B and 1C), which is attributed to the large spatial variability that the root zone of the kiwi plants showed. These results are similar to those reported by Hughes et al. (2001). The results measured for the other strata and the other seasons were similar: T0 kept near FC values, the other treatments with values that on average did not decrease the moisture content below 50 % of the available moisture.
Stomatal resistance (Sr)
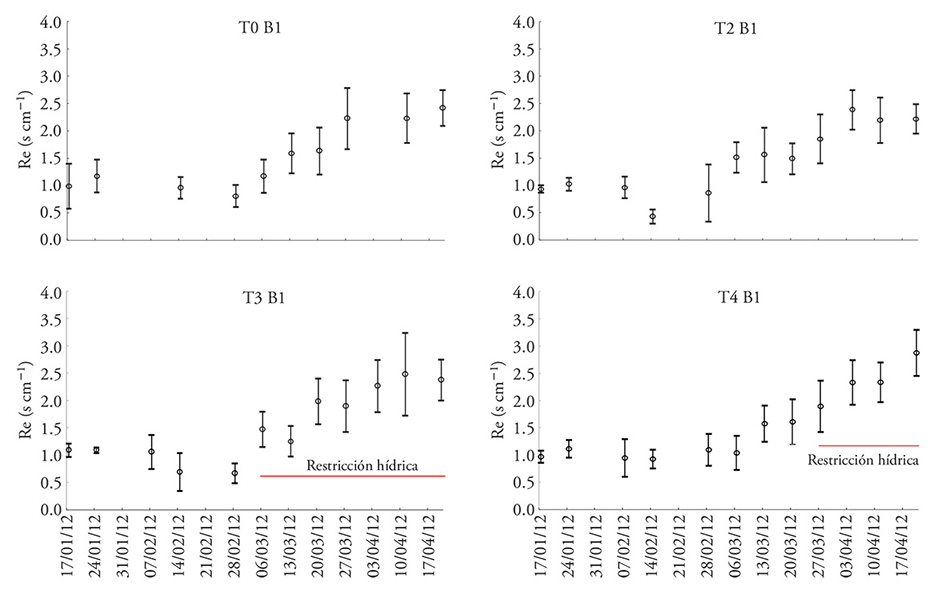
Results of the Sr showed average values during the first season of 0.5 and 1.0 s cm-1, during the second and third seasons the values ranged from 1.2 to 2.2 s cm-1 in all treatments. The last two seasons obtained a higher average value of Sr respect to the first values. They increased only in the third season when soil moisture levels were close to 50 % of available soil water at 0.3 m depth (Figure 2). During the three seasons of the study, there was no significant difference of the Sr against changes in soil moisture levels (p>0.05), indicating that the evaluated water restriction did not affect stomatal opening. This is also consistent with that proposed by Gratacos and Gurovich (2003), who indicated that the kiwi plants has a relatively less efficient stomatal control. Besides, Judd et al. (1989) reported poor stomatal control in kiwi plants with leaves under severe water shortages, as a result of an incomplete stomatal closure leaves kept transpiration even overnight.
Xylem pressure
During the first season xylem pressure was close to -0.5 MPa. During the second season, the average values were -0.55 MPa and -0.43 MPa in the third season in all treatments. No significant differences during the water stress treatment were measured (p>0.05). The maximum values throughout the study reached -0.7 MPa, and a minimum of -0.4 MPa. Clearwater et al. (2007) measured xylem potential in kiwi plants and the values were -0.5 MPa in plants grafted under normal water conditions. The 50 % water restriction of the available moisture used in our study caused no alteration in the water status and internal water transport processes developed by the plant.
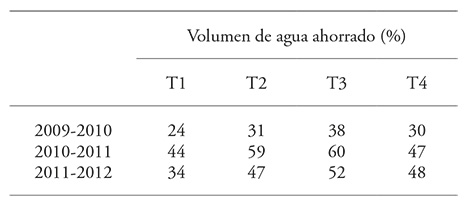
Applied water volumes
During the first season, 9609 m3 ha-1 were applied in the control treatment, which had an electricity cost of US$ 248 per ha by season. When comparing this treatment with the results obtained under CDI management, the difference of the applied volume was of 3670 m3 ha-1 by the irrigation applied to T3 (Figure 3), which generated savings in the electric power cost of US$ 94.25 ha per season.
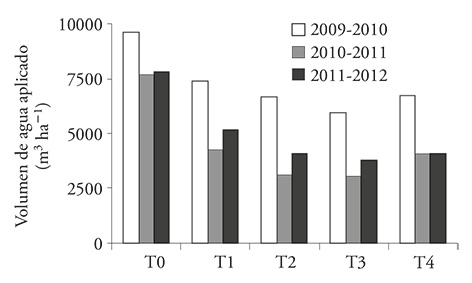
During the first season, the soil moisture profile descended up to 50 % of the available moisture. It was not uniform for all the replicates in a treatment within the whole experiment due to the soil texture. Therefore, in the second and third season, irrigation control was independently performed by the application of water in each experimental unit (replicate of each treatment). During the second and third season, volumes between 3000 and 5000 m3 ha-1 were applied. These values were similar to those reported by Currie et al. (2008). Independent irrigation management increased differences between the results for T0 and treatments with CDI (Table 3). During the second season, the water volume applied to T3 was of 3050 m3 ha-1, which was the lowest applied throughout the study. As a consequence, there was 60 % water saving and electricity cost relative to T0, which reduced the production costs per hectare of cultivation and maintained humidity available moisture levels over 50 % of the usable.
Fruit size
Two defined phases in fruit growth were observed during the study. The first covered the first four weeks (from December 21 in all seasons), when fruit development is faster; the second phase began around the fifth week of fruit development (January 18), when fruit growth rate decreased. This remained almost constant until two weeks before harvest. After this second phase, though less clear, there was a third growth phase (March 8) with a further increase in the fruit development rate. These results were observed in all seasons and consistent with those of Ciordia et al. (1993), who reported two distinct phases that include the first six weeks which stand out because of a sharp increase of the fruits. For example, Figure 4 shows the polar fruit growth in T0 and T2 diameter. Comparing the results between T0 and T2 showed that the growth curve behavior remain homogeneous in both treatments. This indicated that the CDI applied during the study did not affect the fruit size.
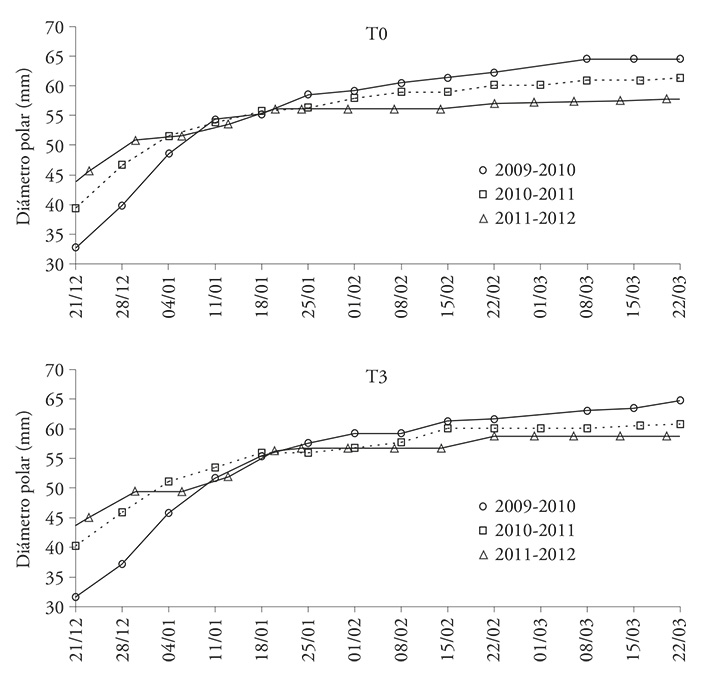
The three study seasons showed significant differences (p≤0.05) in the polar diameter (Figure 4). The polar diameter curve of the fruit reduced each year, the average value was of 68.2 mm at the 2009-2010 season harvest, 63.5 mm and 59.5 mm in the 2010-2011 and 2011-2012 seasons. However, the analysis of the behavior of the curve in treatment T0 showed that the reduction in fruit size was not a CDI effect, but because of the increased fruit load (fruit m-2) due to the orchard’s internal management; this situation is consistent with the results in production. Godoy et al. (2002) measured the effect of the fruit load on the fruit size at harvest and concluded that a high fruit load limits the size reached by the fruits due to a slower growth rate.
Export category
During the first season, a difference between the uniformity of the harvested fruit in the treatments under CDI compared to the control was observed. Uniform fruit has a greater acceptance in international markets. Because of that, we included the measurements of the equatorial diameter during the subsequent seasons that allowed categorize with more precision the type of fruit obtained at harvest.
Thus, in the 2010-2011 harvest season: 1) 24.2 % of the fruit was classified as category one, thus, being a cylindrical fruit can be exported to any world market; 2) 63.1 % of the fruit was categorized as 1b (semi plane cylindrical fruit), and export destination depends on the requirements and quality standards that apply in the country of destination; 3) 12.6 % of the fruit was qualified as category two (semi plane fruit), which cannot be exported to East countries and Europe. Thus, T2 had the highest rate of cylindrical category 1 fruits; T4 had cylindrical and cylindrical semi plane fruits; T1 and T3 with a larger amount of cylindrical semi plane fruits; T0 had the highest amount of category two fruits (Table 4).
Table 4 Results of the category of fruits per treatment in each block of the 2010-2011 and 2011-2012 seasons.
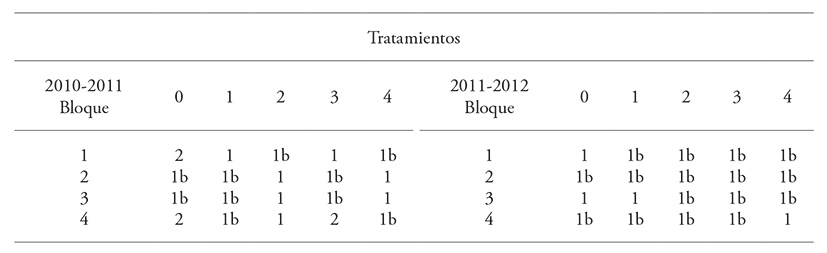
During the 2011-2012 season: 1) 28.3 % of the fruits were classified as category 1; 2) 59.5 % was 1b category; 3) 11.4 % was category 2; 4) 0.7 % was category 2b and 59 % at T0, 50 % and 50 % at category 1b and 1. The results showed that in T2 and T3 the predominant category was 1b for the four replicates within each treatment. For T1 and T4 75 % was of 1b category and 25 % category 1 (Table 4).
Production
The highest kiwi production was obtained during the third season and the average value for the entire experiment was of 44.1 Mg ha-1 (Table 5). Besides, there were significant differences (p≤0.05) between the 2011-2012 season and the previous ones. During the last research year, the average yield increased 10 Mg ha-1 (Table 5).
Table 5 Yield per (Mg ha-1) treatment.
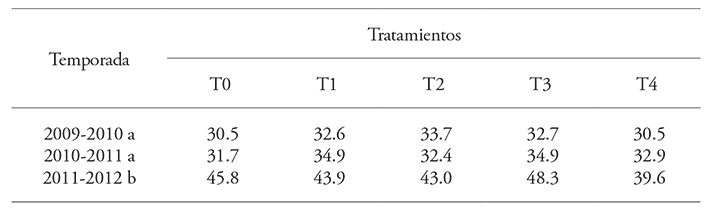
Coefficient of variation (CV)=9.81 %. Seasons with a different letter in a column are statistically different (p≤0.05).
The yield increase in the 2011-2012 season (Table 5) was attributed to a different operation done in previous seasons. This new operation resulted in increased number of fruits per plant (fruit load) through less demanding thinning, which in turn caused a reduction in the fruit size at harvest. Also, the yields obtained in the three seasons were between 30 and 45 Mg ha-1. This is consistent with ODEPA (2013) and Comité del Kiwi Chile (2014).
During the three evaluated seasons, no significant differences among all treatments were detected (p>0.05), including the control. This shows that water stress treatments were adequate to not adversely affect production. These results are similarly to that found by Currie et al. (2008) with plants subjected to moderate water stress treatments.
Conclusions
The xylem pressure and stomatal resistance observed during periods of water restriction were not affected by the evaluated deficit irrigation strategies. Irrigation water saving due to the application of controlled irrigation deficit reduced the energy required for pumping irrigation, which decreases production costs.
Yield and fruit size were not affected by water restriction strategies; however, deficit irrigation strategies allowed more uniform fruits. The analyzed deficit irrigation strategies offer an alternative for irrigation management in kiwi crops, reducing production costs associated with irrigation without affecting yield and increasing the fruit quality
Literatura Citada
Ambrosio, C., C. Linehan, and G. Kaine. 2008. Understanding the reasons for non-adoption of sustained deficit irrigation practices in the sunraysia wine grape industry. Acta Hortic. 792: 27-32. [ Links ]
BCN (biblioteca del congreso nacional de Chile). 2014. Información territorial séptima región de Chile. http://siit2.bcn.cl/nuestropais/region7/clima.htm . (Consulta: mayo 2015). [ Links ]
Bonany, J., and F. Camps. 1998. Effects of different irrigation levels on apple fruit quality. Acta Hortic . 466: 47-52. [ Links ]
Box, G. E., and D. R. Cox. 1964. An analysis of transformations. J. Royal Stat. Soc. Series B 26: 211-252 [ Links ]
Chalmers, Y. M., M. P. Krstic, M. O. Downey, P. R. Dry, and B. R. Loveys. 2008. Impacts of sustained deficit irrigation on quality attributes and flavonoid composition of shiraz grapes and wine. Acta Hortic . 792: 163-169. [ Links ]
Ciordia M., B. Díaz , J. Garcia, y M. Coque. 1993. Contenido mineral en hoja de kiwi en función de diversos tratamientos de riego. Instituto de experimentación y promoción agraria. Principado de Asturias. Serie técnica nº 5/93. [ Links ]
Clearwater, M., J. P. Blattmann, Z. Luo, and R.G. Lowe. 2007. Control of scion vigour by kiwifruit rootstocks is correlated with spring root pressure phenology. J. Exp. Bot. 58: 1741-1751. [ Links ]
Collins, M. J., E. W. R. Barlow, S. Fuentes, and G. Kelley. 2008. Water use responses of shiraz vines under partial root zone drying in a water-limiting environment. Acta Hortic . 792: 179-186. [ Links ]
Comité del Kiwi Chile. 2014. ¿Qué significa ser un buen productor de kiwi Hayward?. http://www.comitedelkiwi.cl/component/content/article/34-noticias/noticias/455-que-significa-ser-un-buen-productor-de-kiwi-hayward.html . (Consulta: mayo 2016). [ Links ]
Currie, M., S. Green, P. Martin, and N. Currie. 2008. Thirsty vines can give tasty fruit, but at a cost. N. Z. Kiwifruit J. 1(185): 7-12. [ Links ]
Ferreyra E., R., G. Sellés V., y L. Burgos R. 1998. Frutales: riego deficitario controlado. Instituto de investigación agropecuaria y centro de investigaciones agropecuarias. Serie La Platina Nº 70. Santiago, Chile. 66 p. [ Links ]
Geerts, S., and D. Raes. 2009. Deficit irrigation as an on-farm strategy to maximize crop water productivity in dry areas. Agric. Water Manage. 96: 1275-1284. [ Links ]
Godoy C., R. Arpaia., y J. Tognetti. 2002. Raleo de frutos en kiwi. Rev. FCA UNCUYO 34: 107-115. [ Links ]
Gratacos E., y L. Gurovich. 2003. Uso de la técnica del fitomonitor como indicador del estado hídrico del kiwi y su uso en riego programado. Cienc. Inv. Agr. 30: 113-137. [ Links ]
Hughes, K. A., P. de Willigen, P. W. Gandar, and B. E. Clothier. 2001. Kiwifruit root systems: structure and function. Acta Hort. 557: 113-119. [ Links ]
Judd, M. J., K. J. McAneney, and K. S. Wilson. 1989. Influence of water stress on kiwifruit growth. Irrig. Sci. 10: 303-311. [ Links ]
Kuehl, R. 2001. Diseño de Experimentos. González, M. 2a. ed. Thomson Editores S.A., México. 666 p. [ Links ]
Leib, B. G., H. W. Caspari, C. A. Redulla, P. K. Andrews, and J. J. Jabro. 2006. Partial root zone drying and deficit irrigation of “Fuji” apples in a semi-arid climate. Irrig. Sci . 24: 85-99. [ Links ]
Miller, S. A., G. S. Smith, H. L. Boldingh, and A. Johansson. 1998. Effects of water stress on fruit quality attributes of kiwifruit. Ann. Bot. 81: 73-81. [ Links ]
O’ Connell, M. G., I. Goodwin, and A. D. Wheaton. 2008. Response of pink lady apple to irrigation estimated from effective area of shade. Acta Hortic . 792: 495-502. [ Links ]
ODEPA (Oficina de Estudios y Politicas Agrarias). 2013. Ficha técnica-económica kiwi Región del Maule. http://www.odepa.cl/wp-content/uploads/2013/12/fichaKiwiMaule2013.pdf . (Consulta: mayo 2016). [ Links ]
ODEPA (Oficina de Estudios y Politicas Agrarias). 2014. Kiwi, en la senda correcta. http://www.odepa.cl/wp-content/files_mf/1412697728Kiwi201409.pdf . (Consulta: mayo 2015). [ Links ]
Reid, J. B., D. W. Brash, I. B. Sorensen, and B. Bycroft. 1996. Improvement in kiwifruit storage life caused by withholding early-season irrigation. N. Z. J. Crop Hortic. Sci. 24: 21-28. [ Links ]
Sandoval E., M., J. Dörner F., O. Seguel S., J. Cuevas B., y D. Rivera S. 2012. Métodos de análisis físicos de suelos. Universidad de Concepción. Publicaciones del Departamento de Suelos y Recursos Naturales, número 5. Chillán, Chile. 80 p. [ Links ]
Sellés V. G., y R. Ferreyra E. 2002. Cámara de presión, instrumento para controlar el riego midiendo el estado hídrico de las plantas. Chile Riego 11: 44-48. [ Links ]
Zhang, H., and H. Oweis. 1999. Water-yield relations and optimal irrigation scheduling of wheat in the Mediterranean Region. Agric. Water Manage. 38: 195-21. [ Links ]
Received: January 2016; Accepted: November 2016
 Este es un artículo publicado en acceso abierto bajo una licencia Creative Commons
