


Serviços Personalizados
Journal
Artigo
 Inglês (pdf)
 Artigo em XML
 Referências do artigo
 Enviar este artigo por email
Indicadores
-
 Citado por SciELO
 -
 Acessos
Links relacionados
-
 Similares em
SciELO
Similares em
SciELO
Compartilhar

 Permalink
Geofísica internacional
versão On-line ISSN 2954-436Xversão impressa ISSN 0016-7169
Geofís. Intl vol.47 no.3 Ciudad de México Jul./Set. 2008
Article
Geomagnetic disturbances analysis using discrete wavelets
M. Zossi de Artigas1,2,*, P. Fernandez de Campra3 and E. M. Zotto4
1 Departamento de Física, Facultad de Ciencias Exactas y Tecnología, Universidad Nacional de Tucumán, Av. Independencia 1800, 4000. Tucuman, Argentina. * Corresponding author: mzossi@herrera.unt.edu.ar
2 Consejo Nacional de Investigaciones Científicas y Técnicas, Argentina.
3 Departamento de Ciencias de la Computación, Facultad de Ciencias Exactas y Tecnología, Universidad Nacional de Tucumán, Av. Independencia 1800, 4000. Tucuman, Argentina.
4 Facultad de Tecnología y Ciencias Aplicadas, Universidad Nacional de Catamarca, Maximio Victoria 55, 4700. Catamarca, Argentina.
Received: October 29, 2007
Accepted: April 23, 2008
Resumen
Para estudiar periodicidades y tendencia en tormentas geomagnéticas se aplicó la transformada wavelet discreta, usando la función Daubechies. De entre una variedad de técnicas disponibles para analizar variabilidad, el análisis wavelets ha surgido en la última década como una herramienta estadística útil para este propósito. En el presente análisis se usó el número de tormentas geomagnéticas desde 1957 al 2004. El análisis wavelets se aplicó a tormentas con diferentes intensidades. Para identificar tormentas geomagnéticas se usó el índice ecuatorial Dst. La tendencia durante el período analizado no es uniforme, con mínimos alrededor de los años 1965 y 2000, y un máximo alrededor de 1990. Se han detectado diferentes periodicidades. Su comportamiento no es regular a lo largo del período analizado. Se discuten posibles causas para la variabilidad observada.
Palabras clave: Tormentas geomagnéticas, actividad geomagnética, periodicidades, índices geomagnéticos.
Abstract
To assess long–term trends and periodicities in geomagnetic storms, the discrete wavelet transform, using the Daubechies function, was applied. Among a variety of techniques, which are available for analyzing variability, wavelet analysis has emerged in the last decade as a useful statistical tool for this purpose. The number of geomagnetic storms from 1957 to 2004 was used for the present analysis. The wavelet analysis has been applied to storms with different intensities. For identify geomagnetic storms, the equatorial index, Dst, has been used. The long–term trend during the analyzed period is not a uniform, with minimum around the years 1965 and 2000, and a maximum around 1990. Different periodicities have been detected. Their behavior is not regular along the analyzed period, they have different intensity values. Possible causes for the observed variability are discussed.
Key words: Geomagnetic storms, geomagnetic activity, periodicities, geomagnetic indices.
Introduction
Many of the studies of the variability of geomagnetic activity are based on the analysis of geomagnetic indices (Clua de Gonzalez et al., 1993; Vennerstrom and Friis–Christensen, 1996; Rangarajan and Iyemori, 1997; Kane, 1997; Rangarajan and Barreto, 2000), indicating their periodicities and relating them with the solar activity and others periodic parameters. Some of which have indicated the fact that the recurrent behavior in the geomagnetic activity is not constant along time.
The geomagnetic activity has a seasonal variability with maxima in the equinoxes (Russell and McPherron, 1973; Clua de Gonzalez et al., 1993). Gonzalez and Tsurutani (1992) found, during the period 1975–1986, a great seasonal modulation in the distribution of intense geomagnetic storms with Dst <–100 nT.
Cliverd et al. (1998, 2002) analyzed the occurrence of magnetic storms, with geomagnetic index, aa *> 40 nT, among the years 1868 and 2000. They found an increase in the storm activity in all the phases of the solar cycle. In this work, the discrete wavelet transform, using the Daubechies function, was applied to assess periodicities and long–term trends, from 1957 to 2004. to: i) monthly number of geomagnetic storms and ii) yearly number of geomagnetic storms of different intensity.
Data Analysis
The magnetic storm as defined by values of the equatorial geomagnetic index, Dst<–50 nT.
The Dst index monitors the disturbance of the horizontal component of the geomagnetic field (H) at the dipole equator on the Earth's surface (Mayaud, 1980) monitoring the ring current state. The hourly values of Dst index from January 1957 to December 2004, available at the World Data Center– C2, Kyoto University (Japan), were used.
A decomposition of the series was performed using Daubechies wavelets by estimating first the coefficients of all the components (details and approximation) up to a level 6.
We used Daubechies wavelet because it is a commonly used family of wavelets (Daubechies, 1988, 1992) for discrete analysis. They are the only wavelets having a finite support (they are non–zero only over a finite range) with full scaling and translational orthogonality (Horgan, 1999). While details contain the high frequency information of the series, the approximation reflects its slowest variations. In fact, details correspond to the reconstruction of the series after going through a high–pass filter, while the approximation corresponds to the low–pass filtered series. The discrete wavelet analysis (DWT) using the Wavelet Toolbox for Matlab was applied.
The reconstruction of the components (details and approximation) has shown in Figs. 1a–f. Besides, for each reconstruction, we have also calculated the well known Fourier spectrum.
Following, each periodicity is analyzed separately
~ 0.5 –year cycle
The semi annual cycle (Fig. 1a) appears as the strongest periodicity. It has long been recognized that geomagnetic activity exhibits this periodicity (Chapman and Bartels, 1940; Fraser–Smith, 1972; Russell and McPherron, 1973) with the greatest activity near equinoxes. Its possible cause has been a point of debate and has been reviewed by many authors (Murayama, 1974; Schreiber, 1998; Cliver et al., 2000) who coincide in three causes: 1) the axial effect, that is the variation of the position of the Earth in heliographic latitude and the concurrent increase in solar wind (SW) speed at higher heliographic latitudes, 2) the equinoctial effect, that is the varying angle of the Earth's dipole with respect to the Earth–Sun line or rather the SW velocity and thus presumably a varying efficiency of coupling with the SW and 3) the Russell–McPherron effect, an effect due to the larger z–component of the interplanetary magnetic field (IMF) near the equinoxes in geocentric solar magnetospheric (GSM) coordinates which in turn is due to the tilt of dipole axis with respect to the heliographic equatorial plane. Crooker et al. (1992) indicate that high value of the BS component of the interplanetary magnetic field would be responsible of this seasonal distribution in the occurrence of strong storms. Bell et al. (1997) found that strong geomagnetic storms happen more frequently near the equinoxes and in the descent of the solar cycle.
~ Mid–term quasi–periodicities
Level 3 (Fig 1b), presents a band periodicity around 1 year. Several authors have shown the presence of the 1.3–year periodicity in geomagnetic and auroral activity (Shapiro, 1967; Fraser–Smith, 1972; Delouis and Mayaud, 1975, Szabo et al., 1995; Silverman and Shapiro, 1983) with varying significant levels at different times. Richardson et al. (1994), who noted this periodicity in SW speed, speculated that it might be related to the topology of coronal holes and to the formation of open magnetic structures. Gazis et al. (1995) and Gazis (1996) suggest that these variations must originate quite close to the Sun, probably in the SW source region. Valdez Galicia et al. (1996) showed that a 1.7 year periodicity is present in cosmic rays in solar cycle 21. Mursula and Zieger (2001) have shown that a mid term variation in cosmic rays present a very close connection with the similar periodicities in SW and geomagnetic activity, who present alternating periods for even and odd cycles; during the last 70 years. The main quasi periodicities are 1.3 – 1.4 years during cycles 20 and 22 and 1.6–1.7 for cycles 19 and 21. Periodicity values between 1 and 2 years are shown in fig 1c, too.
~ Quasi–biennial cycle
Level 4 presents peaks at around 2–2.5 years (Fig. 1c). Several authors have identified a quasi–biennial oscillation (QBO) in geomagnetic activity. Among them, Stacey and Westcott (1962) attributed this oscillation to the extension of the equatorial stratospheric QBO to ionospheric heights; Yacob and Bhargava (1968) argued that its source was a biennial periodicity in solar UV radiation; Raja Rao and Joseph (1971) suggested an association between its mechanism and the equatorial electrojet; and Olsen (1994) and Olsen and Kiefer (1995) postulated that the observed QBO in geomagnetic variations could be caused by a dynamo action of a QBO in lower thermospheric winds. Jarvis (1996) arrived at conclusions similar to Olsen's analyzing data of a high latitude station. Kane (2005) have analyzed the QBO present in solar, interplanetary and terrestrial parameters. The solar indices presents a QBO that is strong near solar maximum, the cosmic rays observed on Earth presents similar distribution of peaks.
~ 3.5 –year cycle
A cycle of around 3.5 years, a quasi–triennial oscillation (QTO), is detected during the whole period in level 5 (Fig. 1d). From a study of geomagnetic storms, Gonzalez et al. (1990) and Gonzalez et al. (1993) showed that the yearly distribution of storms present two peaks around the solar maximum: one at the solar maximum or slightly earlier and the other in the early part of the descending phase. The average separation of these peaks is between 3 and 4 years. It may be related to a similar dual–peak structure presented by the intensity of certain coronal processes, as shown by Gnevyshev (1967) and Gonzalez et al. (1996). Therefore, there exist mechanisms in different phases of the solar cycle that explain this periodicity. A similar oscillation was also detected by Rangarajan and Iyemori (1997) in Ap index. They attribute this quasi–periodic fluctuation to the change in high speed SW streams associated with sector boundary passages rather than due to the dual peak distribution of intense geomagnetic storms as suggested by Gonzalez et al. (1993). Kane (2005) also studied this oscillation and their differences with the QBO in solar, interplanetary and terrestrial parameters.
We detected this periodicity very important for severe storms.
~ 5.5 –year cycle
This band around 5 years (detail 5 and detail 6, Figs. 1d and 1e) is observed also in aa index (Echer et al., 2004a). It is detected in SW speed and in the intensity of the interplanetary magnetic field, B, (Rangarajan and Barreto, 2000). Some authors consider that the periodicity of 5.5 years in the solar activity, indicated by Rz, is the second harmonic of the 11 year– cycle (Sugiura, 1980, Djurovic and Paquet, 1996). Our results have shown this periodicity for all cases studied.
~ 11–year cycle
This periodicity is present with significance in detail 6, Fig. 1e. This oscillation is observed almost in phase with the solar activity cycle and it has been examined in several studies.
In fact, Vennerstrom and Friis–Christensen (1996) had already noticed a high correlation between the solar activity and a ring current measure, even higher than the correlation with aa index. Moderate storms present this periodicity as important as 5.5 years one.
Long–term trend
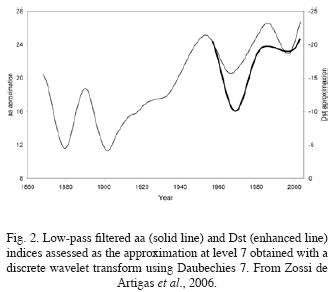
The long–term trend in the monthly number of storms (Fig. 1f) during the analyzed period is not a uniform or linear trend. It is similar that of Dst and aa geomagnetic indices (Fig. 2, Zossi de Artigas et al., 2006): minimum around the years 1965. Our results present another minimum around the 2000's. Many works exist on the long term variation of geomagnetic indices. Russell and Mulligan (1995) analyzed the average behavior of the index aa and they also suggest long term variations in the field of the polar region of the Sun. Cliverd et al. (1998) detected an increase in the number of storms in all the phases of the solar cycle, but in the minimum the increment is 40% superior to the other phases, concluding that the cause is a higher solar activity. Vennerstrom (2000) proposes that the growing tendency in geomagnetic activity is due to an increment in the parameters of the SW. Besides, Echer et al. (2004b) results have shown that, the correlation and lag variation between sunspot number (Rz) and aa geomagnetic index long–term (annual) averages would probably caused by a stronger role of co–rotating interaction regions. This seems to indicate an increase in open solar magnetic field structure strengths to drive geomagnetic activity in comparison to the closed ones.
Discussion and conclusions
Fourier analysis is a method for the analysis of stationary time series. Since it extracts global information, non–stationarities in a small time interval may not be captured by the Fourier spectrum. (Chiann and Morettin, 1998). Wavelets provide a time–frequency window, which shrinks for high frequencies and widens for low frequencies, capturing the local behavior of the signal.
The discrete wavelet transform, using the Daubechies function, was applied to obtain periodicities and long–term trends in the number of geomagnetic storms, from 1957 to 2004. The behavior of the periodicities is not regular along the analyzed period, they have different intensity values, like peaks around 1990 (details 3 and 4).
The long–term trend is similar, to that of Rz, what suggests that these variations may be due to changes in the Sun. Gonzalez et al. (1990) studied the frequency distribution of intense geomagnetic storms with the solar cycle and found that did not agree with the evolution of the number of sunspots. Cliver and Ling (2002), based on the similarity of the secular variations of aa and Rz, attribute a solar origin to the geomagnetic activity.
The wavelet transform is without doubt a powerful tool. Although the results do not differ much from those of other authors, the contribution of this work is the assessment of the oscillations in the amount of storms of different intensity, using local wavelet spectrum and the significance between the different periodicities like, the 5.5 years periodicity is as important as the 11 years one. The time variation of the pattern of each cycle is due to the fact that the formation of the storm–time is linked to solar sources which, in turn, do not present cycles of constant periodicities and amplitude over time.
Bibliography
Bell, J. T., S. Gussenhoven and E. G. Mullen, 1997. Super storms, J. Geophys. Res., 102, 14189–14198. [ Links ]
Chapman, S. and J. Bartels, 1940. Geomagnetism, Chapter II, Oxford Univ. Press, New York. [ Links ]
Chiann, C. and P.A. Morettin, 1998, A wavelet analysis for time series, Nonparametric Statistics ,10, 1–46. [ Links ]
Clilverd, M. A., Clark, T.D.G., Clarke E., and Rishberth, H., 1998, Increased magnetic storms activity from 1868 to 1995, Journal of Atmospheric and Solar–Terrestrial Physics, 60, 1047–1056. [ Links ]
Clilverd, M. A., T. D. G. Clark, E. Clarke, H. Rishberth and T. Ulich, 2002. The causes of long– term change in the aa index, Journal of Geophysical Research, 107, NO.0, XXXX, doi:10.1029/2001JA000501. [ Links ]
Cliver, E., Y. Kamide and A. Ling, 2000. Mountains versus valleys: Semiannual variation of geomagnetic activity, J. Geophys. Res., 106, 2413. [ Links ]
Cliver, E. W. and A. G. Ling, 2002. Secular change in geomagnetic indices and the solar open magnetic flux during the first half of the twentieth century. J. Geophys. Res. 107, 1303. doi:10.1029/2001JA000505. [ Links ]
Clua de Gonzalez, A. L., W. D. Gonzalez and S. L. G. Dutra, 1993. Periodic variation in the geomagnetic activity: A study based on the Ap index, J. Geophys. Res., 98, 9215–9231. [ Links ]
Crooker, N. U., E. W. Cliver and B. T. Tsurutani, 1992. The semiannual variation of great geomagnetic storms and the postshock Rusell–Mc Pherron effect preceding coronal mass ejecta, Geophys. Res. Lett., 19, 429–432. [ Links ]
Daubechies, I., 1988. Orthonormal bases of compactly supported wavelets. Comm. Pure Appl., Math. 41, 906–966. [ Links ]
Daubechies, I., 1992. Ten lectures on wavelets, second ed. SIAM, Philadelphia. [ Links ]
Delouis, H. and P. Mayaud, 1975. Spectral analysis of the geomagnetic activity index aa over a103–year interval, J. Geophys. Res., 80, 4681–4688. [ Links ]
Djurovic and P. Paquet, 1996. Solar Phys. 167, 427. [ Links ]
Echer, E., N. R. Rigozo, M. P. Souza Echer, L. E. A. Vieira, D. J. R. Nordemann, 2004a. Reconstruction of the aa index on the basis of spectral characteristics. Geofísica Internacional, 43, 1, p. 103–111. [ Links ]
Echer, E., W. D. Gonzalez, A. L. C. Gonzalez, A. Prestes, L. E. A. Vieira, A. Dal Lago, F. L. Guarnieri and N. J. Schuch, 2004b. Long Term Correlation between solar and Geomagnetic Activity, J. Atmos. Terr. Phys., 66, 1019–1025. [ Links ]
Fraser–Smith, A., 1972. The spectrum of geomagnetic activity index Ap, J. Geophys. Res., 77, 4209–4220. [ Links ]
Gazis, P. R., J. D. Richardson and K. I. Paularena, 1995. Long term periodicity in solar wind velocity during the last three solar cycles, Geophys. Res. Lett., 22, 1165–1168. [ Links ]
Gazis, P. R., 1996. Long term enhancements in the solar wind speeds, J. Geophys. Res., 101, 415–424. [ Links ]
Gnevyshev, M., 1967. On the 11–years cycle of solar activity, Solar Phys., 1, 109–120. [ Links ]
Gonzalez, W., A. Gonzalez and B. Tsurutani, 1990. Dual peak distribution of intense geomagnetic storms, Planet. Space. Sci., 38, 181–187. [ Links ]
Gonzalez, W. D. and B. T. Tsurutani, 1992. Terrestrial response to eruptive solar flares: Geomagnetic storms, in Eruptive Solar flares, edited by Z. Svestka, B.V. Jackson, and M. E. Machado, 277–286, Springer–Verlag, New York. [ Links ]
Gonzalez, A., W. Gonzalez and S. Dutra, 1993. Periodic variations in the geomagnetic activity: A study based on the Ap index, J. Geophys. Res., 98, 9215–9231. [ Links ]
Gonzalez, W., B. Tsurutani, P. McIntosh and A. Gonzalez, 1996. Coronal hole– Active region–Current sheet (CHARCS) association with intense interplanetary and geomagnetic activity, Geophys. Res. Lett., 23, 2577–2580. [ Links ]
Horgan, G. W., 1999. Using wavelets for data smoothing: a simulation study. J. Appl. Stat. 26 (8), 923–932. [ Links ]
Jarvis, M. J., 1996. Quasi–biennial oscillation effects in the semidiurnal tide of the Antarctic lower thermosphere, Geophys. Res. Let., 23, 2661–2664. [ Links ]
Kane, R. P., 1997. Quasi–biennial and quasi–triennial oscillations in geomagnetic activity indices, Ann. Geophysicae, 15, 1581–1594. [ Links ]
Kane, R. P., 2005. Differences in the quasi–biennial oscillation and quasi–triennial oscillation characteristics of the solar, interplanetary, and terrestrial parameters, J. Geophys. Res., 110, A01108, doi: 10.1029/2004JA010606. [ Links ]
Mayaud, P. N., 1980. Derivation, Meaning, and Use of Geomagnetic Indices, Geophysical Monograph 22, American Geophysical Union, Washington D.C. [ Links ]
Murayama, T., 1974. Origin of the semiannual variation of geomagnetic Kp indices, J. Geophys. Res., 79, 297–300. [ Links ]
Mursula, K. and B. Zieger, 2001. Simultaneous Occurrence of Mid–Term Periodicities in Solar Wind Speed, Geomagnetic Activity and Cosmic Rays, Proceedings of the 26th International Cosmic Ray Conference, 7, 123–126. [ Links ]
Olsen, N., 1994. A 27–month periodicity in the low latitude geomagnetic field and its connection to the stratospheric QBO, Geophys. Res. Lett., 21, 1125–1128. [ Links ]
Olsen, N. and M. Kiefer, 1995. Geomagnetic daily variations produced by a QBO in thermospheric prevailing winds, J. Atmos. Terr. Phys., 57, 1583–1589. [ Links ]
Raja Rao, K. S. and K. T. Joseph, 1971. Quasi–biennial oscillation in the geomagnetic Sq field in the low latitude region, J. Atmos. Terr. Phys., 33, 797–805. [ Links ]
Rangarajan, G. K. and T. Iyemori, 1997. Time variations of geomagnetic activity indices Kp and Ap: an update, Ann. Geophysicae, 15, 1271–1290. [ Links ]
Rangarajan, G. K. and L. M. Barreto, 2000. Long term variability in solar wind velocity and IMF intensity and the relationship between solar wind parameters & geomagnetic activity, Earth Planets Space, 52, 121–132. [ Links ]
Richardson, J. D, K. I. Paularena, J. W. Belcher and A. J. Lazarus, 1994. Solar wind oscillations with a 1.3–year period, Geophys. Res. Lett., 21, 1559–1560. [ Links ]
Russell, C. T. and R. L. McPherron, 1973. Semiannual variation of geomagnetic activity, J. Geophys. Res., 78, 92–108. [ Links ]
Russell, C. T. and T. Mulligan, 1995. The 22–year variation of geomagnetic activity: Implications for the polar magnetic field of the Sun, Geophys. Res. Lett., 22, 3287–3288. [ Links ]
Schreiber, H., 1998. On the periodic variations of geomagnetic activity indices Ap and ap, Ann. Geophysicae, 16, 510–517. [ Links ]
Shapiro, R., 1967, Interpretation of the subsidiary peaks at periods near 27 days in power spectra of geomagnetic disturbance indices. J. Geophys. Res., 72, 4945. [ Links ]
Silverman, S. M. and R. Shapiro, 1983. Power spectral analysis of auroral occurrence frequency, J. Geophys. Res., 88, 6310–6316. [ Links ]
Stacey, F.D and P. Westcott, 1962. Possibility of a 26–month periodicity in the equatorial geomagnetic field and its correlation with stratospheric winds, Nature, 196, 730–732. [ Links ]
Sugiura, M., 1980, What Do We Expect in Magnetic Activity in the Current Solar Cycle?, EOS Trans. AGU, 61(43), 673–675. [ Links ]
Szabo, A., R. Lepping and J. King, 1995. Magnetic field observations of the 1.3–year solar wind oscillation, Geophys. Res. Lett., 22, 1845–1848. [ Links ]
Valdes–Galicia, J. F. and R. Perez–Enriquez, 1996. The Cosmic–ray 1.68 year variation: A clue to understand the nature of the solar cycle?, Solar Physics. 167, 1–2. 409–417. [ Links ]
Vennerstrom, S. and E. Friis–Christensen, 1996. Long–term and solar cycle variation of the ring current, J. Geophys. Res., 101, 24727–24732. [ Links ]
Vennerstrom, S., 2000. Long–term rise in geomagnetic activity – A close connection between quiet days and storms. Geophys. Res. Lett. 27, 69–72. [ Links ]
Yacob, A. and B. N. Bhargava, 1968. On 26–month periodicity in quiet–day range of geomagnetic horizontal force and in sunspot number, J. Atmos. Terr. Phys., 30, 1907–1911. [ Links ]
Zossi de Artigas, M., A. G. Elias and P. Fernandez de Campra, 2006. Discrete wavelet analysis to assess long–term trends in geomagnetic activity, Physics and Chemistry of the Earth, 31, 77–80. [ Links ]

