


Serviços Personalizados
Journal
Artigo
 texto em
  Inglês (pdf)
 Artigo em XML
 Referências do artigo
 Enviar este artigo por email
Indicadores
-
 Citado por SciELO
 -
 Acessos
Links relacionados
-
 Similares em
SciELO
Similares em
SciELO
Compartilhar

 Permalink
Revista ALCONPAT
versão On-line ISSN 2007-6835
Rev. ALCONPAT vol.7 no.3 Mérida Set./Dez. 2017
https://doi.org/10.21041/ra.v7i3.186
Applied research
Compressive strength in concrete paving blocks. Results leading to validate the test in half-unit specimens
1 Instituto de Estructuras y Transporte, Facultad de Ingeniería, Universidad de la República, Montevideo, Uruguay
With the purpose of validating the compressive strength test result on half-unit specimen for concrete paving blocks quality control, experimental results on half-unit and whole unit blocks from 24 production batches were analyzed. The compressive strength results in whole unit was greater than in half-unit specimen, but they are connected by a form factor. Although the study was limited to a range of resistance in a single block shape and thickness, it could be established that it is possible to test half-unit units for quality control. This allows the other specimen half to be used for another test, simplifying the work controls in a smaller quantity of paving blocks needed and the possibility of using presses of lower capacity.
Keywords: quality control; concrete paving blocks; compressive strength; form factor
Con el objetivo de validar el ensayo de resistencia a la compresión en medio adoquín para el control de calidad, se analizaron experimentalmente adoquines enteros y medios adoquines en un total de 24 lotes de producción. El resultado en adoquín entero fue mayor que en medio adoquín, siendo posible relacionarlos mediante un factor de forma. Si bien el estudio se limitó a un rango de resistencia y a una única forma y espesor, se comprobó que es posible ensayar medio adoquín para el control de calidad de estos elementos. Esto permitiría utilizar la otra mitad para otro ensayo, simplificando los controles de obra con una menor cantidad de adoquines y la posibilidad de utilizar prensas de menor capacidad.
Palabras clave: control de calidad; adoquines de hormigón; resistencia a la compresión; factor de forma
Com o objetivo de validar a utilização de meias peças de concreto para pavimentação, pavers, no seu controle de qualidade, os resultados de resistência à compressão obtdos nestas meias peças foi comparado aos resultados obtidos no ensaio normalizado e realizado em peças inteiras. Foram analisados experimentalmenteum total de 24 lotes de produção. Os resultados obtidos nas peças inteiras foram maiores do que os obtidos nas meias peças, sendo possível relacioná-los por meio de um fator de forma. Embora o estudo tenha sido limitado a uma clase de resistência e uma única forma e espessura, verificou-se que é possível testar meia peça de concreto para o controle de qualidade desses elementos. Isso permitiria que a outra metade fosse usada para outro teste, simplificando os controles de produção com um menor número de peças e a possibilidade de usar prensas de menor capacidade.
Palavras-chave: controle de qualidade; peças de concreto; resistência à compressão; fator de forma
1. INTRODUCTION
1.1 Importance and aim of the study
Concrete paving blocks are precast units that conforms the surface layer of articulated pavements. The necessary requirements for their quality control in Uruguay are given by the UNIT 787 (1989)“Portland cement concrete paving units”, including: characteristics of the materials used for their production, geometrical and appearance characteristics, compressive strength, abrasion strength and absorption.
Nowadays, paving blocks are produced in different shapes and thickness, in Uruguay are usually rectangular or Unistone Type with a thickness of 60mm, 80mm and 100mm (for heavy traffic circulation, for example in ports and airports, the thickness must be the same or greater than 80mm).
The standard (UNIT 787) indicates that the procedure for the compressive strength test is the one established in the UNIT 101 (1998). At least three paving blocks should be tested. The tests are done in whole units, as long as the cross section is not bigger than 260cm2 (otherwise if it is bigger the units can be cut) (UNIT 787, 1978). The cross section of the blocks produced in Uruguay are not bigger than that value, so the compressive strength tests are always done in whole units.
The quality control procedure divides the paving blocks production in batches. A batch includes no more than 5000 units. A sample of 9 units must be taken from each batch for the tests (three for compressive strength test, three for absorption test and three for abrasion test). In a working day, 19000 units can be produced (making a paving surface approximately of 380m2), thus, 36 units are to be taken and tested for their quality control.
This article is part of the work to revision and actualization of the concrete paving blocks Uruguayan standard carried out by the Structures and Transport Institute (IET) of the Engineering University (UdelaR). One of the revision topics is the reduction of the number of blocks needed for the tests, to simplify the work control. The possibility that all tests (compressive, absorption and abrasion) could be done with a single unit is analyzed here, which would mean to reduce the blocks to one third. In this way, the aim of this article is to validate the compressive strength test in half-unit specimens, comparing experimental tests results in whole units and half-units block from 24 production batches.
The main difference between a whole and half-unit blocks is their length. This study analyzes the way to normalize the test results to one length unit using a conversion factor. Specific conversion factors are not considered in the literature about this topic.
The whole unit blocks have a cross section about twice bigger than a half-unit, then for the same strength resistance level, the maximum load needed to be applied by the testing machine should be double than the one needed for a half-unit block (for example for a strength of 45MPa, the maximum load needed for the whole unit is of about 1100kN and for a half-unit only 550kN). Nowadays the maximum load capacity of testing machines is not a limiting factor, although smaller cross sections allow the use of smaller machines, like the ones still used on sites. In addition, testing half-unit takes less time to perform the tests.
It is to highlight that form the current international regulations for the concrete paving blocks quality control (ASTM C936, 2016; BS EN 1338, 2003; IRAM 11656, 2010; ICONTEC 2017, 2004; NTON 12 009, 2010), only the ASTM C936 (test procedure indicated by the ASTM C140, 2017) and the NTON 12 009, consider the compressive strength resistance as a requirement. In both cases, in recent actualizations, a correction factor was included for the results of testing units with different thickness/width relation. However, there is no reference made to the results of testing units of the same thickness/width relation but with different length, which is the case between whole and half-unit paving block.
1.2 Influence of the plate restriction linked to the specimen form, on the compressive strength test result.
The compressive strength is the result of the quotient of the maximum test load (until rupture) and the cross section of the specimen tested. Thus, the test results differences for specimens produced with the same concrete and the same compaction and curing procedure, should be just random, typical of the production process itself. However, there are some factors that could modify the test results, like factors related to the test itself and the condition of the specimen prior to the test (Cánovas, 2007; Bazant, 2000; Nerville, 2011; Newman y Choo, 2003; Lamond y Pielert, 2006).
Among these factors, the effect of the machine plate restriction on the specimen being tested can be mentioned. The plates produce a lateral movement restriction on the supporting surface, which could modify the test result, depending on the specimen slenderness and its geometry. This restriction depends on the friction coefficient surface-plate (which depends on the specimen heading used) and the cross section of the specimen. (Indelicato y Paggi, 2008; Van Vliet y Van Mier, 1995; Van Mier et. al., 1997; Barbosa et al., 2010).
For specimen of low slenderness, the effect of the restriction (Figure 1) can be verified in the difference between the lateral deformation of the specimen when subjected to the load plate restriction (with a compressive stress (1 and a friction stress (12) (Figure 1a) and when not (subjected only to compressive stress (1, for example by interposing a Teflon layer between the oil surface of the specimen and the loading plates of the machine) (Figure 1b). This movement restriction and a low specimen slenderness, affect the compressive strength test result (Barbosa et al., 2010).
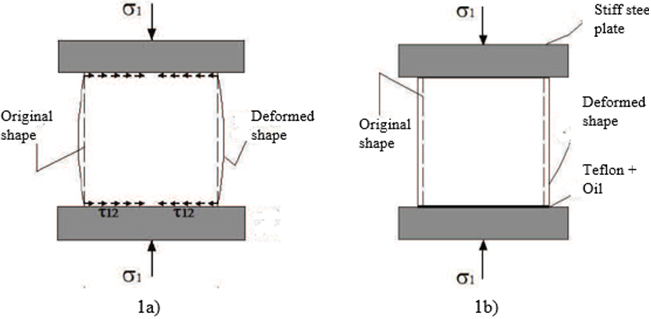
Figure 1 Effect of the loading plates restriction on specimens of low slenderness. Figure 1a): test without any headings. Figure 1b): interposing a Teflon layer on the specimen oil surface (from Barbosa et al., 2010).
The slenderness factor for cylindrical section specimens is defined as the quotient of the height by the diameter, while for square (or rectangular) section is defined as the quotient of the height and its width. Therefore, considering the effect of the loading plates restriction and for specimens of low slenderness, the test result should be adjusted by a slenderness factor, to obtain a normalize compressive strength resistance value. This value shall not depend on the form or size of the tested specimen. Following are mentioned some references from the literature were slenderness factors are indicated: ASTM C42 (2012); ASTM C140 (2017); BS EN 12504-1 (2009); UNIT-NM 69 (1998); IM (2001).
2. MATERIALS AND METHODOLOGY
2.1 Materials
For this study, paving block units from different production batches of a local producer were analyzed. The blocks were selected randomly from each batch, testing specimens from 24 batches.
The concrete paving blocks are precast elements produced with medium-size sand, small gravel 2-5mm, grey crashed rock 5-14 mm, normal Portland cement and water.
Molds are fulfilled with concrete, which is automatically vibro-pressed, until the blocks have the desired dimension and density. The proportions as well as the pressure of the vibro-pressing procedure depend on the desire strength of the batches. The blocks are steam cured and stocked up until they are moved to the site to be used, or until the test day, after the age of 28 days.
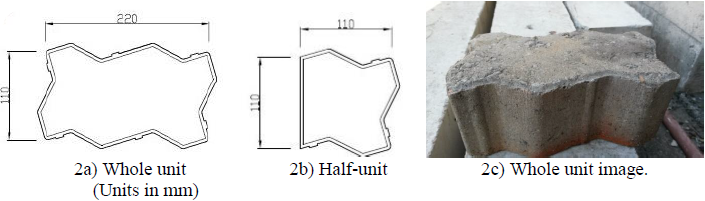
The cross section of the blocks tested are shown on Figure 2a) (whole unit) and Figure 2b) (half-unit). According to their shape, they can be identified as blocks Type Unistone, with a nominal thickness of 10cm, bevel on the upper surface and lateral fitting (Figure 2c).
The test procedure for the compressive strength determination was the one indicated in the UNIT-NM 101 (1998), considering blocks in natural humidity. Half-units were obtained by sawing the whole units across the smaller axis, with a diamond saw.
A MDF (medium-density-fiberboard) was used between the blocks and the loading plates of the test machine for a better load distribution.
The test machine used was the C056P122 Model from MATEST, with a maximum load capacity of 2000kN, and load speed control (average load speed for the tests of 0,25MPa/s).
2.2 Methodology
From each batch, 4 whole blocks and 4 half-unit blocks were tested. The individual compressive strength resistance was calculated as the quotient of the maximum test load by the nominal cross section of the specimen for each block (identified as find_whole y find_half).
The nominal section (SNblock) for each block type was determined as the product of the nominal dimensions indicated in Figure 2a) and 2b).
As the bevel depth is tiny compared to the block thickness (bevel of 5mm, nominal block thickness of 100mm), the upper section decrease was not considered in the cross-section calculation.
The batch compressive strength result for each block type (whole block units and half units), was calculated as the average of the individual valid test results of each batch (identified as fexp_whole for the whole block and fexp_half for the half-unit). To validate the individual test results, it was used the rule of the maximum range (rmax) from the guidelines given by the CIRSOC 201 (2005) (Argentinian Regulation) for the concrete compliance control using cylindrical section specimens. The range r was calculated as the difference of the maximum individual value (find_max) and the minimum individual value (find_min) divided by the average of the batch for each block type (fexp), according to equation (1). r-value was limited to 20% of the average value fexp, according to equation (2) for both block types.
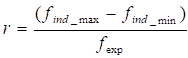 (1)
(1)
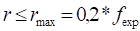 (2)
(2)
If r was greater than 20% of fexp in a batch, the most remote value was discarded and the r-value was calculated again for the rest of the individual values, verifying and re-calculating the new batch average (fexp_whole for a whole block and fexp_half for a half-unit).
The block tested were selected randomly from each production batch, belonging to the same type of concrete, subjected to the same curing procedure, storage and tested under similar conditions (natural humidity at test, same testing machine, same loading speed, same heading). Both type of blocks (whole and half-unit) had the same height (equal to the block thickness) and the same width. However, their length was different (this was the main difference between them).
Since there are no specific coefficients for specimen with rectangular cross section to normalize the test results to a unique length, coefficients from the literature for cylindrical cross section of concrete were considered (ASTM C42, 2012; BS EN 12504-1, 2009; UNIT-NM 69, 1998; IM, 2001). It was defined an equivalent diameter d eq , according to equation (3). This corresponds to a diameter of a circular section of the same area as the cross section of the blocks SNblock. With this parameter d eq it was possible to consider the variation of the supporting surface of the load plates while modifying the length of the cross section of the block and considering their influence on the test result.
The slenderness of the blocks (eq,cy, considering them as cylindrical specimens, could be calculated from the equivalent diameter d eq and the block thickness e, according to equation (4).
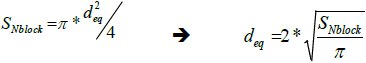 (3)
(3)
 (4)
(4)
With this coefficient λeq,cy it is possible to normalize compressive strength test results to cylindrical specimen of slenderness 2 (multiplying the test result by a correction factor “k” taken from the Table 1 of the IM reference). The k-values were chosen from the IM reference, because it considers coefficients of slenderness λ< 1 (as in the case of the analyzed blocks). These coefficients are the ones considered for cores taken from concrete pavements, being admitted λ values down to 0,5. According to Cánovas (2007) and Neville (2011), for low slenderness elements, the test results are strongly affected by the test machine load plates restriction. Thus, most standard restrict the slenderness of the specimens being tested to λ≥ 1 (as shown in Table 1).
Table 1 Strength conversion coefficient values k taken from the literature (reference value λ=2).
| Reference | Slenderness λ (height/diameter) | ||||||
| 0,50 | 0,75 | 1,00 | 1,25 | 1,50 | 1,75 | 2,00 | |
| ASTM C42, 2012 | - | - | 0,87 | 0,93 | 0,96 | 0,98 | 1,00 |
| BS EN 12504-1, 2009 | - | - | 0,80 | 0,87 | 0,92 | 0,97 | 1,00 |
| UNIT-NM 69, 1998 | - | - | 0,87 | 0,93 | 0,96 | 0,98 | 1,00 |
| IM, 2001 | 0,50 | 0,70 | 0,85 | 0,90 | 0,94 | 0,95 | 1,00 |
Table 2 resumes the geometrical characteristics for each block type, d eq , λ eq,cy and the k-value (k1 for the whole block and k2 for the half-unit blocks) taken according to the equivalent slenderness λeq,cy (considering linearity between the ( values given in the Table 1 of the IM).
Table 2 Characteristics of the tested blocks.
| Block type |
Nominal thickness (e) (cm) |
Nominal cross section (SNadoq.) (cm2) |
Equivalent diameter (deq) (cm) |
Equivalent slenderness (λeq,cil) - |
Slenderness correction factor (k) - |
| Whole block | 10 | 242 | 17,55 | 0,57 | k1= 0,56 |
| Half-unit block | 10 | 121 | 12,41 | 0,81 | k2= 0,74 |
(Note: the geometrical values are nominal ones, being the half-unit block sawed across the smaller axis)
For each batch analyzed, the strength resistance of the whole blocks and of half-unit blocks were normalized to cylindrical specimens with a slenderness of 2, according to equation (5) and equation (6), multiplying the average experimental results by the correction factor k1 and k2 from Table 2 (identifying them as fk1_whole and fk2_half).
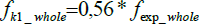 (5)
(5)
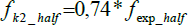 (6)
(6)
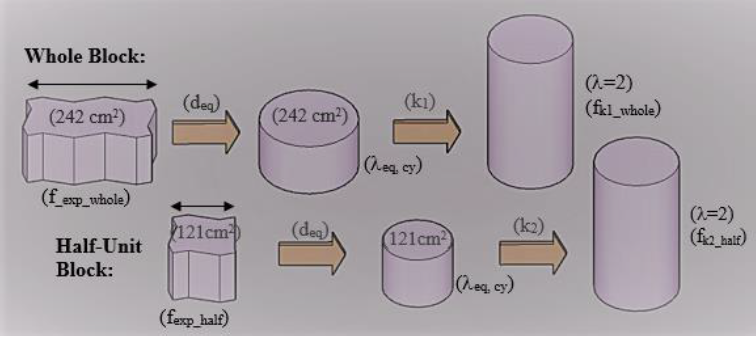
Summarizing, the basis of the procedure is to analyze the differences between the experimental results of the strength resistance in a whole block and in a half-unit block. If a significant difference between them existed, the following hypothesis was taken: the main difference could be explained because of the length change of the block tested. Then, applying a conversion factor that allowed normalizing the test results to a unique specimen size, it was possible to analyze how important the obtained differences were (the working scheme is shown in Figure 3).
If the difference between the results normalized to a unique specimen size (( = 2) is not significant, it can be considered that the differences between the experimental test results is taken up by the chosen coefficient, therefore the considered theory is true. This methodology analysis was considered in the work of the ICPI (Interlocking Concrete Pavement Institute) and the NCMA (National Concrete Masonry Association) for the determination of the coefficients given by the ASTM C140 for prismatic specimen (Walloch et al., 2014). This work analyzes the significance of the differences between the test results applying the corresponding correction coefficient.
To link the experimental results, the coefficient kexp_block is defined as the quotient between the strength resistance in a whole block and in half-unit blocks, according to equation (7). Similarly, the coefficient kfk_block is defined as the quotient between both strength resistances, normalized to a slenderness of 2, according to equation (8).
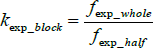 (7)
(7)
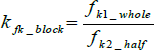 (8)
(8)
The T-Test of averages was used to analyze the differences between the strength average of the whole blocks (fexp_whole) and the strength average of the half-unit blocks (fexp_half) for each production batch. The null hypothesis H0 considers that both average values belong to the same strength resistance group. If H0 is rejected, with a confidence level of 95% (p-value<0,05) both averages are different, and the strength resistance of a whole block is different from the one of the half-unit block for each batch.
Finally, the experimental results of the compression resistance in whole blocks were charted against the experimental results in half-unit blocks (fexp_whole vs fexp_half). A lineal correlation model and a polynomial correlation model (of second-order, both without intercept) were adopted and the adjustment by least-squares techniques to the experimental data was analyzed.
3. RESULTS AND DISCUSSION
3.1 Compression strength resistance: experimental results and normalized to a unique specimen size results.
Figure 4a) shows a whole block unit ready for the test, Figure 4b) the typical rupture obtained for a whole block and Figure 4c) the typical rupture obtained for a half-unit block.
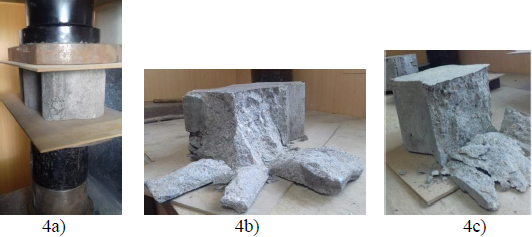
Figure 4 Images of a whole block ready to be tested (4a), typical rupture for a whole block (4b) and typical rupture for a half-unit block (4c).
As mentioned in the Introduction (in 1.2), for low slenderness specimens, the whole unit height will be affected by the loading plate restriction. This effect can be identified in the compression test by the formation of a cone-shaped rupture (Van Vliet y Van Mier, 1995). For the blocks, in both cases, whole and half-unit, this type of failure was observed, thus the whole height of the specimen was subjected to this effect.
The experimental results charted for the strength resistance of whole blocks and for the half unit blocks, showed the strength evolution in the tested batches (Figure 5). The average values of the batches (fexp_whole y fexp_half) and the individual maximum and minimum results for each batch for both block types are indicated on the chart (find_whole_max y find_whole_min for whole blocks and find_half_max y find_half_min for half-unit blocks). The results are in MPa.
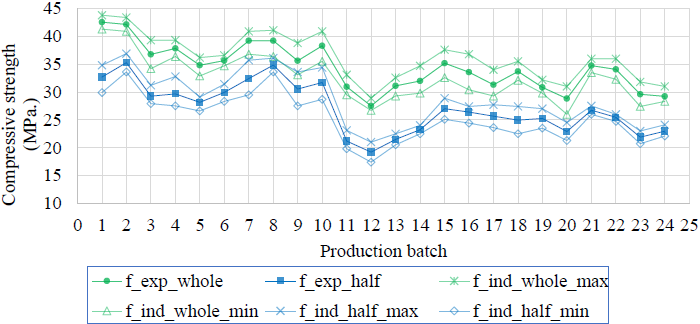
The maximum strength resistance value for the whole blocks was 42,6MPa in the batch number 1 and the minimum value was 27,5MPa in batch 12. For the half-unit blocks, the maximum value found was 35,5MPa in batch 2 and the minimum was 19,2MPa in batch 12.
Although a high result variability was found while changing from one production batch to the next (associated to differences in the production itself and to a limited production quality control of the blocks), it can be seen in Figure 5 that for each tested batch the fexp_whole result was higher than the fexp_half result. This difference was analyzed with the T-Test of averages, considering the following null hypothesis H0: fexp_whole was equal to fexp_half for each batch. It was always obtained a p-value<0,05, thus, the null hypothesis is rejected and with a confidence of 95% it is accepted that the results obtained for the whole blocks and the half-unit blocks were different.
Also the fexp_whole and fexp_half were different, a relationship between them can be observed on the chart fexp_whole vs fexp_half: when the strength resistance for the half-unit blocks grew, it also grew for the whole unit, as shown in Figure 6 (the straight-line y = x drawn gave a reference for values having the same x- and y-axis).
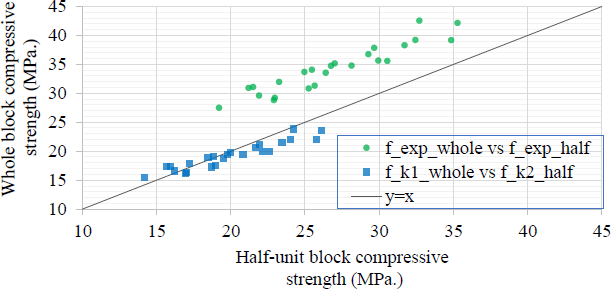
The influence of the length of the specimen on the compressive strength result was analyzed, being this the main difference between both type of blocks tested. The equivalent diameter d eq was obtained for each type of blocks according to equation (3) and its equivalent slenderness λeq,cy was calculated according to equation (4). The normalized strength resistance for both types of blocks (fk1_whole y fk2_half according to equations (5) y (6)) was obtained from this parameter (fexp_whole and fexp_half) and the correction coefficient taken for the literature (coefficients from IM, Table 1).
While normalizing the strength resistance to a unique size of specimen, the results were similar: the values of fk1_entero vs fk2_medio are really near the straight-line y = x, as shown in Figure 6. Thus, the main difference between the experimental results, can be associated to the considered coefficient.
Nan Vliet and Van Mier (1995) tested square section specimens (10cm x 10cm) with heights from 2,5cm to 20cm, using too types of heading systems: specimen directly on the loading plates of the testing machine (with the subsequent high friction as shown in Figure 1a), and with the interjection of a teflon layer between the specimen and the loading plates (low friction, the loading plates do not restrain the lateral movement, as shown in Figure 1b). Only for the cases where the specimen was under the plate restriction, the test result was significantly modified while varying the slenderness, considering a concrete strength resistance of 54MPa in cubes of 15cm). The different cross deformation at the loading surface and at the half height of the specimen (when specimen directly on the loading plate tested), confirm the restriction generated by the loading plates.
Idelicato and Paggi (2010) studied the results differences of cylindrical specimens (height/diameter=2) and (height/side=1) for different loading plates restriction conditions during the tests. They found that these differences depend on the friction level and the subsequent plate restriction. Only for specimens with a slenderness equal or bigger than two, the test result is not affected by this fact. Thus, for low slenderness specimens (such as blocks), the whole specimen will be subjected to the plates restriction (Figure 1a) and as indicated by Nan Vliet and Van Mier (1995) and Idelicato and Paggi (2010), the strength test result will be strongly affected by the restriction that reaches the whole specimen height.
The half-unit block presents a nearly square cross section (11cmx11cm), thus, the correction coefficient adopted in this work (k2=0,74), is among the correction factors reported in the literature for cubic specimens (between 0,72 and 1,02) (Zabihi and Eren, 2014; Yi, et al., 2006).
The coefficients given in the literature are mean values that depend on several factors, such as: humidity condition, heading type, strength resistance level and the elasticity moduli as the most important ones (Zabihi and Eren, 2014; ASTM C42, 2012). Since it was possible to “absorb” the main differences between both types of blocks (whole and half-unit) by the adjustment with the coefficient given by the IM, it was not necessary to up in the literature for more possible adjustment coefficients.
As mentioned in the Introduction, for concrete prismatic specimens, the coefficients to normalize the resistance indicated in the literature only consider the influence of the quotient of the height by its width. The ASTM C140 (2017), Annex A4, considers a conversion coefficient (Fa) for specimen with a quotient of thickness to width (Ra) different to 0,612 (the thickness varies between 6cm and 12 cm, but it maintains a cross section for the test of 9,8cm x 19,8cm). Therefore, the differences obtained for the blocks in this work cannot be associated to the slenderness coefficient given by this standard.
Another difference between both types of blocks tested was the sawing of the half-unit blocks, but as it was possible to “absorb” the results differences by a slenderness coefficient, it is considered that this variable did not affect significantly the test result.
3.2 Influence of the strength resistance level on the results.
In order to analyze the influence of the strength resistance level on the differences between the results of both block types the coefficient kexp_block was defined as the quotient of both experimental results according to equation (7). The chart kexp_block vs fexp_half (Figure 7) shows that for low strength values the kexp_block value was 1,46 (for batch 12), but that for higher resistance levels, the kexp_block values decreased to 1,12 (for batch 8), presenting a mean value of 1,28.
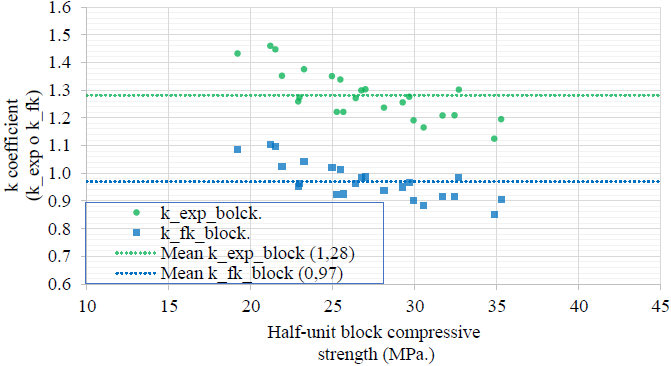
For the quotient of the normalized resistance values (k_fk_bolck according equation (8)), the coefficient obtained had a maximum of 1,10 (for batch 11) and a minimum of 0,85 (batch 12) and a mean value of 0,97. All these values are very close to the unit, confirming this way the equality between the resistance normalized values (between f_k1_whole and f_k2_half).
This coefficient kexp_block showed that the relationship between the strength resistance on a whole block and on a half-unit block depends on the resistance level. For low resistance, the differences found were bigger than for higher resistance levels. This is in accordance to ASTM C42 (2012) which indicates that the coefficient used for normal concrete resistance (between 14MPa and 42MPa), shall not be used for high strength concretes, where coefficient closer to the unit should be used.
Yi, et al. (2006) showed that the conversion factor for cubic specimens (10cm x 10cm x 10cm) to cilindrical specimens (15 cm x 30cm) was 0,82 for a strength resistance between 27MPa and 43MPa (considered as normal resistance concretes) and of 0,92 for a strength resistance higher than 66MPa (considered as high strength resistance concretes). A similar conclusion arises from the work from Nan Vliet y Van Mier (1995), the authors indicate that for high strength resistance concretes the differences between the results were smaller than those for a strength resistance of 54MPa.
In all cases, while the resistance grows, the concrete has a higher stiffness, thus it has a smaller cross deformation. In this way, the restriction generated by the loading plates has less influence on the test result. This happened with the experimental results on blocks: while the resistance grew, the coefficient kexp_block decreased (approching to the unit).
3.3 Correlation between experimental results of whole and half-unit blocks.
The conclusion from the analysis done in chapter 3.1 was that the main difference between the experimental results from whole blocks and half-unit blocks was a consequence of the effect of the restriction generated by the loading plates of the test machine when changing the length of the specimen tested. Therefore, both results are correlated.
The regression coefficients adjusted by the least-squares technique to the experimental results adopting two behavior models (linear and second-order polynomial function, both without intercept) were calculated (Figure 8).
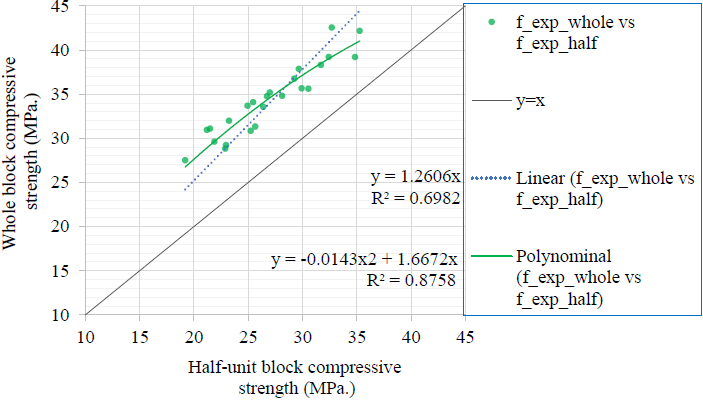
Figure 8 Relationship between the strength resistance on whole blocks and half-unit blocks and the correlation models adopted.
The model of the polynomial function of second-order, without independent term, presented a better adjustment to the experimental results with an r2 of 0,88, while the r2 for the model of the lineal function was of 0,70.
As shown in 3.2, when the strength resistance grew, the difference between the strength resistance results on whole and half-unit blocks was smaller, thus the coefficient relating them (kexp_block) varies with the concrete resistance level. Because of that, the points on the fexp_whole vs fexp_half chart (Figure 8) are closer to the straight-line y=x for higher strength resistance values. This reinforces the fact that the polynomial function had a better adjustment to the experimental results.
With the polynomial function, the r2 obtained was of 0,88, being very near to 0,90 (minimum value for r2 to consider the math model acceptable for the correlation of the results). Therefore, for the studied strength resistance range, between 27,5MPa and 42,6MPa on whole blocks, it is considered that both results can be related by the coefficient kexp_block (according equation 7). This coefficient varied between 1,46 (for lower resistance values) and 1,12 (for higher resistance values), with a mean value of 1,28.
The current UNIT 787 standard indicates that the test result, calculated from at least three whole blocks, must be bigger or equal to 35MPa for pedestrian and ordinary vehicular circulation and 45MPa for special vehicular circulation. Thus, the experimental work shall be extended in order to consider more batches (to obtain a better adjustment of the math model considered, with an r2>0,90) and a strength resistance range with higher values.
4. CONCLUSIONS
For blocks belonging to the same batch (with the same concrete and the same production and curing procedure) the compression strength test result for the whole block was higher than for the half-unit block for all the analyzed batches. However, after using a form correction factor and normalizing the test result to a unique specimen size, no significant differences were found between both results. Therefore, it can be concluded that the main cause of the difference was the length of the specimen.
The experimental values of the whole and half-unit block were linked by a polynomial function of second-order, without independent term. The adjustment by the least-squares technique to the experimental data gave an r2 close to 0,90, which suggest a good adjustment, considering the limited number of batches tested and the results dispersion.
Despite the work limitations, the results suggest that the compressive strength resistance could be determined testing on a half-unit block, validating the test on these specimens by this way.
The other block half could be used for other tests, with the subsequent less blocks quantity needed and the possibility of using a test machine of a smaller loading capacity, being these limiting factors for a quality control on the work site.
The resistance range of this study didn´t cover the range considered in the UNIT 787 standard (35 MPa and 45MPa). For this reason, the work should be extended testing more batches, including a larger range of resistances (considering also other specimen thickness and forms).
5. Acknowledgements
Thanks to the Structures and Transport Institute (IET) of the Engineering University (UdelaR) for the equipment and laboratory necessary to carry out the tests, as well as the company that supplied the paving blocks for the study. Thanks to the anonymous reviewers of RA journal, who enriched this work with their contributions. In special, an acknowledgment to teacher P.M. of the Sciences University (UdelaR) for her contribution in the methodology to present research works of technical-scientific subject.
REFERENCES
ASTM C140/C140M (2017), “Standard Test Methods for Sampling and Testing Concrete Masonry Units and Related Units ”, ASTM International, (West Conshohocken), PA, 2017, p. 25, DOI: 10.1520/C0140_C0140M-17, http://www.astm.org. [ Links ]
ASTM C42/C42M (2012), “Standard Test Method for Obtaining and Testing Drilled Cores and Sawed Beams of Concrete” ASTM International, (West Conshohocken), PA, 2012, p. 8, DOI: 10.1520/C0042_C0042M-12, http://www.astm.org. [ Links ]
ASTM C936/C936M (2016), “Standard Specification for Solid Concrete Interlocking Paving Units ”, ASTM International, (West Conshohocken), PA, 2016, p. 4, DOI: 10.1520/C0936_C0936M-16, http://www.astm.org. [ Links ]
Barbosa, C., Hanai, J., Lourenço, P.,“Numerical validation of compressive strength prediction for hollow concrete blocks”, in: 8th International Masonry Conference 201. (Dresden, Germany) (2010), pp. 1625-1634. http://hdl.handle.net/1822/17279. [ Links ]
Bazant, Z. (2000), “Size Effect”, International Journal of Solids and Structures.V. 37, No.1-2, pp. 69-80. [ Links ]
BS EN 12504-1 (2009), “Testing concrete in structures. Cored specimens. Taking, examining and testing in compression”, British Standards, (London, UK), p. 20. DOI:10.3403/30164918U [ Links ]
BS EN 1338 (2003), “Concrete paving blocks. Requirements and test methods”, British Standards, (London, UK) , p. 76. DOI:10.3403/02817150. [ Links ]
Cánovas, M. (2007), “Hormigón”. Octava edición. Colegio de Ingenieros de Caminos, Canales y Puertos. (Madrid, España). ISNBN: 97838003640. [ Links ]
CIRSOC 201 (2005), “Reglamento Argentino de Estructuras de Hormigón”. Centro de Investigación de los Reglamentos Nacionales de Seguridad para las Obras Civiles, (Buenos Aires, Argentina), p.482. [ Links ]
Indelicato, F., Paggi, M., (2008) “Specimen shape and problem of contact in the assessment of concrete compressive strength ”. Materials and Structures, V.41, No.2, pp.431-441. DOI: 10.1617/s11527-007-9256-7. [ Links ]
IM (2001), “Pliego general de condiciones para la construcción de pavimentos de hormigón .”, Intendencia de Montevideo (Montevideo, Uruguay), IM, p. 79. [ Links ]
IRAM 11656 (2010), “Adoquines de hormigón para pavimentos intertrabados. Requisitos y Métodos de Ensayo .”, Instituto Argentino de Normalización y Certificación (Argentina), p. 16. [ Links ]
Lamond, F, Pielert, J. (2006) “Significance of Tests and Properties of Concrete and Concrete-making Materials” ASTM International, STP 169D (USA), p 219. [ Links ]
Neville A. (2011) “Properties of Concrete” 5ta Edición. Pearson Education Limited. (Essex, Endgland). p. 846. ISBN: 978-0-273-75580-7 [ Links ]
Newman, J., Choo, B. (2003) “Advanced concrete Technology. Testing and Quality ”, Elsevier. (Oxford, UK), p.313. ISBN: 0-7506-5106-7. [ Links ]
ICONTEC 2017 (2004), “Adoquines de Concreto para Pavimentos”, Norma Técnica Colombiana, (Colombia), p. 6. [ Links ]
NTON 12 009 (2010), “Adoquines de Concreto”, Comisión de Normalización Técnica y Calidad, Ministerio de Fomento, Industria y Comercio, (Nicaragua), p.13. [ Links ]
RILEM TC148-SSC (1997) “Strain-Softening of Concrete in Uniaxial Compression ”. International Union of Laboratories and Experts in Construction Materials, Systems and Structures. V.30, pp. 195-209. [ Links ]
UNIT-NM 69 (1998), “Hormigón. Extracción, preparación y ensayo de testigos de estructuras de hormigón.”, Instituto Uruguayo De Normas Técnicas (Montevideo, Uruguay, UNIT), p. 12. [ Links ]
UNIT-NM 787 (1989), “Adoquines de hormigón de cemento Portland.”, Instituto Uruguayo De Normas Técnicas (Montevideo, Uruguay, UNIT), p. 5. [ Links ]
UNIT-NM 101 (1998), “Hormigón. Ensayo de compresión de probetas cilíndricas ”, Instituto Uruguayo De Normas Técnicas, (Montevideo, Uruguay), p. 7. [ Links ]
Van Mier, J., Shah, S., Arnaud, M. et al. (1997), “Strain-softening of concrete in uniaxial compression” (RILEM Technical Committees RILEM TC 148-SSC: Test Methods for the Strain-softening Response of Concrete) Materials and Structures V.30, pp. 195-209. DOI:10.1007/BF02486177. [ Links ]
Van Vliet M., Van Mier, J. (1995), “Softening Behaviour ofConcrete Under Uniaxial Compression ”, Fracture Mechanics of Concrete Structures, AEDIFICATIO Publishers (Freiburg, Germany). [ Links ]
Walloch, C., Lang, N., Smith, D. (2014), “Compressive Strength Testing of Concrete Paving Units: Research on Configuration of Tested Specimens and Effects of Variables in Specimen Capping ”, (ASTM-STP1577), (USA), pp. 233-262. DOI: 10.1520/STP157720130181. [ Links ]
Yi, S., Yan, E., Choi, J. (2006), “Specimen shape and the problem of contact in the assessment of concrete compressive strength ”, Nuclear Engineering and Design V. 236, No. 2 , pp.115-127. [ Links ]
Zabihi, N., Eren, Ö. (2014), “Compressive Strength Conversion Factors of Concrete as Affected by Specimen Shape and Size ”, Research Journal of Applied Sciences, Engineering and Technology, V.7, No. 20, pp.4251-4257. ISSN: 2040-7459 (e-ISSN: 2040-7467). [ Links ]
Received: February 24, 2017; Accepted: August 11, 2017
 Este es un artículo publicado en acceso abierto bajo una licencia Creative Commons
